Pakistani Disability Age 5 to 17
COMPARE
Pakistani
Select to Compare
Disability Age 5 to 17
Pakistani Disability Age 5 to 17
5.5%
DISABILITY | AGE 5 TO 17
87.3/ 100
METRIC RATING
144th/ 347
METRIC RANK
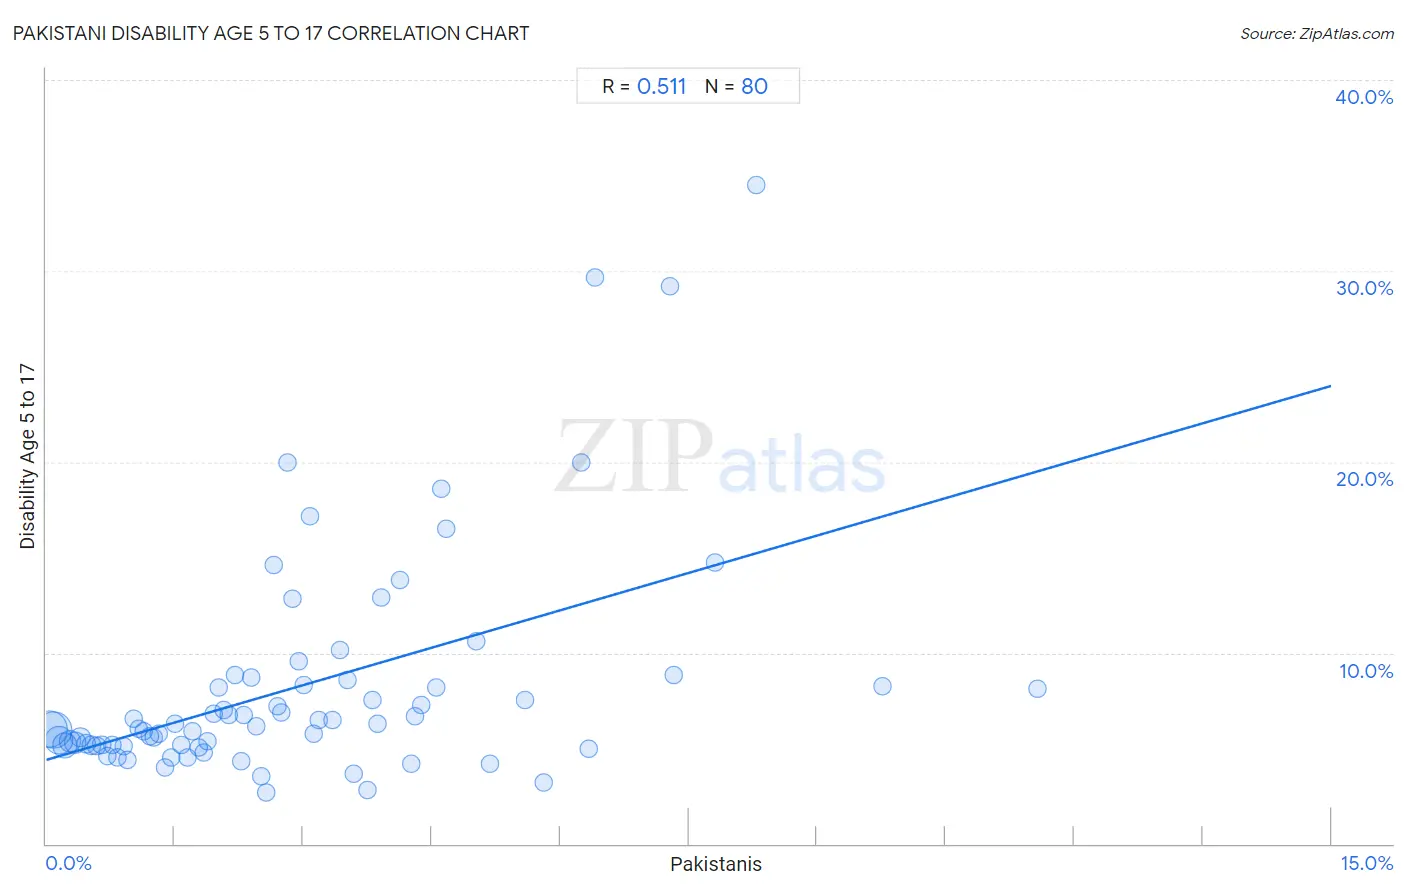
Pakistani Disability Age 5 to 17 Correlation Chart
The statistical analysis conducted on geographies consisting of 333,128,103 people shows a substantial positive correlation between the proportion of Pakistanis and percentage of population with a disability between the ages 5 and 17 in the United States with a correlation coefficient (R) of 0.511 and weighted average of 5.5%. On average, for every 1% (one percent) increase in Pakistanis within a typical geography, there is an increase of 1.3% in percentage of population with a disability between the ages 5 and 17.
It is essential to understand that the correlation between the percentage of Pakistanis and percentage of population with a disability between the ages 5 and 17 does not imply a direct cause-and-effect relationship. It remains uncertain whether the presence of Pakistanis influences an upward or downward trend in the level of percentage of population with a disability between the ages 5 and 17 within an area, or if Pakistanis simply ended up residing in those areas with higher or lower levels of percentage of population with a disability between the ages 5 and 17 due to other factors.
Demographics Similar to Pakistanis by Disability Age 5 to 17
In terms of disability age 5 to 17, the demographic groups most similar to Pakistanis are Immigrants from Hungary (5.5%, a difference of 0.070%), Immigrants from Guatemala (5.5%, a difference of 0.080%), Colombian (5.5%, a difference of 0.090%), South American Indian (5.5%, a difference of 0.24%), and Albanian (5.5%, a difference of 0.37%).
| Demographics | Rating | Rank | Disability Age 5 to 17 |
| Navajo | 90.9 /100 | #137 | Exceptional 5.4% |
| Immigrants from Oceania | 90.8 /100 | #138 | Exceptional 5.4% |
| Belizeans | 90.8 /100 | #139 | Exceptional 5.4% |
| Immigrants from Netherlands | 90.5 /100 | #140 | Exceptional 5.4% |
| South American Indians | 89.3 /100 | #141 | Excellent 5.5% |
| Colombians | 88.0 /100 | #142 | Excellent 5.5% |
| Immigrants from Hungary | 87.9 /100 | #143 | Excellent 5.5% |
| Pakistanis | 87.3 /100 | #144 | Excellent 5.5% |
| Immigrants from Guatemala | 86.6 /100 | #145 | Excellent 5.5% |
| Albanians | 83.7 /100 | #146 | Excellent 5.5% |
| Immigrants from Albania | 83.1 /100 | #147 | Excellent 5.5% |
| Samoans | 81.9 /100 | #148 | Excellent 5.5% |
| Central Americans | 81.6 /100 | #149 | Excellent 5.5% |
| Guatemalans | 81.5 /100 | #150 | Excellent 5.5% |
| Estonians | 80.8 /100 | #151 | Excellent 5.5% |
Pakistani Disability Age 5 to 17 Correlation Summary
| Measurement | Pakistani Data | Disability Age 5 to 17 Data |
| Minimum | 0.034% | 2.7% |
| Maximum | 11.6% | 34.5% |
| Range | 11.5% | 31.8% |
| Mean | 3.0% | 8.3% |
| Median | 2.5% | 6.2% |
| Interquartile 25% (IQ1) | 1.2% | 5.2% |
| Interquartile 75% (IQ3) | 4.0% | 8.5% |
| Interquartile Range (IQR) | 2.8% | 3.3% |
| Standard Deviation (Sample) | 2.3% | 5.9% |
| Standard Deviation (Population) | 2.3% | 5.9% |
Correlation Details
| Pakistani Percentile | Sample Size | Disability Age 5 to 17 |
[ 0.0% - 0.5% ] 0.034% | 89,820,467 | 6.0% |
[ 0.0% - 0.5% ] 0.091% | 93,294,297 | 6.0% |
[ 0.0% - 0.5% ] 0.15% | 47,362,964 | 5.4% |
[ 0.0% - 0.5% ] 0.21% | 33,467,814 | 5.2% |
[ 0.0% - 0.5% ] 0.28% | 18,691,094 | 5.3% |
[ 0.0% - 0.5% ] 0.34% | 16,560,629 | 5.3% |
[ 0.0% - 0.5% ] 0.40% | 8,419,359 | 5.6% |
[ 0.0% - 0.5% ] 0.46% | 6,903,121 | 5.2% |
[ 0.5% - 1.0% ] 0.52% | 4,053,685 | 5.2% |
[ 0.5% - 1.0% ] 0.59% | 3,023,028 | 5.1% |
[ 0.5% - 1.0% ] 0.65% | 2,198,527 | 5.2% |
[ 0.5% - 1.0% ] 0.72% | 1,878,316 | 4.6% |
[ 0.5% - 1.0% ] 0.77% | 1,256,324 | 5.2% |
[ 0.5% - 1.0% ] 0.83% | 1,136,232 | 4.5% |
[ 0.5% - 1.0% ] 0.90% | 807,214 | 5.1% |
[ 0.5% - 1.0% ] 0.95% | 723,860 | 4.4% |
[ 1.0% - 1.5% ] 1.02% | 406,797 | 6.5% |
[ 1.0% - 1.5% ] 1.08% | 278,400 | 6.0% |
[ 1.0% - 1.5% ] 1.14% | 212,741 | 5.9% |
[ 1.0% - 1.5% ] 1.21% | 298,383 | 5.6% |
[ 1.0% - 1.5% ] 1.26% | 252,593 | 5.6% |
[ 1.0% - 1.5% ] 1.32% | 220,395 | 5.8% |
[ 1.0% - 1.5% ] 1.39% | 280,878 | 4.0% |
[ 1.0% - 1.5% ] 1.46% | 178,466 | 4.5% |
[ 1.5% - 2.0% ] 1.51% | 245,361 | 6.3% |
[ 1.5% - 2.0% ] 1.57% | 121,082 | 5.2% |
[ 1.5% - 2.0% ] 1.64% | 139,252 | 4.5% |
[ 1.5% - 2.0% ] 1.70% | 151,699 | 5.9% |
[ 1.5% - 2.0% ] 1.78% | 182,257 | 5.1% |
[ 1.5% - 2.0% ] 1.84% | 69,242 | 4.8% |
[ 1.5% - 2.0% ] 1.89% | 49,297 | 5.4% |
[ 1.5% - 2.0% ] 1.96% | 49,382 | 6.8% |
[ 2.0% - 2.5% ] 2.01% | 47,784 | 8.2% |
[ 2.0% - 2.5% ] 2.08% | 2,310 | 7.0% |
[ 2.0% - 2.5% ] 2.13% | 55,275 | 6.8% |
[ 2.0% - 2.5% ] 2.21% | 24,707 | 8.8% |
[ 2.0% - 2.5% ] 2.27% | 21,662 | 4.3% |
[ 2.0% - 2.5% ] 2.31% | 1,038 | 6.7% |
[ 2.0% - 2.5% ] 2.39% | 12,279 | 8.7% |
[ 2.0% - 2.5% ] 2.45% | 8,219 | 6.2% |
[ 2.5% - 3.0% ] 2.50% | 8,831 | 3.6% |
[ 2.5% - 3.0% ] 2.56% | 9,595 | 2.7% |
[ 2.5% - 3.0% ] 2.65% | 2,792 | 14.6% |
[ 2.5% - 3.0% ] 2.71% | 5,581 | 7.2% |
[ 2.5% - 3.0% ] 2.74% | 58,031 | 6.8% |
[ 2.5% - 3.0% ] 2.82% | 284 | 20.0% |
[ 2.5% - 3.0% ] 2.88% | 10,179 | 12.8% |
[ 2.5% - 3.0% ] 2.95% | 746 | 9.6% |
[ 3.0% - 3.5% ] 3.01% | 3,427 | 8.3% |
[ 3.0% - 3.5% ] 3.07% | 17,675 | 17.2% |
[ 3.0% - 3.5% ] 3.13% | 15,816 | 5.8% |
[ 3.0% - 3.5% ] 3.17% | 2,363 | 6.5% |
[ 3.0% - 3.5% ] 3.34% | 449 | 6.5% |
[ 3.0% - 3.5% ] 3.43% | 3,910 | 10.1% |
[ 3.5% - 4.0% ] 3.51% | 1,452 | 8.6% |
[ 3.5% - 4.0% ] 3.58% | 1,367 | 3.6% |
[ 3.5% - 4.0% ] 3.75% | 587 | 2.8% |
[ 3.5% - 4.0% ] 3.80% | 15,200 | 7.5% |
[ 3.5% - 4.0% ] 3.87% | 852 | 6.3% |
[ 3.5% - 4.0% ] 3.91% | 16,277 | 12.9% |
[ 4.0% - 4.5% ] 4.13% | 1,478 | 13.8% |
[ 4.0% - 4.5% ] 4.26% | 9,234 | 4.2% |
[ 4.0% - 4.5% ] 4.31% | 4,503 | 6.7% |
[ 4.0% - 4.5% ] 4.37% | 7,757 | 7.3% |
[ 4.5% - 5.0% ] 4.55% | 2,243 | 8.2% |
[ 4.5% - 5.0% ] 4.62% | 390 | 18.6% |
[ 4.5% - 5.0% ] 4.67% | 664 | 16.5% |
[ 5.0% - 5.5% ] 5.02% | 2,627 | 10.6% |
[ 5.0% - 5.5% ] 5.18% | 1,235 | 4.2% |
[ 5.5% - 6.0% ] 5.59% | 2,898 | 7.5% |
[ 5.5% - 6.0% ] 5.80% | 4,187 | 3.2% |
[ 6.0% - 6.5% ] 6.25% | 544 | 20.0% |
[ 6.0% - 6.5% ] 6.33% | 158 | 5.0% |
[ 6.0% - 6.5% ] 6.40% | 250 | 29.6% |
[ 7.0% - 7.5% ] 7.27% | 1,086 | 29.2% |
[ 7.0% - 7.5% ] 7.33% | 2,647 | 8.8% |
[ 7.5% - 8.0% ] 7.81% | 1,268 | 14.7% |
[ 8.0% - 8.5% ] 8.28% | 483 | 34.5% |
[ 9.5% - 10.0% ] 9.76% | 1,475 | 8.3% |
[ 11.5% - 12.0% ] 11.57% | 1,132 | 8.1% |