Slavic Disability Age 5 to 17
COMPARE
Slavic
Select to Compare
Disability Age 5 to 17
Slavic Disability Age 5 to 17
5.9%
DISABILITY | AGE 5 TO 17
0.9/ 100
METRIC RATING
259th/ 347
METRIC RANK
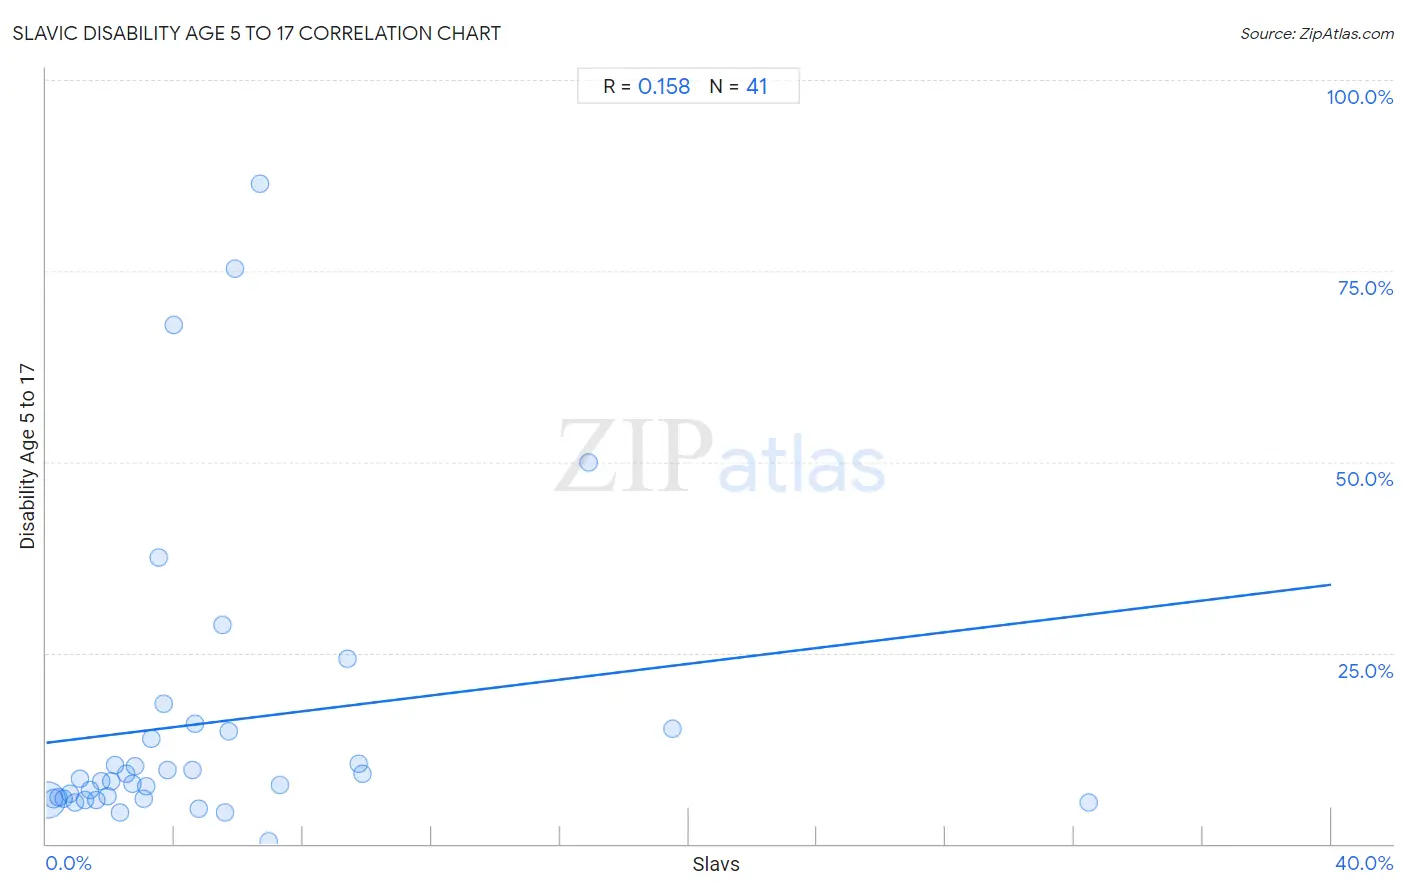
Slavic Disability Age 5 to 17 Correlation Chart
The statistical analysis conducted on geographies consisting of 269,139,689 people shows a poor positive correlation between the proportion of Slavs and percentage of population with a disability between the ages 5 and 17 in the United States with a correlation coefficient (R) of 0.158 and weighted average of 5.9%. On average, for every 1% (one percent) increase in Slavs within a typical geography, there is an increase of 0.52% in percentage of population with a disability between the ages 5 and 17.
It is essential to understand that the correlation between the percentage of Slavs and percentage of population with a disability between the ages 5 and 17 does not imply a direct cause-and-effect relationship. It remains uncertain whether the presence of Slavs influences an upward or downward trend in the level of percentage of population with a disability between the ages 5 and 17 within an area, or if Slavs simply ended up residing in those areas with higher or lower levels of percentage of population with a disability between the ages 5 and 17 due to other factors.
Demographics Similar to Slavs by Disability Age 5 to 17
In terms of disability age 5 to 17, the demographic groups most similar to Slavs are Brazilian (5.9%, a difference of 0.060%), Hispanic or Latino (5.9%, a difference of 0.090%), Somali (5.9%, a difference of 0.13%), Hopi (5.9%, a difference of 0.18%), and Immigrants from Middle Africa (5.9%, a difference of 0.20%).
| Demographics | Rating | Rank | Disability Age 5 to 17 |
| Hondurans | 1.5 /100 | #252 | Tragic 5.9% |
| Scandinavians | 1.4 /100 | #253 | Tragic 5.9% |
| Barbadians | 1.3 /100 | #254 | Tragic 5.9% |
| Italians | 1.2 /100 | #255 | Tragic 5.9% |
| Hopi | 1.0 /100 | #256 | Tragic 5.9% |
| Hispanics or Latinos | 1.0 /100 | #257 | Tragic 5.9% |
| Brazilians | 0.9 /100 | #258 | Tragic 5.9% |
| Slavs | 0.9 /100 | #259 | Tragic 5.9% |
| Somalis | 0.8 /100 | #260 | Tragic 5.9% |
| Immigrants from Middle Africa | 0.7 /100 | #261 | Tragic 5.9% |
| Immigrants from Western Africa | 0.7 /100 | #262 | Tragic 5.9% |
| Czechoslovakians | 0.7 /100 | #263 | Tragic 5.9% |
| Canadians | 0.6 /100 | #264 | Tragic 6.0% |
| Panamanians | 0.6 /100 | #265 | Tragic 6.0% |
| Slovenes | 0.6 /100 | #266 | Tragic 6.0% |
Slavic Disability Age 5 to 17 Correlation Summary
| Measurement | Slavic Data | Disability Age 5 to 17 Data |
| Minimum | 0.050% | 0.37% |
| Maximum | 32.5% | 86.4% |
| Range | 32.4% | 86.0% |
| Mean | 5.0% | 15.8% |
| Median | 3.3% | 8.3% |
| Interquartile 25% (IQ1) | 1.6% | 5.9% |
| Interquartile 75% (IQ3) | 5.8% | 14.8% |
| Interquartile Range (IQR) | 4.2% | 8.9% |
| Standard Deviation (Sample) | 6.0% | 19.7% |
| Standard Deviation (Population) | 5.9% | 19.5% |
Correlation Details
| Slavic Percentile | Sample Size | Disability Age 5 to 17 |
[ 0.0% - 0.5% ] 0.050% | 240,388,092 | 5.7% |
[ 0.0% - 0.5% ] 0.22% | 19,387,752 | 5.9% |
[ 0.0% - 0.5% ] 0.39% | 5,106,847 | 6.0% |
[ 0.5% - 1.0% ] 0.56% | 1,852,491 | 5.9% |
[ 0.5% - 1.0% ] 0.73% | 1,011,600 | 6.6% |
[ 0.5% - 1.0% ] 0.89% | 483,730 | 5.4% |
[ 1.0% - 1.5% ] 1.04% | 249,997 | 8.5% |
[ 1.0% - 1.5% ] 1.22% | 239,511 | 5.6% |
[ 1.0% - 1.5% ] 1.36% | 141,266 | 7.1% |
[ 1.5% - 2.0% ] 1.54% | 97,280 | 5.8% |
[ 1.5% - 2.0% ] 1.72% | 28,477 | 8.2% |
[ 1.5% - 2.0% ] 1.90% | 27,990 | 6.1% |
[ 2.0% - 2.5% ] 2.03% | 31,850 | 8.3% |
[ 2.0% - 2.5% ] 2.14% | 8,550 | 10.4% |
[ 2.0% - 2.5% ] 2.31% | 36,594 | 4.2% |
[ 2.5% - 3.0% ] 2.50% | 3,239 | 9.1% |
[ 2.5% - 3.0% ] 2.69% | 707 | 7.8% |
[ 2.5% - 3.0% ] 2.78% | 7,083 | 10.2% |
[ 3.0% - 3.5% ] 3.05% | 3,539 | 5.9% |
[ 3.0% - 3.5% ] 3.12% | 12,150 | 7.6% |
[ 3.0% - 3.5% ] 3.27% | 1,896 | 13.7% |
[ 3.5% - 4.0% ] 3.51% | 741 | 37.5% |
[ 3.5% - 4.0% ] 3.65% | 795 | 18.3% |
[ 3.5% - 4.0% ] 3.78% | 2,834 | 9.6% |
[ 3.5% - 4.0% ] 3.96% | 303 | 67.9% |
[ 4.5% - 5.0% ] 4.54% | 2,910 | 9.6% |
[ 4.5% - 5.0% ] 4.65% | 409 | 15.8% |
[ 4.5% - 5.0% ] 4.74% | 2,194 | 4.5% |
[ 5.0% - 5.5% ] 5.48% | 420 | 28.6% |
[ 5.5% - 6.0% ] 5.55% | 595 | 4.2% |
[ 5.5% - 6.0% ] 5.69% | 598 | 14.7% |
[ 5.5% - 6.0% ] 5.89% | 526 | 75.3% |
[ 6.5% - 7.0% ] 6.67% | 150 | 86.4% |
[ 6.5% - 7.0% ] 6.94% | 2,493 | 0.37% |
[ 7.0% - 7.5% ] 7.29% | 768 | 7.7% |
[ 9.0% - 9.5% ] 9.36% | 951 | 24.3% |
[ 9.5% - 10.0% ] 9.73% | 658 | 10.4% |
[ 9.5% - 10.0% ] 9.85% | 132 | 9.1% |
[ 16.5% - 17.0% ] 16.88% | 154 | 50.0% |
[ 19.0% - 19.5% ] 19.50% | 995 | 15.0% |
[ 32.0% - 32.5% ] 32.46% | 422 | 5.4% |