Immigrants Disability Age 5 to 17
COMPARE
Immigrants
Select to Compare
Disability Age 5 to 17
Immigrants Disability Age 5 to 17
5.4%
DISABILITY | AGE 5 TO 17
97.0/ 100
METRIC RATING
120th/ 347
METRIC RANK
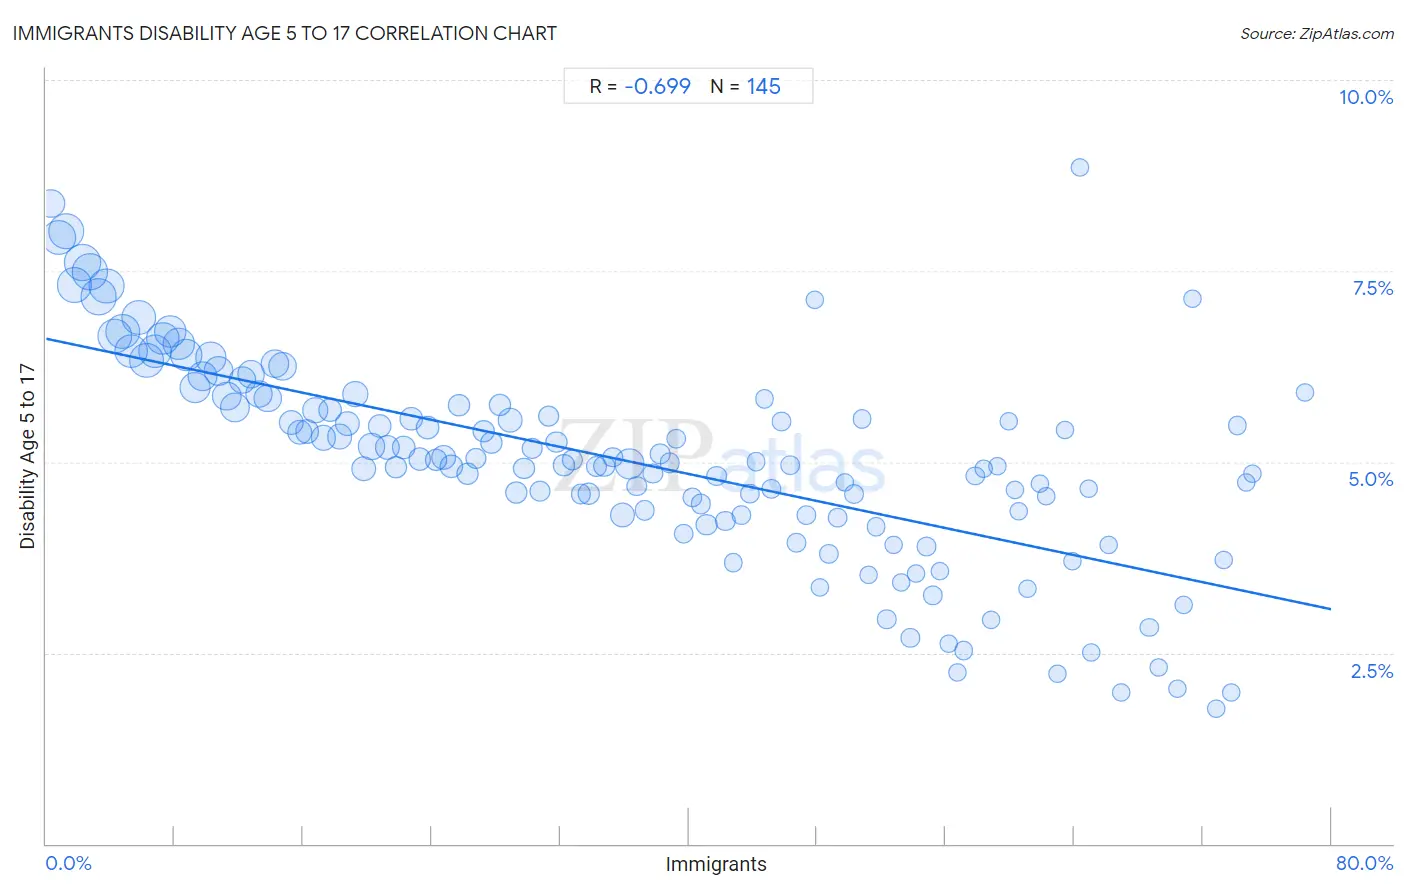
Immigrants Disability Age 5 to 17 Correlation Chart
The statistical analysis conducted on geographies consisting of 563,154,251 people shows a significant negative correlation between the proportion of Immigrants and percentage of population with a disability between the ages 5 and 17 in the United States with a correlation coefficient (R) of -0.699 and weighted average of 5.4%. On average, for every 1% (one percent) increase in Immigrants within a typical geography, there is a decrease of 0.044% in percentage of population with a disability between the ages 5 and 17.
It is essential to understand that the correlation between the percentage of Immigrants and percentage of population with a disability between the ages 5 and 17 does not imply a direct cause-and-effect relationship. It remains uncertain whether the presence of Immigrants influences an upward or downward trend in the level of percentage of population with a disability between the ages 5 and 17 within an area, or if Immigrants simply ended up residing in those areas with higher or lower levels of percentage of population with a disability between the ages 5 and 17 due to other factors.
Demographics Similar to Immigrants by Disability Age 5 to 17
In terms of disability age 5 to 17, the demographic groups most similar to Immigrants are Immigrants from South America (5.4%, a difference of 0.050%), South American (5.4%, a difference of 0.060%), Immigrants from Afghanistan (5.3%, a difference of 0.17%), Cypriot (5.3%, a difference of 0.33%), and Maltese (5.4%, a difference of 0.38%).
| Demographics | Rating | Rank | Disability Age 5 to 17 |
| Aleuts | 97.8 /100 | #113 | Exceptional 5.3% |
| Immigrants from Northern Europe | 97.8 /100 | #114 | Exceptional 5.3% |
| Cubans | 97.8 /100 | #115 | Exceptional 5.3% |
| Cypriots | 97.7 /100 | #116 | Exceptional 5.3% |
| Immigrants from Afghanistan | 97.4 /100 | #117 | Exceptional 5.3% |
| South Americans | 97.1 /100 | #118 | Exceptional 5.4% |
| Immigrants from South America | 97.1 /100 | #119 | Exceptional 5.4% |
| Immigrants | 97.0 /100 | #120 | Exceptional 5.4% |
| Maltese | 96.0 /100 | #121 | Exceptional 5.4% |
| Chileans | 95.8 /100 | #122 | Exceptional 5.4% |
| Immigrants from Ethiopia | 95.5 /100 | #123 | Exceptional 5.4% |
| Crow | 95.0 /100 | #124 | Exceptional 5.4% |
| Immigrants from Chile | 95.0 /100 | #125 | Exceptional 5.4% |
| New Zealanders | 95.0 /100 | #126 | Exceptional 5.4% |
| Latvians | 95.0 /100 | #127 | Exceptional 5.4% |
Immigrants Disability Age 5 to 17 Correlation Summary
| Measurement | Immigrants Data | Disability Age 5 to 17 Data |
| Minimum | 0.28% | 1.8% |
| Maximum | 78.4% | 8.9% |
| Range | 78.1% | 7.1% |
| Mean | 36.5% | 5.0% |
| Median | 36.3% | 5.0% |
| Interquartile 25% (IQ1) | 18.0% | 4.3% |
| Interquartile 75% (IQ3) | 54.5% | 5.7% |
| Interquartile Range (IQR) | 36.5% | 1.4% |
| Standard Deviation (Sample) | 21.5% | 1.4% |
| Standard Deviation (Population) | 21.4% | 1.4% |
Correlation Details
| Immigrants Percentile | Sample Size | Disability Age 5 to 17 |
[ 0.0% - 0.5% ] 0.28% | 8,953,790 | 8.4% |
[ 0.5% - 1.0% ] 0.76% | 13,926,673 | 7.9% |
[ 1.0% - 1.5% ] 1.25% | 15,015,129 | 8.0% |
[ 1.5% - 2.0% ] 1.75% | 14,953,307 | 7.3% |
[ 2.0% - 2.5% ] 2.24% | 16,062,437 | 7.6% |
[ 2.5% - 3.0% ] 2.74% | 15,173,435 | 7.5% |
[ 3.0% - 3.5% ] 3.24% | 15,176,941 | 7.2% |
[ 3.5% - 4.0% ] 3.75% | 14,356,549 | 7.3% |
[ 4.0% - 4.5% ] 4.25% | 14,205,631 | 6.6% |
[ 4.5% - 5.0% ] 4.75% | 13,549,562 | 6.7% |
[ 5.0% - 5.5% ] 5.26% | 13,070,445 | 6.5% |
[ 5.5% - 6.0% ] 5.75% | 13,968,260 | 6.9% |
[ 6.0% - 6.5% ] 6.25% | 13,363,696 | 6.3% |
[ 6.5% - 7.0% ] 6.75% | 12,854,482 | 6.5% |
[ 7.0% - 7.5% ] 7.24% | 12,334,668 | 6.6% |
[ 7.5% - 8.0% ] 7.74% | 11,375,253 | 6.7% |
[ 8.0% - 8.5% ] 8.23% | 11,695,621 | 6.5% |
[ 8.5% - 9.0% ] 8.74% | 11,809,849 | 6.4% |
[ 9.0% - 9.5% ] 9.25% | 10,585,646 | 6.0% |
[ 9.5% - 10.0% ] 9.76% | 9,680,382 | 6.1% |
[ 10.0% - 10.5% ] 10.26% | 11,433,794 | 6.4% |
[ 10.5% - 11.0% ] 10.74% | 10,070,690 | 6.2% |
[ 11.0% - 11.5% ] 11.24% | 8,734,067 | 5.9% |
[ 11.5% - 12.0% ] 11.76% | 9,766,700 | 5.7% |
[ 12.0% - 12.5% ] 12.22% | 7,487,541 | 6.1% |
[ 12.5% - 13.0% ] 12.75% | 7,784,266 | 6.1% |
[ 13.0% - 13.5% ] 13.25% | 7,048,677 | 5.9% |
[ 13.5% - 14.0% ] 13.80% | 8,156,952 | 5.8% |
[ 14.0% - 14.5% ] 14.24% | 8,693,481 | 6.3% |
[ 14.5% - 15.0% ] 14.73% | 8,432,569 | 6.3% |
[ 15.0% - 15.5% ] 15.24% | 5,306,900 | 5.5% |
[ 15.5% - 16.0% ] 15.77% | 5,834,399 | 5.4% |
[ 16.0% - 16.5% ] 16.23% | 4,934,771 | 5.4% |
[ 16.5% - 17.0% ] 16.74% | 5,997,792 | 5.7% |
[ 17.0% - 17.5% ] 17.25% | 5,875,689 | 5.3% |
[ 17.5% - 18.0% ] 17.70% | 4,065,902 | 5.7% |
[ 18.0% - 18.5% ] 18.25% | 5,915,158 | 5.3% |
[ 18.5% - 19.0% ] 18.78% | 5,547,067 | 5.5% |
[ 19.0% - 19.5% ] 19.26% | 5,880,630 | 5.9% |
[ 19.5% - 20.0% ] 19.73% | 5,361,750 | 4.9% |
[ 20.0% - 20.5% ] 20.27% | 7,039,711 | 5.2% |
[ 20.5% - 21.0% ] 20.77% | 4,775,269 | 5.5% |
[ 21.0% - 21.5% ] 21.23% | 5,498,506 | 5.2% |
[ 21.5% - 22.0% ] 21.77% | 3,687,359 | 4.9% |
[ 22.0% - 22.5% ] 22.23% | 4,368,960 | 5.2% |
[ 22.5% - 23.0% ] 22.73% | 4,272,271 | 5.6% |
[ 23.0% - 23.5% ] 23.24% | 3,727,811 | 5.0% |
[ 23.5% - 24.0% ] 23.76% | 4,136,560 | 5.5% |
[ 24.0% - 24.5% ] 24.28% | 3,533,523 | 5.0% |
[ 24.5% - 25.0% ] 24.75% | 5,486,468 | 5.1% |
[ 25.0% - 25.5% ] 25.25% | 4,133,271 | 4.9% |
[ 25.5% - 26.0% ] 25.69% | 2,820,913 | 5.7% |
[ 26.0% - 26.5% ] 26.24% | 3,188,990 | 4.8% |
[ 26.5% - 27.0% ] 26.76% | 2,744,055 | 5.0% |
[ 27.0% - 27.5% ] 27.27% | 3,294,373 | 5.4% |
[ 27.5% - 28.0% ] 27.73% | 2,957,288 | 5.2% |
[ 28.0% - 28.5% ] 28.24% | 3,326,570 | 5.7% |
[ 28.5% - 29.0% ] 28.86% | 5,073,379 | 5.5% |
[ 29.0% - 29.5% ] 29.27% | 3,102,708 | 4.6% |
[ 29.5% - 30.0% ] 29.76% | 2,763,518 | 4.9% |
[ 30.0% - 30.5% ] 30.27% | 2,655,015 | 5.2% |
[ 30.5% - 31.0% ] 30.74% | 2,226,621 | 4.6% |
[ 31.0% - 31.5% ] 31.31% | 2,370,017 | 5.6% |
[ 31.5% - 32.0% ] 31.76% | 2,820,587 | 5.3% |
[ 32.0% - 32.5% ] 32.21% | 2,870,716 | 5.0% |
[ 32.5% - 33.0% ] 32.75% | 2,356,648 | 5.0% |
[ 33.0% - 33.5% ] 33.28% | 1,714,620 | 4.6% |
[ 33.5% - 34.0% ] 33.74% | 3,236,727 | 4.6% |
[ 34.0% - 34.5% ] 34.23% | 1,739,051 | 4.9% |
[ 34.5% - 35.0% ] 34.74% | 2,377,790 | 4.9% |
[ 35.0% - 35.5% ] 35.27% | 1,576,363 | 5.1% |
[ 35.5% - 36.0% ] 35.91% | 5,364,888 | 4.3% |
[ 36.0% - 36.5% ] 36.32% | 10,439,674 | 5.0% |
[ 36.5% - 37.0% ] 36.77% | 1,273,393 | 4.7% |
[ 37.0% - 37.5% ] 37.26% | 1,582,882 | 4.4% |
[ 37.5% - 38.0% ] 37.76% | 1,514,757 | 4.8% |
[ 38.0% - 38.5% ] 38.23% | 1,922,735 | 5.1% |
[ 38.5% - 39.0% ] 38.81% | 1,571,839 | 5.0% |
[ 39.0% - 39.5% ] 39.23% | 1,115,119 | 5.3% |
[ 39.5% - 40.0% ] 39.68% | 1,172,739 | 4.1% |
[ 40.0% - 40.5% ] 40.25% | 1,226,325 | 4.5% |
[ 40.5% - 41.0% ] 40.76% | 1,731,268 | 4.4% |
[ 41.0% - 41.5% ] 41.11% | 2,626,411 | 4.2% |
[ 41.5% - 42.0% ] 41.73% | 1,522,826 | 4.8% |
[ 42.0% - 42.5% ] 42.28% | 1,493,759 | 4.2% |
[ 42.5% - 43.0% ] 42.78% | 796,609 | 3.7% |
[ 43.0% - 43.5% ] 43.26% | 883,685 | 4.3% |
[ 43.5% - 44.0% ] 43.78% | 1,255,230 | 4.6% |
[ 44.0% - 44.5% ] 44.20% | 367,717 | 5.0% |
[ 44.5% - 45.0% ] 44.72% | 846,624 | 5.8% |
[ 45.0% - 45.5% ] 45.14% | 860,395 | 4.6% |
[ 45.5% - 46.0% ] 45.75% | 677,013 | 5.5% |
[ 46.0% - 46.5% ] 46.31% | 764,646 | 5.0% |
[ 46.5% - 47.0% ] 46.72% | 675,376 | 3.9% |
[ 47.0% - 47.5% ] 47.30% | 838,509 | 4.3% |
[ 47.5% - 48.0% ] 47.83% | 274,396 | 7.1% |
[ 48.0% - 48.5% ] 48.14% | 166,857 | 3.4% |
[ 48.5% - 49.0% ] 48.74% | 834,508 | 3.8% |
[ 49.0% - 49.5% ] 49.28% | 845,905 | 4.3% |
[ 49.5% - 50.0% ] 49.69% | 161,880 | 4.7% |
[ 50.0% - 50.5% ] 50.29% | 637,516 | 4.6% |
[ 50.5% - 51.0% ] 50.79% | 728,892 | 5.6% |
[ 51.0% - 51.5% ] 51.17% | 285,135 | 3.5% |
[ 51.5% - 52.0% ] 51.67% | 302,301 | 4.2% |
[ 52.0% - 52.5% ] 52.32% | 204,028 | 2.9% |
[ 52.5% - 53.0% ] 52.77% | 231,990 | 3.9% |
[ 53.0% - 53.5% ] 53.23% | 133,339 | 3.4% |
[ 53.5% - 54.0% ] 53.81% | 463,452 | 2.7% |
[ 54.0% - 54.5% ] 54.17% | 368,970 | 3.5% |
[ 54.5% - 55.0% ] 54.78% | 593,586 | 3.9% |
[ 55.0% - 55.5% ] 55.18% | 482,104 | 3.3% |
[ 55.5% - 56.0% ] 55.61% | 146,820 | 3.6% |
[ 56.0% - 56.5% ] 56.17% | 89,843 | 2.6% |
[ 56.5% - 57.0% ] 56.71% | 75,557 | 2.2% |
[ 57.0% - 57.5% ] 57.13% | 110,375 | 2.5% |
[ 57.5% - 58.0% ] 57.84% | 597,049 | 4.8% |
[ 58.0% - 58.5% ] 58.34% | 93,758 | 4.9% |
[ 58.5% - 59.0% ] 58.80% | 221,458 | 2.9% |
[ 59.0% - 59.5% ] 59.19% | 86,760 | 4.9% |
[ 59.5% - 60.0% ] 59.93% | 14,371 | 5.5% |
[ 60.0% - 60.5% ] 60.30% | 153,212 | 4.6% |
[ 60.5% - 61.0% ] 60.53% | 35,967 | 4.4% |
[ 61.0% - 61.5% ] 61.09% | 50,975 | 3.3% |
[ 61.5% - 62.0% ] 61.88% | 128,561 | 4.7% |
[ 62.0% - 62.5% ] 62.28% | 93,794 | 4.5% |
[ 62.5% - 63.0% ] 62.94% | 2,318 | 2.2% |
[ 63.0% - 63.5% ] 63.43% | 24,597 | 5.4% |
[ 63.5% - 64.0% ] 63.91% | 115,987 | 3.7% |
[ 64.0% - 64.5% ] 64.33% | 109,357 | 8.9% |
[ 64.5% - 65.0% ] 64.88% | 104,741 | 4.6% |
[ 65.0% - 65.5% ] 65.07% | 48,096 | 2.5% |
[ 66.0% - 66.5% ] 66.17% | 152,851 | 3.9% |
[ 66.5% - 67.0% ] 66.91% | 109,218 | 2.0% |
[ 68.5% - 69.0% ] 68.68% | 119,624 | 2.8% |
[ 69.0% - 69.5% ] 69.26% | 90,791 | 2.3% |
[ 70.0% - 70.5% ] 70.39% | 115,169 | 2.0% |
[ 70.5% - 71.0% ] 70.79% | 137,895 | 3.1% |
[ 71.0% - 71.5% ] 71.37% | 45,620 | 7.1% |
[ 72.5% - 73.0% ] 72.85% | 57,066 | 1.8% |
[ 73.0% - 73.5% ] 73.31% | 29,830 | 3.7% |
[ 73.5% - 74.0% ] 73.75% | 19,399 | 2.0% |
[ 74.0% - 74.5% ] 74.15% | 257,738 | 5.5% |
[ 74.5% - 75.0% ] 74.68% | 46,798 | 4.7% |
[ 75.0% - 75.5% ] 75.10% | 71,088 | 4.8% |
[ 78.0% - 78.5% ] 78.37% | 42,081 | 5.9% |