Sudanese Disability Age 5 to 17
COMPARE
Sudanese
Select to Compare
Disability Age 5 to 17
Sudanese Disability Age 5 to 17
5.8%
DISABILITY | AGE 5 TO 17
2.9/ 100
METRIC RATING
237th/ 347
METRIC RANK
Sudanese Disability Age 5 to 17 Correlation Chart
The statistical analysis conducted on geographies consisting of 109,989,475 people shows a poor negative correlation between the proportion of Sudanese and percentage of population with a disability between the ages 5 and 17 in the United States with a correlation coefficient (R) of -0.109 and weighted average of 5.8%. On average, for every 1% (one percent) increase in Sudanese within a typical geography, there is a decrease of 0.099% in percentage of population with a disability between the ages 5 and 17.
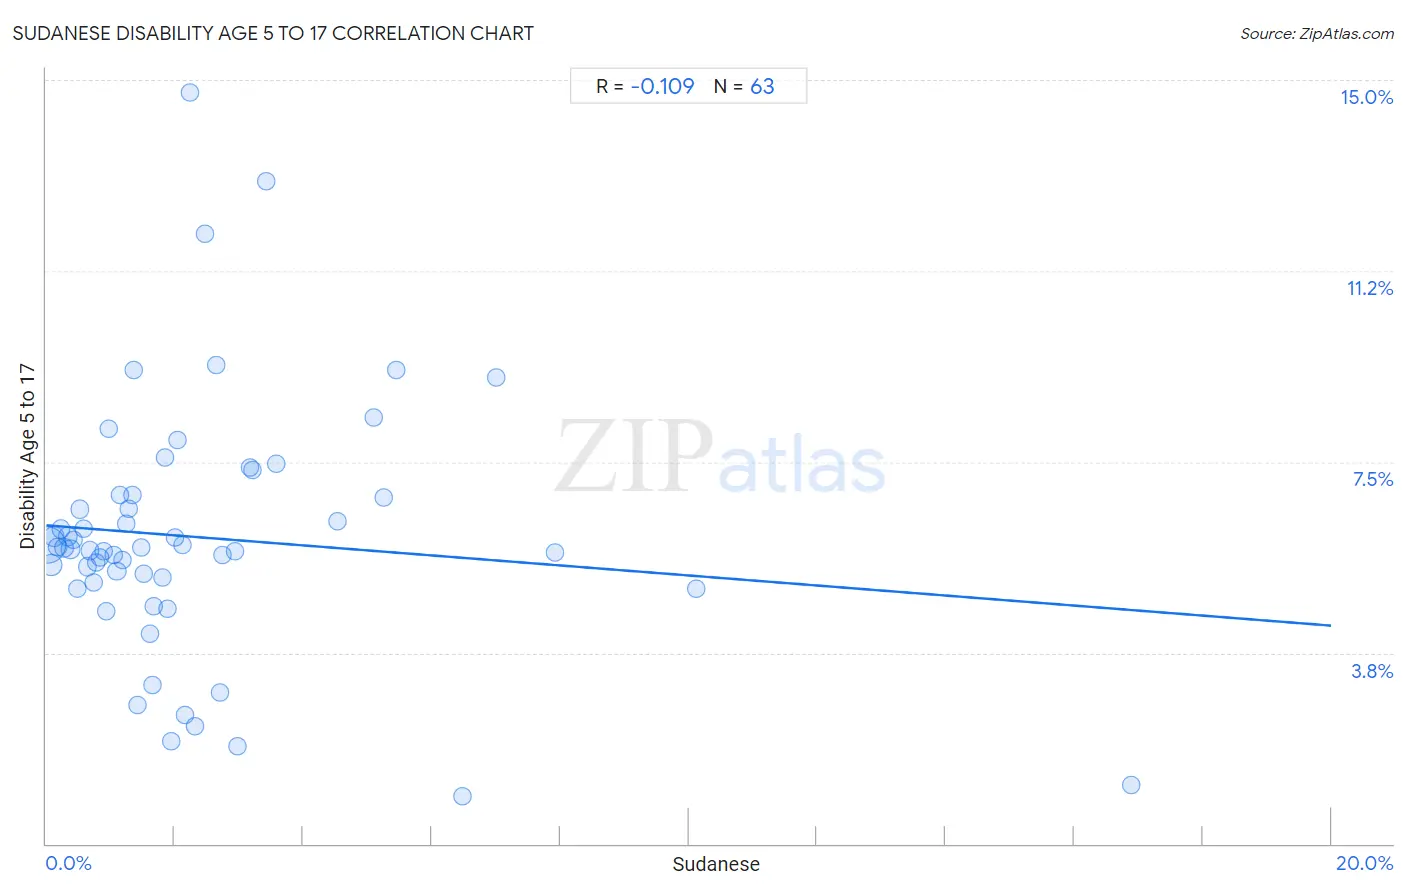
It is essential to understand that the correlation between the percentage of Sudanese and percentage of population with a disability between the ages 5 and 17 does not imply a direct cause-and-effect relationship. It remains uncertain whether the presence of Sudanese influences an upward or downward trend in the level of percentage of population with a disability between the ages 5 and 17 within an area, or if Sudanese simply ended up residing in those areas with higher or lower levels of percentage of population with a disability between the ages 5 and 17 due to other factors.
Demographics Similar to Sudanese by Disability Age 5 to 17
In terms of disability age 5 to 17, the demographic groups most similar to Sudanese are Hungarian (5.8%, a difference of 0.10%), Immigrants from Brazil (5.8%, a difference of 0.15%), German Russian (5.9%, a difference of 0.20%), Malaysian (5.8%, a difference of 0.21%), and Immigrants from Kenya (5.8%, a difference of 0.22%).
| Demographics | Rating | Rank | Disability Age 5 to 17 |
| Ghanaians | 4.7 /100 | #230 | Tragic 5.8% |
| Europeans | 4.5 /100 | #231 | Tragic 5.8% |
| Immigrants from Laos | 3.8 /100 | #232 | Tragic 5.8% |
| Immigrants from West Indies | 3.5 /100 | #233 | Tragic 5.8% |
| Immigrants from Kenya | 3.4 /100 | #234 | Tragic 5.8% |
| Malaysians | 3.4 /100 | #235 | Tragic 5.8% |
| Immigrants from Brazil | 3.2 /100 | #236 | Tragic 5.8% |
| Sudanese | 2.9 /100 | #237 | Tragic 5.8% |
| Hungarians | 2.6 /100 | #238 | Tragic 5.8% |
| German Russians | 2.4 /100 | #239 | Tragic 5.9% |
| West Indians | 2.4 /100 | #240 | Tragic 5.9% |
| Immigrants from Caribbean | 2.1 /100 | #241 | Tragic 5.9% |
| Spaniards | 2.0 /100 | #242 | Tragic 5.9% |
| Indonesians | 2.0 /100 | #243 | Tragic 5.9% |
| Immigrants from Germany | 1.9 /100 | #244 | Tragic 5.9% |
Sudanese Disability Age 5 to 17 Correlation Summary
| Measurement | Sudanese Data | Disability Age 5 to 17 Data |
| Minimum | 0.020% | 0.94% |
| Maximum | 16.9% | 14.8% |
| Range | 16.9% | 13.8% |
| Mean | 2.4% | 6.0% |
| Median | 1.6% | 5.8% |
| Interquartile 25% (IQ1) | 0.78% | 5.1% |
| Interquartile 75% (IQ3) | 2.7% | 6.9% |
| Interquartile Range (IQR) | 2.0% | 1.7% |
| Standard Deviation (Sample) | 2.7% | 2.5% |
| Standard Deviation (Population) | 2.7% | 2.5% |
Correlation Details
| Sudanese Percentile | Sample Size | Disability Age 5 to 17 |
[ 0.0% - 0.5% ] 0.020% | 68,837,711 | 5.9% |
[ 0.0% - 0.5% ] 0.075% | 13,815,627 | 5.5% |
[ 0.0% - 0.5% ] 0.13% | 7,051,970 | 6.0% |
[ 0.0% - 0.5% ] 0.18% | 3,633,874 | 5.8% |
[ 0.0% - 0.5% ] 0.22% | 2,480,983 | 6.2% |
[ 0.0% - 0.5% ] 0.28% | 2,215,579 | 5.8% |
[ 0.0% - 0.5% ] 0.33% | 2,739,166 | 6.0% |
[ 0.0% - 0.5% ] 0.38% | 898,411 | 5.8% |
[ 0.0% - 0.5% ] 0.43% | 1,073,442 | 6.0% |
[ 0.0% - 0.5% ] 0.48% | 973,619 | 5.0% |
[ 0.5% - 1.0% ] 0.53% | 1,002,090 | 6.6% |
[ 0.5% - 1.0% ] 0.58% | 529,129 | 6.2% |
[ 0.5% - 1.0% ] 0.65% | 829,757 | 5.4% |
[ 0.5% - 1.0% ] 0.68% | 327,261 | 5.8% |
[ 0.5% - 1.0% ] 0.73% | 394,831 | 5.1% |
[ 0.5% - 1.0% ] 0.78% | 194,664 | 5.5% |
[ 0.5% - 1.0% ] 0.83% | 292,745 | 5.6% |
[ 0.5% - 1.0% ] 0.89% | 230,407 | 5.8% |
[ 0.5% - 1.0% ] 0.93% | 214,821 | 4.6% |
[ 0.5% - 1.0% ] 0.98% | 107,636 | 8.1% |
[ 1.0% - 1.5% ] 1.05% | 205,660 | 5.7% |
[ 1.0% - 1.5% ] 1.10% | 361,784 | 5.3% |
[ 1.0% - 1.5% ] 1.15% | 88,579 | 6.9% |
[ 1.0% - 1.5% ] 1.19% | 49,109 | 5.6% |
[ 1.0% - 1.5% ] 1.24% | 84,796 | 6.3% |
[ 1.0% - 1.5% ] 1.29% | 119,830 | 6.6% |
[ 1.0% - 1.5% ] 1.33% | 263,517 | 6.9% |
[ 1.0% - 1.5% ] 1.37% | 58,210 | 9.3% |
[ 1.0% - 1.5% ] 1.42% | 24,018 | 2.7% |
[ 1.0% - 1.5% ] 1.48% | 62,837 | 5.8% |
[ 1.5% - 2.0% ] 1.52% | 39,237 | 5.3% |
[ 1.5% - 2.0% ] 1.61% | 6,278 | 4.1% |
[ 1.5% - 2.0% ] 1.65% | 10,760 | 3.1% |
[ 1.5% - 2.0% ] 1.68% | 35,223 | 4.7% |
[ 1.5% - 2.0% ] 1.82% | 119,866 | 5.2% |
[ 1.5% - 2.0% ] 1.84% | 21,801 | 7.6% |
[ 1.5% - 2.0% ] 1.89% | 52,472 | 4.6% |
[ 1.5% - 2.0% ] 1.94% | 12,595 | 2.0% |
[ 2.0% - 2.5% ] 2.01% | 29,580 | 6.0% |
[ 2.0% - 2.5% ] 2.04% | 33,194 | 7.9% |
[ 2.0% - 2.5% ] 2.12% | 82,775 | 5.9% |
[ 2.0% - 2.5% ] 2.16% | 40,938 | 2.5% |
[ 2.0% - 2.5% ] 2.23% | 404 | 14.8% |
[ 2.0% - 2.5% ] 2.31% | 29,261 | 2.3% |
[ 2.0% - 2.5% ] 2.47% | 51,386 | 12.0% |
[ 2.5% - 3.0% ] 2.64% | 13,087 | 9.4% |
[ 2.5% - 3.0% ] 2.71% | 68,762 | 3.0% |
[ 2.5% - 3.0% ] 2.73% | 7,863 | 5.7% |
[ 2.5% - 3.0% ] 2.93% | 25,129 | 5.7% |
[ 2.5% - 3.0% ] 2.97% | 21,583 | 1.9% |
[ 3.0% - 3.5% ] 3.17% | 3,093 | 7.4% |
[ 3.0% - 3.5% ] 3.22% | 31,976 | 7.3% |
[ 3.0% - 3.5% ] 3.42% | 1,082 | 13.0% |
[ 3.5% - 4.0% ] 3.58% | 3,440 | 7.5% |
[ 4.5% - 5.0% ] 4.53% | 22,340 | 6.3% |
[ 5.0% - 5.5% ] 5.10% | 24,028 | 8.4% |
[ 5.0% - 5.5% ] 5.26% | 2,586 | 6.8% |
[ 5.0% - 5.5% ] 5.45% | 9,681 | 9.3% |
[ 6.0% - 6.5% ] 6.47% | 9,917 | 0.94% |
[ 7.0% - 7.5% ] 7.01% | 10,086 | 9.2% |
[ 7.5% - 8.0% ] 7.92% | 2,727 | 5.7% |
[ 10.0% - 10.5% ] 10.12% | 1,206 | 5.0% |
[ 16.5% - 17.0% ] 16.88% | 3,056 | 1.2% |