Immigrants from Belgium Disability Age 5 to 17

COMPARE

Immigrants from Belgium
Race
Ancestry
AfghanAfricanAlaska NativeAlaskan AthabascanAlbanianAleutAlsatianAmericanApacheArabArapahoArgentineanArmenianAssyrian/Chaldean/SyriacAustralianAustrianBahamianBangladeshiBarbadianBasqueBelgianBelizeanBermudanBhutaneseBlackfeetBolivianBrazilianBritishBritish West IndianBulgarianBurmeseCajunCambodianCanadianCape VerdeanCarpatho RusynCelticCentral AmericanCentral American IndianCherokeeCheyenneChickasawChileanChineseChippewaChoctawColombianColvilleComancheCosta RicanCreeCreekCroatianCrowCubanCypriotCzechCzechoslovakianDanishDelawareDominicanDutchDutch West IndianEastern EuropeanEcuadorianEgyptianEnglishEstonianEthiopianEuropeanFijianFilipinoFinnishFrenchFrench American IndianFrench CanadianGermanGerman RussianGhanaianGreekGuamanian/ChamorroGuatemalanGuyaneseHaitianHmongHonduranHopiHoumaHungarianIcelanderIndian (Asian)IndonesianInupiatIranianIraqiIrishIroquoisIsraeliItalianJamaicanJapaneseJordanianKenyanKiowaKoreanLaotianLatvianLebaneseLiberianLithuanianLumbeeLuxembourgerMacedonianMalaysianMalteseMarshalleseMenomineeMexicanMexican American IndianMongolianMoroccanNative HawaiianNavajoNepaleseNew ZealanderNicaraguanNigerianNorthern EuropeanNorwegianOkinawanOsageOttawaPaiutePakistaniPalestinianPanamanianParaguayanPennsylvania GermanPeruvianPimaPolishPortuguesePotawatomiPuebloPuerto RicanPuget Sound SalishRomanianRussianSalvadoranSamoanScandinavianScotch-IrishScottishSeminoleSenegaleseSerbianShoshoneSierra LeoneanSiouxSlavicSlovakSloveneSomaliSouth AfricanSouth AmericanSouth American IndianSoviet UnionSpaniardSpanishSpanish AmericanSpanish American IndianSri LankanSubsaharan AfricanSudaneseSwedishSwissSyrianTaiwaneseThaiTlingit-HaidaTohono O'OdhamTonganTrinidadian and TobagonianTsimshianTurkishU.S. Virgin IslanderUgandanUkrainianUruguayanUteVenezuelanVietnameseWelshWest IndianYakamaYaquiYugoslavianYumanYup'ikZimbabwean
Immigration
NonimmigrantsImmigrantsAfghanistanAfricaAlbaniaArgentinaArmeniaAsiaAustraliaAustriaBahamasBangladeshBarbadosBelarusBelgiumBelizeBoliviaBosnia and HerzegovinaBrazilBulgariaBurma/MyanmarCabo VerdeCambodiaCameroonCanadaCaribbeanCentral AmericaChileChinaColombiaCongoCosta RicaCroatiaCubaCzechoslovakiaDenmarkDominicaDominican RepublicEastern AfricaEastern AsiaEastern EuropeEcuadorEgyptEl SalvadorEnglandEritreaEthiopiaEuropeFijiFranceGermanyGhanaGreeceGrenadaGuatemalaGuyanaHaitiHondurasHong KongHungaryIndiaIndonesiaIranIraqIrelandIsraelItalyJamaicaJapanJordanKazakhstanKenyaKoreaKuwaitLaosLatin AmericaLatviaLebanonLiberiaLithuaniaMalaysiaMexicoMicronesiaMiddle AfricaMoldovaMoroccoNepalNetherlandsNicaraguaNigeriaNorth AmericaNorth MacedoniaNorthern AfricaNorthern EuropeNorwayOceaniaPakistanPanamaPeruPhilippinesPolandPortugalRomaniaRussiaSaudi ArabiaScotlandSenegalSerbiaSierra LeoneSingaporeSomaliaSouth AfricaSouth AmericaSouth Central AsiaSouth Eastern AsiaSouthern EuropeSpainSri LankaSt. Vincent and the GrenadinesSudanSwedenSwitzerlandSyriaTaiwanThailandTrinidad and TobagoTurkeyUgandaUkraineUruguayUzbekistanVenezuelaVietnamWest IndiesWestern AfricaWestern AsiaWestern EuropeYemenZaireZimbabweAzores
Select to Compare
Race
Ancestry
AfghanAfricanAlaska NativeAlaskan AthabascanAlbanianAleutAlsatianAmericanApacheArabArapahoArgentineanArmenianAssyrian/Chaldean/SyriacAustralianAustrianBahamianBangladeshiBarbadianBasqueBelgianBelizeanBermudanBhutaneseBlackfeetBolivianBrazilianBritishBritish West IndianBulgarianBurmeseCajunCambodianCanadianCape VerdeanCarpatho RusynCelticCentral AmericanCentral American IndianCherokeeCheyenneChickasawChileanChineseChippewaChoctawColombianColvilleComancheCosta RicanCreeCreekCroatianCrowCubanCypriotCzechCzechoslovakianDanishDelawareDominicanDutchDutch West IndianEastern EuropeanEcuadorianEgyptianEnglishEstonianEthiopianEuropeanFijianFilipinoFinnishFrenchFrench American IndianFrench CanadianGermanGerman RussianGhanaianGreekGuamanian/ChamorroGuatemalanGuyaneseHaitianHmongHonduranHopiHoumaHungarianIcelanderIndian (Asian)IndonesianInupiatIranianIraqiIrishIroquoisIsraeliItalianJamaicanJapaneseJordanianKenyanKiowaKoreanLaotianLatvianLebaneseLiberianLithuanianLumbeeLuxembourgerMacedonianMalaysianMalteseMarshalleseMenomineeMexicanMexican American IndianMongolianMoroccanNative HawaiianNavajoNepaleseNew ZealanderNicaraguanNigerianNorthern EuropeanNorwegianOkinawanOsageOttawaPaiutePakistaniPalestinianPanamanianParaguayanPennsylvania GermanPeruvianPimaPolishPortuguesePotawatomiPuebloPuerto RicanPuget Sound SalishRomanianRussianSalvadoranSamoanScandinavianScotch-IrishScottishSeminoleSenegaleseSerbianShoshoneSierra LeoneanSiouxSlavicSlovakSloveneSomaliSouth AfricanSouth AmericanSouth American IndianSoviet UnionSpaniardSpanishSpanish AmericanSpanish American IndianSri LankanSubsaharan AfricanSudaneseSwedishSwissSyrianTaiwaneseThaiTlingit-HaidaTohono O'OdhamTonganTrinidadian and TobagonianTsimshianTurkishU.S. Virgin IslanderUgandanUkrainianUruguayanUteVenezuelanVietnameseWelshWest IndianYakamaYaquiYugoslavianYumanYup'ikZimbabwean
Immigration
NonimmigrantsImmigrantsAfghanistanAfricaAlbaniaArgentinaArmeniaAsiaAustraliaAustriaBahamasBangladeshBarbadosBelarusBelizeBoliviaBosnia and HerzegovinaBrazilBulgariaBurma/MyanmarCabo VerdeCambodiaCameroonCanadaCaribbeanCentral AmericaChileChinaColombiaCongoCosta RicaCroatiaCubaCzechoslovakiaDenmarkDominicaDominican RepublicEastern AfricaEastern AsiaEastern EuropeEcuadorEgyptEl SalvadorEnglandEritreaEthiopiaEuropeFijiFranceGermanyGhanaGreeceGrenadaGuatemalaGuyanaHaitiHondurasHong KongHungaryIndiaIndonesiaIranIraqIrelandIsraelItalyJamaicaJapanJordanKazakhstanKenyaKoreaKuwaitLaosLatin AmericaLatviaLebanonLiberiaLithuaniaMalaysiaMexicoMicronesiaMiddle AfricaMoldovaMoroccoNepalNetherlandsNicaraguaNigeriaNorth AmericaNorth MacedoniaNorthern AfricaNorthern EuropeNorwayOceaniaPakistanPanamaPeruPhilippinesPolandPortugalRomaniaRussiaSaudi ArabiaScotlandSenegalSerbiaSierra LeoneSingaporeSomaliaSouth AfricaSouth AmericaSouth Central AsiaSouth Eastern AsiaSouthern EuropeSpainSri LankaSt. Vincent and the GrenadinesSudanSwedenSwitzerlandSyriaTaiwanThailandTrinidad and TobagoTurkeyUgandaUkraineUruguayUzbekistanVenezuelaVietnamWest IndiesWestern AfricaWestern AsiaWestern EuropeYemenZaireZimbabweAzores
Disability Age 5 to 17
Income
Poverty
Unemployment
Labor Participation
Family Structure
Vehicle Availability
Education Level
Disability

Immigrants from Belgium Disability Age 5 to 17
Exceptional

5.2%
DISABILITY | AGE 5 TO 17
99.7/ 100
METRIC RATING
70th/ 347
METRIC RANK

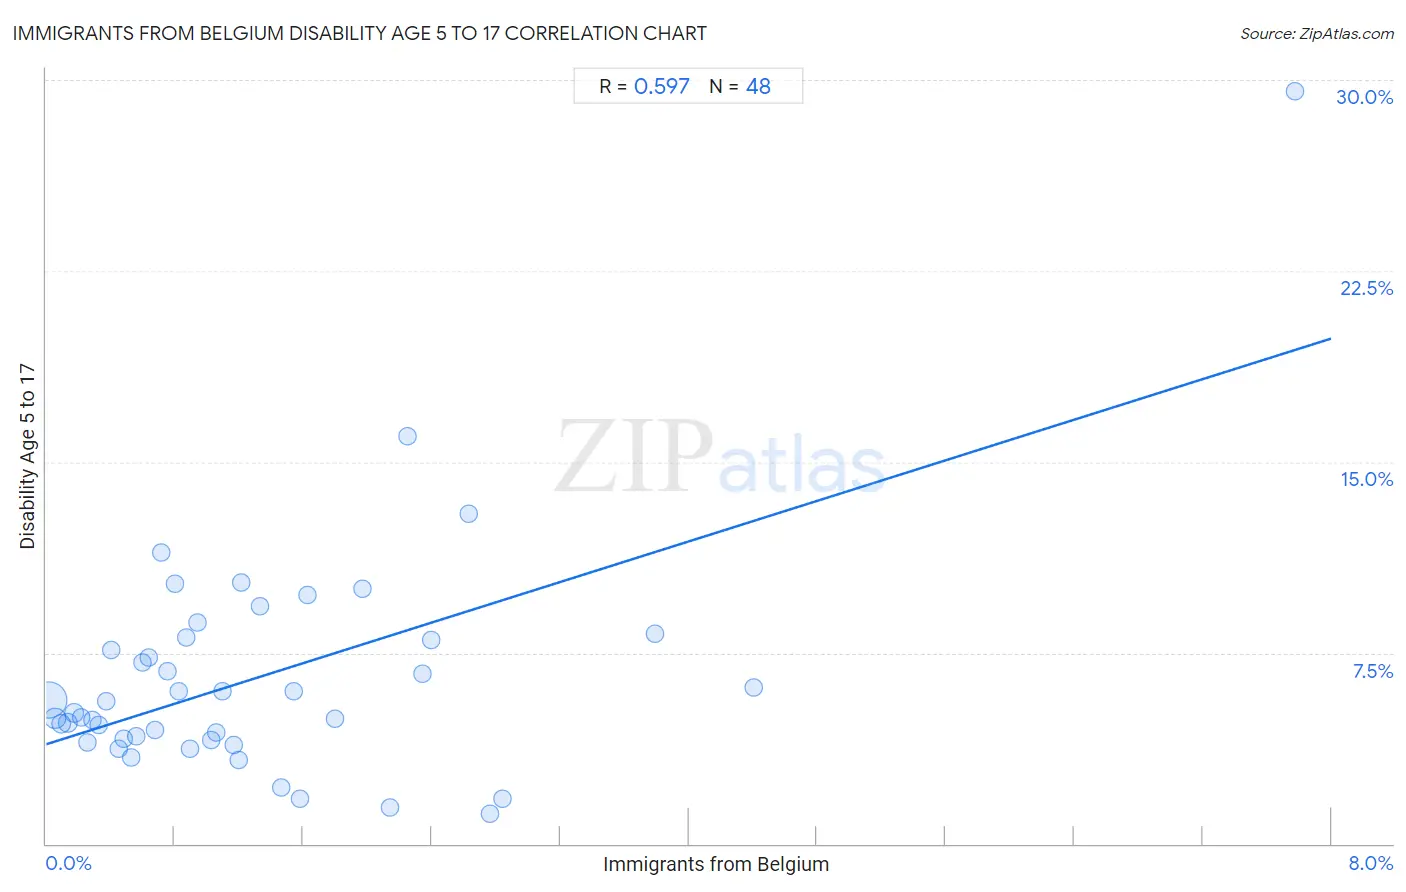
Immigrants from Belgium Disability Age 5 to 17 Correlation Chart

The statistical analysis conducted on geographies consisting of 146,050,104 people shows a substantial positive correlation between the proportion of Immigrants from Belgium and percentage of population with a disability between the ages 5 and 17 in the United States with a correlation coefficient (R) of 0.597 and weighted average of 5.2%. On average, for every 1% (one percent) increase in Immigrants from Belgium within a typical geography, there is an increase of 2.0% in percentage of population with a disability between the ages 5 and 17.
Immigrants from Belgium Disability Age 5 to 17
It is essential to understand that the correlation between the percentage of Immigrants from Belgium and percentage of population with a disability between the ages 5 and 17 does not imply a direct cause-and-effect relationship. It remains uncertain whether the presence of Immigrants from Belgium influences an upward or downward trend in the level of percentage of population with a disability between the ages 5 and 17 within an area, or if Immigrants from Belgium simply ended up residing in those areas with higher or lower levels of percentage of population with a disability between the ages 5 and 17 due to other factors.

Demographics Similar to Immigrants from Belgium by Disability Age 5 to 17

In terms of disability age 5 to 17, the demographic groups most similar to Immigrants from Belgium are Guyanese (5.2%, a difference of 0.040%), Jordanian (5.2%, a difference of 0.050%), Immigrants from Vietnam (5.2%, a difference of 0.070%), Immigrants from Czechoslovakia (5.2%, a difference of 0.090%), and Immigrants from Syria (5.2%, a difference of 0.15%).
DemographicsRating | RankDisability Age 5 to 17
Immigrants from Bangladesh
99.8
/100
|
#63
Exceptional
5.2%
Immigrants from South Eastern Asia
99.8
/100
|
#64
Exceptional
5.2%
Immigrants from Greece
99.8
/100
|
#65
Exceptional
5.2%
Palestinians
99.8
/100
|
#66
Exceptional
5.2%
Macedonians
99.8
/100
|
#67
Exceptional
5.2%
Immigrants from Syria
99.7
/100
|
#68
Exceptional
5.2%
Guyanese
99.7
/100
|
#69
Exceptional
5.2%
Immigrants from Belgium
99.7
/100
|
#70
Exceptional
5.2%
Jordanians
99.7
/100
|
#71
Exceptional
5.2%
Immigrants from Vietnam
99.7
/100
|
#72
Exceptional
5.2%
Immigrants from Czechoslovakia
99.7
/100
|
#73
Exceptional
5.2%
Immigrants from Romania
99.7
/100
|
#74
Exceptional
5.2%
Immigrants from Moldova
99.6
/100
|
#75
Exceptional
5.2%
Immigrants from Guyana
99.6
/100
|
#76
Exceptional
5.2%
Immigrants from Kazakhstan
99.6
/100
|
#77
Exceptional
5.2%

Immigrants from Belgium Disability Age 5 to 17 Correlation Summary

MeasurementImmigrants from Belgium DataDisability Age 5 to 17 Data
Minimum0.016%1.2%
Maximum7.8%29.6%
Range7.8%28.4%
Mean1.3%6.5%
Median0.92%5.4%
Interquartile 25% (IQ1)0.47%4.1%
Interquartile 75% (IQ3)1.7%8.0%
Interquartile Range (IQR)1.2%3.9%
Standard Deviation (Sample)1.4%4.6%
Standard Deviation (Population)1.4%4.5%

Correlation Details

Immigrants from Belgium PercentileSample SizeDisability Age 5 to 17
[
0.0%
-
0.5%
]
0.016%
108,544,5105.6%
[
0.0%
-
0.5%
]
0.055%
19,645,6094.9%
[
0.0%
-
0.5%
]
0.096%
7,717,5494.7%
[
0.0%
-
0.5%
]
0.13%
3,468,2104.8%
[
0.0%
-
0.5%
]
0.17%
2,610,5845.1%
[
0.0%
-
0.5%
]
0.21%
1,102,8775.0%
[
0.0%
-
0.5%
]
0.25%
624,5644.0%
[
0.0%
-
0.5%
]
0.29%
604,0244.9%
[
0.0%
-
0.5%
]
0.33%
374,4704.7%
[
0.0%
-
0.5%
]
0.37%
219,2835.6%
[
0.0%
-
0.5%
]
0.40%
261,1607.6%
[
0.0%
-
0.5%
]
0.45%
155,4253.7%
[
0.0%
-
0.5%
]
0.49%
85,6124.1%
[
0.5%
-
1.0%
]
0.53%
138,5553.4%
[
0.5%
-
1.0%
]
0.56%
138,4064.2%
[
0.5%
-
1.0%
]
0.60%
60,4287.1%
[
0.5%
-
1.0%
]
0.64%
23,7197.3%
[
0.5%
-
1.0%
]
0.67%
17,0724.5%
[
0.5%
-
1.0%
]
0.72%
11,88411.4%
[
0.5%
-
1.0%
]
0.76%
20,3626.8%
[
0.5%
-
1.0%
]
0.80%
7,70410.2%
[
0.5%
-
1.0%
]
0.82%
24,6566.0%
[
0.5%
-
1.0%
]
0.87%
107,7038.1%
[
0.5%
-
1.0%
]
0.90%
3,7883.8%
[
0.5%
-
1.0%
]
0.94%
2,3458.7%
[
1.0%
-
1.5%
]
1.03%
3,5014.1%
[
1.0%
-
1.5%
]
1.06%
26,5914.4%
[
1.0%
-
1.5%
]
1.10%
1,0006.0%
[
1.0%
-
1.5%
]
1.16%
1,7193.9%
[
1.0%
-
1.5%
]
1.20%
2,0003.3%
[
1.0%
-
1.5%
]
1.21%
4,11610.2%
[
1.0%
-
1.5%
]
1.33%
2,1859.3%
[
1.0%
-
1.5%
]
1.47%
1,2962.2%
[
1.5%
-
2.0%
]
1.54%
7,2626.0%
[
1.5%
-
2.0%
]
1.58%
1,2631.8%
[
1.5%
-
2.0%
]
1.62%
6169.8%
[
1.5%
-
2.0%
]
1.80%
1,1124.9%
[
1.5%
-
2.0%
]
1.97%
1,22010.0%
[
2.0%
-
2.5%
]
2.14%
9,0121.4%
[
2.0%
-
2.5%
]
2.25%
26716.0%
[
2.0%
-
2.5%
]
2.35%
8106.7%
[
2.0%
-
2.5%
]
2.40%
4,1668.0%
[
2.5%
-
3.0%
]
2.63%
2,89013.0%
[
2.5%
-
3.0%
]
2.76%
6,7731.2%
[
2.5%
-
3.0%
]
2.84%
2111.8%
[
3.5%
-
4.0%
]
3.79%
5548.3%
[
4.0%
-
4.5%
]
4.41%
6816.2%
[
7.5%
-
8.0%
]
7.78%
36029.6%