Female Poverty by Race, Ethnicity and Immigration Origin
SELECT DEMOGRAPHIC
Select Demographic
Female Poverty
Common Questions
What are the top races in the United States with the lowest poverty level among females?
The top races in the United States with the lowest poverty level among females are:
#1
Asians
11.9%
(99.1/100)
#2
Whites/Caucasians
13.4%
(54.6/100)
#3
Hawaiians
13.6%
(39.9/100)
What are the top ancestries in the United States with the lowest poverty level among females?
The top ancestries in the United States with the lowest poverty level among females are:
#1
Chinese
10.4%
(100.0/100)
#2
Thais
10.5%
(100.0/100)
#3
Filipinos
10.9%
(100.0/100)
#4
Assyrians/Chaldeans/Syriacs
11.0%
(99.9/100)
#5
Bulgarians
11.1%
(99.9/100)
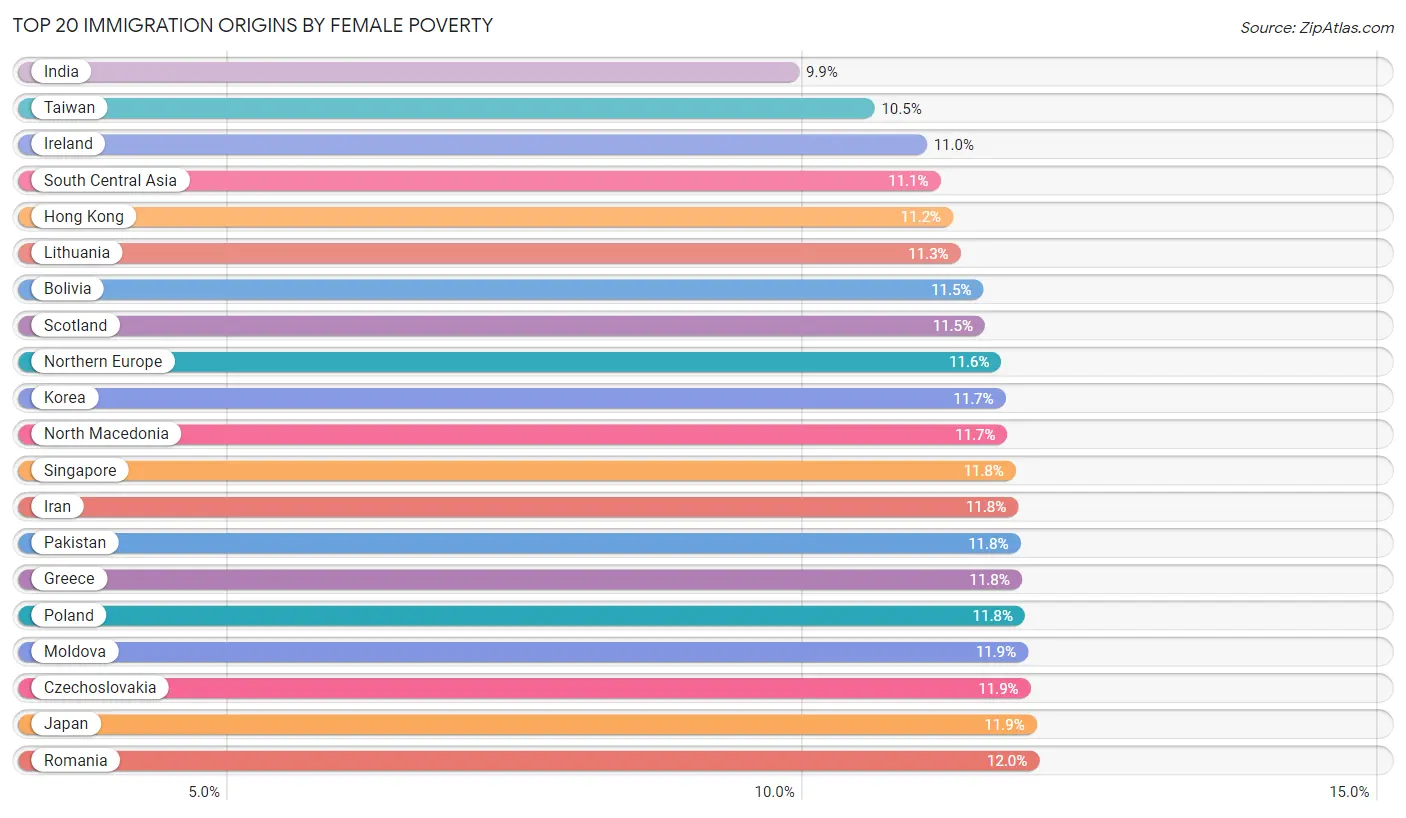
What are the top immigration origins in the United States with the lowest poverty level among females?
The top immigration origins in the United States with the lowest poverty level among females are:
#1
Immigrants from India
9.9%
(100.0/100)
#2
Immigrants from Taiwan
10.5%
(100.0/100)
#3
Immigrants from Ireland
11.0%
(99.9/100)
#4
Immigrants from South Central Asia
11.1%
(99.9/100)
#5
Immigrants from Hong Kong
11.2%
(99.9/100)
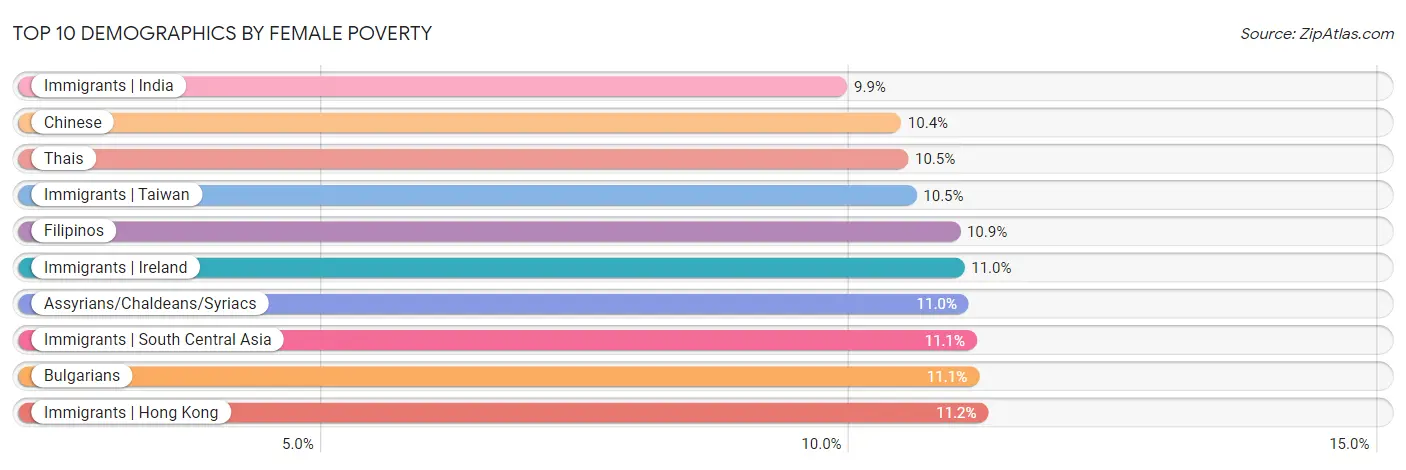
Top 10 Demographics by Female Poverty
The best off demographics with the lowest poverty level among females in the United States are Immigrants from India (9.9%, 100.0/100), Chinese (10.4%, 100.0/100), Thai (10.5%, 100.0/100), Immigrants from Taiwan (10.5%, 100.0/100), and Filipino (10.9%, 100.0/100).
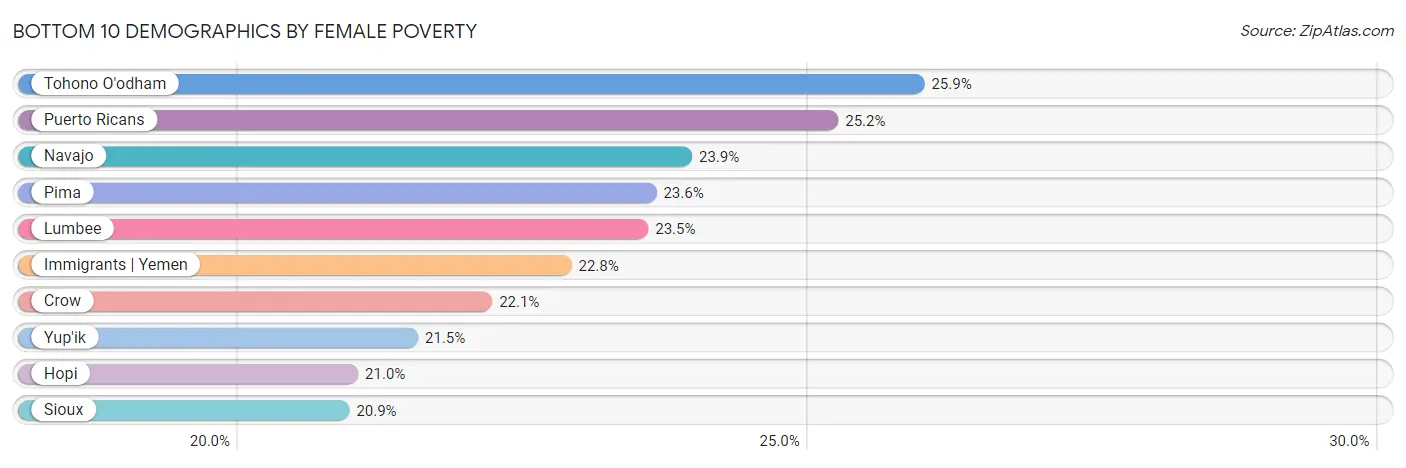
Bottom 10 Demographics by Female Poverty
The worst off demographics with the highest poverty level among females in the United States are Tohono O'odham (25.9%, 0.0/100), Puerto Rican (25.2%, 0.0/100), Navajo (23.9%, 0.0/100), Pima (23.6%, 0.0/100), and Lumbee (23.5%, 0.0/100).
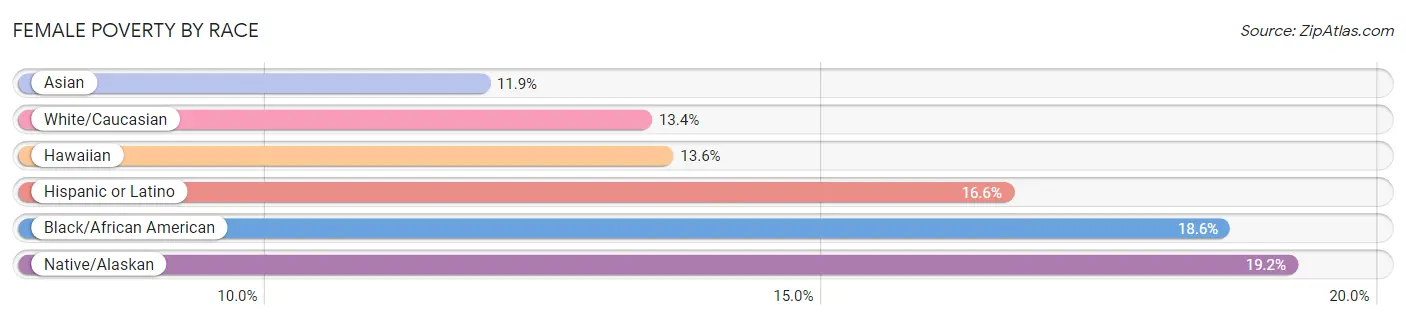
Female Poverty by Race
Top demographics by Female Poverty within the race category in the United States are Asians (11.9%, 99.1/100), Whites/Caucasians (13.4%, 54.6/100), and Hawaiians (13.6%, 39.9/100).
| Race | Rating | Rank | Female Poverty |
| Asian | 99.1 /100 | #47 | Exceptional 11.9% |
| Black/African American | 0.0 /100 | #328 | Tragic 18.6% |
| Hawaiian | 39.9 /100 | #188 | Fair 13.6% |
| Hispanic or Latino | 0.0 /100 | #299 | Tragic 16.6% |
| Native/Alaskan | 0.0 /100 | #331 | Tragic 19.2% |
| White/Caucasian | 54.6 /100 | #171 | Average 13.4% |
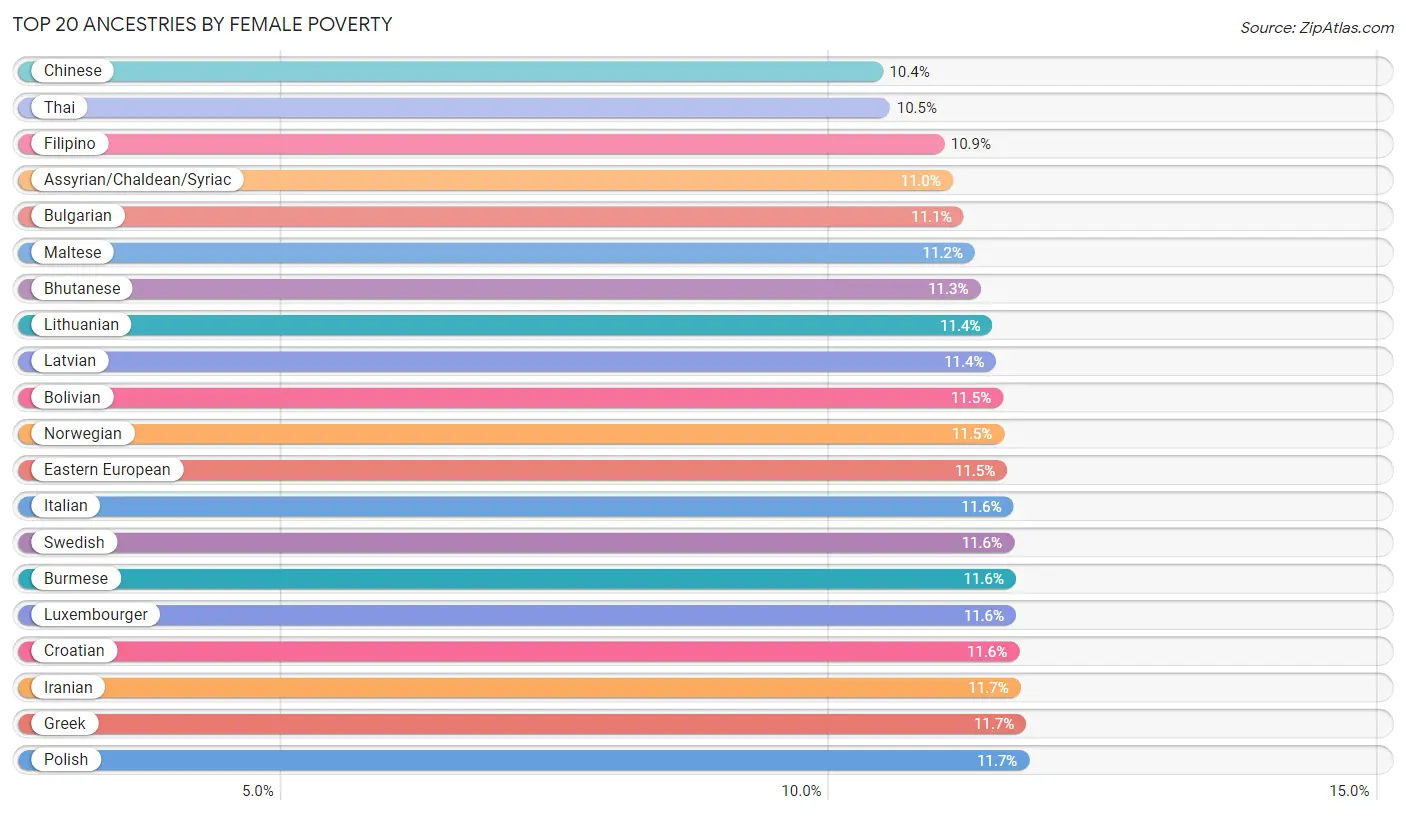
Female Poverty by Ancestry
Top 20 Ancestries by Female Poverty
Top demographics by Female Poverty within the ancestry category in the United States are Chinese (10.4%, 100.0/100), Thais (10.5%, 100.0/100), Filipinos (10.9%, 100.0/100), Assyrians/Chaldeans/Syriacs (11.0%, 99.9/100), and Bulgarians (11.1%, 99.9/100).
| Ancestry | Rating | Rank | Female Poverty |
| Afghan | 79.8 /100 | #144 | Good 13.0% |
| African | 0.0 /100 | #308 | Tragic 16.9% |
| Alaska Native | 1.8 /100 | #230 | Tragic 14.7% |
| Alaskan Athabascan | 5.3 /100 | #213 | Tragic 14.4% |
| Albanian | 90.8 /100 | #119 | Exceptional 12.7% |
| Aleut | 56.7 /100 | #168 | Average 13.4% |
| Alsatian | 4.0 /100 | #220 | Tragic 14.5% |
| American | 2.8 /100 | #224 | Tragic 14.6% |
| Apache | 0.0 /100 | #332 | Tragic 19.2% |
| Arab | 28.6 /100 | #197 | Fair 13.7% |
| Arapaho | 0.0 /100 | #321 | Tragic 17.5% |
| Argentinean | 89.1 /100 | #125 | Excellent 12.8% |
| Armenian | 70.4 /100 | #154 | Good 13.2% |
| Assyrian/Chaldean/Syriac | 99.9 /100 | #7 | Exceptional 11.0% |
| Australian | 95.2 /100 | #97 | Exceptional 12.5% |
| Austrian | 97.9 /100 | #66 | Exceptional 12.2% |
| Bahamian | 0.0 /100 | #300 | Tragic 16.6% |
| Bangladeshi | 0.0 /100 | #277 | Tragic 16.0% |
| Barbadian | 0.0 /100 | #274 | Tragic 15.9% |
| Basque | 83.1 /100 | #139 | Excellent 12.9% |
| Belgian | 95.8 /100 | #91 | Exceptional 12.4% |
| Belizean | 0.0 /100 | #272 | Tragic 15.9% |
| Bermudan | 5.5 /100 | #212 | Tragic 14.4% |
| Bhutanese | 99.9 /100 | #12 | Exceptional 11.3% |
| Blackfeet | 0.0 /100 | #289 | Tragic 16.4% |
| Bolivian | 99.8 /100 | #17 | Exceptional 11.5% |
| Brazilian | 80.5 /100 | #142 | Excellent 13.0% |
| British | 95.2 /100 | #96 | Exceptional 12.5% |
| British West Indian | 0.0 /100 | #313 | Tragic 17.0% |
| Bulgarian | 99.9 /100 | #9 | Exceptional 11.1% |
| Burmese | 99.7 /100 | #23 | Exceptional 11.6% |
| Cajun | 0.0 /100 | #319 | Tragic 17.5% |
| Cambodian | 97.5 /100 | #72 | Exceptional 12.2% |
| Canadian | 92.0 /100 | #113 | Exceptional 12.7% |
| Cape Verdean | 0.1 /100 | #259 | Tragic 15.6% |
| Carpatho Rusyn | 97.6 /100 | #71 | Exceptional 12.2% |
| Celtic | 49.9 /100 | #175 | Average 13.4% |
| Central American | 0.0 /100 | #276 | Tragic 16.0% |
| Central American Indian | 0.0 /100 | #326 | Tragic 18.0% |
| Cherokee | 0.1 /100 | #263 | Tragic 15.6% |
| Cheyenne | 0.0 /100 | #335 | Tragic 20.2% |
| Chickasaw | 0.1 /100 | #270 | Tragic 15.9% |
| Chilean | 84.7 /100 | #137 | Excellent 12.9% |
| Chinese | 100.0 /100 | #2 | Exceptional 10.4% |
| Chippewa | 0.0 /100 | #302 | Tragic 16.7% |
| Choctaw | 0.0 /100 | #303 | Tragic 16.8% |
| Colombian | 55.7 /100 | #170 | Average 13.4% |
| Colville | 0.0 /100 | #325 | Tragic 17.8% |
| Comanche | 0.0 /100 | #285 | Tragic 16.2% |
| Costa Rican | 63.6 /100 | #159 | Good 13.3% |
| Cree | 0.7 /100 | #236 | Tragic 15.1% |
| Creek | 0.0 /100 | #310 | Tragic 17.0% |
| Croatian | 99.6 /100 | #26 | Exceptional 11.6% |
| Crow | 0.0 /100 | #341 | Tragic 22.1% |
| Cuban | 0.3 /100 | #246 | Tragic 15.3% |
| Cypriot | 99.5 /100 | #33 | Exceptional 11.8% |
| Czech | 99.2 /100 | #41 | Exceptional 11.9% |
| Czechoslovakian | 95.7 /100 | #92 | Exceptional 12.4% |
| Danish | 99.5 /100 | #32 | Exceptional 11.7% |
| Delaware | 31.1 /100 | #194 | Fair 13.7% |
| Dominican | 0.0 /100 | #330 | Tragic 19.1% |
| Dutch | 96.5 /100 | #86 | Exceptional 12.4% |
| Dutch West Indian | 0.0 /100 | #314 | Tragic 17.1% |
| Eastern European | 99.7 /100 | #20 | Exceptional 11.5% |
| Ecuadorian | 0.3 /100 | #244 | Tragic 15.3% |
| Egyptian | 97.2 /100 | #78 | Exceptional 12.3% |
| English | 96.1 /100 | #89 | Exceptional 12.4% |
| Estonian | 98.3 /100 | #56 | Exceptional 12.1% |
| Ethiopian | 62.3 /100 | #164 | Good 13.3% |
| European | 97.4 /100 | #75 | Exceptional 12.3% |
| Fijian | 1.1 /100 | #234 | Tragic 14.9% |
| Filipino | 100.0 /100 | #5 | Exceptional 10.9% |
| Finnish | 96.4 /100 | #88 | Exceptional 12.4% |
| French | 85.6 /100 | #135 | Excellent 12.9% |
| French American Indian | 0.6 /100 | #237 | Tragic 15.1% |
| French Canadian | 90.2 /100 | #122 | Exceptional 12.7% |
| German | 98.0 /100 | #64 | Exceptional 12.2% |
| German Russian | 2.0 /100 | #228 | Tragic 14.7% |
| Ghanaian | 1.9 /100 | #229 | Tragic 14.7% |
| Greek | 99.5 /100 | #30 | Exceptional 11.7% |
| Guamanian/Chamorro | 62.4 /100 | #162 | Good 13.3% |
| Guatemalan | 0.0 /100 | #301 | Tragic 16.7% |
| Guyanese | 0.1 /100 | #261 | Tragic 15.6% |
| Haitian | 0.0 /100 | #273 | Tragic 15.9% |
| Hmong | 21.1 /100 | #202 | Fair 13.9% |
| Honduran | 0.0 /100 | #316 | Tragic 17.4% |
| Hopi | 0.0 /100 | #339 | Tragic 21.0% |
| Houma | 0.0 /100 | #334 | Tragic 20.0% |
| Hungarian | 70.1 /100 | #155 | Good 13.2% |
| Icelander | 81.1 /100 | #141 | Excellent 13.0% |
| Indian (Asian) | 97.9 /100 | #65 | Exceptional 12.2% |
| Indonesian | 0.0 /100 | #288 | Tragic 16.4% |
| Inupiat | 0.0 /100 | #286 | Tragic 16.2% |
| Iranian | 99.6 /100 | #27 | Exceptional 11.7% |
| Iraqi | 31.8 /100 | #193 | Fair 13.7% |
| Irish | 96.5 /100 | #85 | Exceptional 12.4% |
| Iroquois | 0.1 /100 | #269 | Tragic 15.8% |
| Israeli | 49.1 /100 | #178 | Average 13.5% |
| Italian | 99.7 /100 | #21 | Exceptional 11.6% |
| Jamaican | 0.2 /100 | #256 | Tragic 15.5% |
| Japanese | 4.1 /100 | #219 | Tragic 14.5% |
| Jordanian | 97.1 /100 | #82 | Exceptional 12.3% |
| Kenyan | 43.8 /100 | #183 | Average 13.5% |
| Kiowa | 0.0 /100 | #329 | Tragic 18.6% |
| Korean | 99.2 /100 | #43 | Exceptional 11.9% |
| Laotian | 93.4 /100 | #107 | Exceptional 12.6% |
| Latvian | 99.8 /100 | #15 | Exceptional 11.4% |
| Lebanese | 55.9 /100 | #169 | Average 13.4% |
| Liberian | 0.2 /100 | #253 | Tragic 15.4% |
| Lithuanian | 99.8 /100 | #14 | Exceptional 11.4% |
| Lumbee | 0.0 /100 | #343 | Tragic 23.5% |
| Luxembourger | 99.7 /100 | #24 | Exceptional 11.6% |
| Macedonian | 99.3 /100 | #40 | Exceptional 11.8% |
| Malaysian | 7.4 /100 | #210 | Tragic 14.3% |
| Maltese | 99.9 /100 | #11 | Exceptional 11.2% |
| Marshallese | 5.0 /100 | #214 | Tragic 14.4% |
| Menominee | 0.0 /100 | #322 | Tragic 17.6% |
| Mexican | 0.0 /100 | #297 | Tragic 16.5% |
| Mexican American Indian | 0.1 /100 | #262 | Tragic 15.6% |
| Mongolian | 53.6 /100 | #172 | Average 13.4% |
| Moroccan | 7.2 /100 | #211 | Tragic 14.3% |
| Native Hawaiian | 95.1 /100 | #98 | Exceptional 12.5% |
| Navajo | 0.0 /100 | #345 | Tragic 23.9% |
| Nepalese | 0.4 /100 | #242 | Tragic 15.2% |
| New Zealander | 90.6 /100 | #120 | Exceptional 12.7% |
| Nicaraguan | 0.3 /100 | #243 | Tragic 15.3% |
| Nigerian | 1.7 /100 | #231 | Tragic 14.8% |
| Northern European | 96.6 /100 | #84 | Exceptional 12.4% |
| Norwegian | 99.8 /100 | #19 | Exceptional 11.5% |
| Okinawan | 96.4 /100 | #87 | Exceptional 12.4% |
| Osage | 1.5 /100 | #232 | Tragic 14.8% |
| Ottawa | 0.2 /100 | #255 | Tragic 15.5% |
| Paiute | 0.0 /100 | #323 | Tragic 17.7% |
| Pakistani | 83.0 /100 | #140 | Excellent 12.9% |
| Palestinian | 94.3 /100 | #104 | Exceptional 12.5% |
| Panamanian | 7.7 /100 | #209 | Tragic 14.2% |
| Paraguayan | 93.0 /100 | #110 | Exceptional 12.6% |
| Pennsylvania German | 67.3 /100 | #158 | Good 13.2% |
| Peruvian | 85.2 /100 | #136 | Excellent 12.9% |
| Pima | 0.0 /100 | #344 | Tragic 23.6% |
| Polish | 99.5 /100 | #31 | Exceptional 11.7% |
| Portuguese | 93.1 /100 | #108 | Exceptional 12.6% |
| Potawatomi | 0.3 /100 | #247 | Tragic 15.3% |
| Pueblo | 0.0 /100 | #336 | Tragic 20.7% |
| Puerto Rican | 0.0 /100 | #346 | Tragic 25.2% |
| Puget Sound Salish | 91.5 /100 | #115 | Exceptional 12.7% |
| Romanian | 95.1 /100 | #99 | Exceptional 12.5% |
| Russian | 99.3 /100 | #38 | Exceptional 11.8% |
| Salvadoran | 0.3 /100 | #249 | Tragic 15.3% |
| Samoan | 73.6 /100 | #152 | Good 13.1% |
| Scandinavian | 98.2 /100 | #58 | Exceptional 12.1% |
| Scotch-Irish | 62.1 /100 | #165 | Good 13.3% |
| Scottish | 94.1 /100 | #105 | Exceptional 12.5% |
| Seminole | 0.0 /100 | #307 | Tragic 16.9% |
| Senegalese | 0.0 /100 | #295 | Tragic 16.5% |
| Serbian | 97.2 /100 | #77 | Exceptional 12.3% |
| Shoshone | 0.1 /100 | #258 | Tragic 15.6% |
| Sierra Leonean | 33.1 /100 | #190 | Fair 13.7% |
| Sioux | 0.0 /100 | #338 | Tragic 20.9% |
| Slavic | 94.5 /100 | #103 | Exceptional 12.5% |
| Slovak | 97.1 /100 | #80 | Exceptional 12.3% |
| Slovene | 98.9 /100 | #50 | Exceptional 12.0% |
| Somali | 0.0 /100 | #298 | Tragic 16.6% |
| South African | 88.4 /100 | #127 | Excellent 12.8% |
| South American | 44.8 /100 | #180 | Average 13.5% |
| South American Indian | 28.9 /100 | #196 | Fair 13.7% |
| Soviet Union | 92.4 /100 | #111 | Exceptional 12.6% |
| Spaniard | 18.9 /100 | #204 | Poor 13.9% |
| Spanish | 21.4 /100 | #200 | Fair 13.9% |
| Spanish American | 0.0 /100 | #284 | Tragic 16.2% |
| Spanish American Indian | 0.3 /100 | #245 | Tragic 15.3% |
| Sri Lankan | 90.9 /100 | #118 | Exceptional 12.7% |
| Subsaharan African | 0.1 /100 | #267 | Tragic 15.8% |
| Sudanese | 0.5 /100 | #240 | Tragic 15.2% |
| Swedish | 99.7 /100 | #22 | Exceptional 11.6% |
| Swiss | 97.7 /100 | #69 | Exceptional 12.2% |
| Syrian | 79.6 /100 | #145 | Good 13.0% |
| Taiwanese | 75.7 /100 | #149 | Good 13.1% |
| Thai | 100.0 /100 | #3 | Exceptional 10.5% |
| Tlingit-Haida | 94.8 /100 | #101 | Exceptional 12.5% |
| Tohono O'Odham | 0.0 /100 | #347 | Tragic 25.9% |
| Tongan | 99.2 /100 | #44 | Exceptional 11.9% |
| Trinidadian and Tobagonian | 0.2 /100 | #254 | Tragic 15.4% |
| Tsimshian | 75.5 /100 | #150 | Good 13.1% |
| Turkish | 99.2 /100 | #46 | Exceptional 11.9% |
| U.S. Virgin Islander | 0.0 /100 | #315 | Tragic 17.3% |
| Ugandan | 15.4 /100 | #205 | Poor 14.0% |
| Ukrainian | 98.0 /100 | #63 | Exceptional 12.2% |
| Uruguayan | 39.8 /100 | #189 | Fair 13.6% |
| Ute | 0.0 /100 | #318 | Tragic 17.5% |
| Venezuelan | 44.5 /100 | #181 | Average 13.5% |
| Vietnamese | 0.0 /100 | #280 | Tragic 16.1% |
| Welsh | 91.6 /100 | #114 | Exceptional 12.7% |
| West Indian | 0.0 /100 | #281 | Tragic 16.1% |
| Yakama | 0.0 /100 | #327 | Tragic 18.0% |
| Yaqui | 0.0 /100 | #291 | Tragic 16.4% |
| Yugoslavian | 76.9 /100 | #148 | Good 13.1% |
| Yuman | 0.0 /100 | #337 | Tragic 20.8% |
| Yup'ik | 0.0 /100 | #340 | Tragic 21.5% |
| Zimbabwean | 97.5 /100 | #73 | Exceptional 12.3% |
Female Poverty by Immigration
Top 20 Immigration Origins by Female Poverty
Top demographics by Female Poverty within the immigration category in the United States are Immigrants from India (9.9%, 100.0/100), Immigrants from Taiwan (10.5%, 100.0/100), Immigrants from Ireland (11.0%, 99.9/100), Immigrants from South Central Asia (11.1%, 99.9/100), and Immigrants from Hong Kong (11.2%, 99.9/100).
| Immigration | Rating | Rank | Female Poverty |
| Nonimmigrants | 3.7 /100 | #222 | Tragic 14.5% |
| Immigrants | 4.5 /100 | #217 | Tragic 14.4% |
| Afghanistan | 50.8 /100 | #173 | Average 13.4% |
| Africa | 3.3 /100 | #223 | Tragic 14.5% |
| Albania | 62.4 /100 | #163 | Good 13.3% |
| Argentina | 87.0 /100 | #131 | Excellent 12.8% |
| Armenia | 0.6 /100 | #238 | Tragic 15.1% |
| Asia | 98.1 /100 | #61 | Exceptional 12.2% |
| Australia | 98.1 /100 | #60 | Exceptional 12.2% |
| Austria | 98.7 /100 | #53 | Exceptional 12.0% |
| Bahamas | 0.0 /100 | #279 | Tragic 16.1% |
| Bangladesh | 0.0 /100 | #290 | Tragic 16.4% |
| Barbados | 0.0 /100 | #275 | Tragic 16.0% |
| Belarus | 88.2 /100 | #128 | Excellent 12.8% |
| Belgium | 97.7 /100 | #70 | Exceptional 12.2% |
| Belize | 0.0 /100 | #287 | Tragic 16.3% |
| Bolivia | 99.8 /100 | #16 | Exceptional 11.5% |
| Bosnia and Herzegovina | 69.7 /100 | #156 | Good 13.2% |
| Brazil | 87.9 /100 | #129 | Excellent 12.8% |
| Bulgaria | 98.9 /100 | #51 | Exceptional 12.0% |
| Burma/Myanmar | 0.3 /100 | #252 | Tragic 15.4% |
| Cabo Verde | 0.0 /100 | #294 | Tragic 16.4% |
| Cambodia | 3.7 /100 | #221 | Tragic 14.5% |
| Cameroon | 42.0 /100 | #185 | Average 13.5% |
| Canada | 97.5 /100 | #74 | Exceptional 12.3% |
| Caribbean | 0.0 /100 | #306 | Tragic 16.9% |
| Central America | 0.0 /100 | #304 | Tragic 16.8% |
| Chile | 57.4 /100 | #167 | Average 13.3% |
| China | 94.5 /100 | #102 | Exceptional 12.5% |
| Colombia | 44.5 /100 | #182 | Average 13.5% |
| Congo | 0.0 /100 | #317 | Tragic 17.4% |
| Costa Rica | 31.9 /100 | #192 | Fair 13.7% |
| Croatia | 98.7 /100 | #52 | Exceptional 12.0% |
| Cuba | 0.0 /100 | #283 | Tragic 16.1% |
| Czechoslovakia | 99.2 /100 | #45 | Exceptional 11.9% |
| Denmark | 95.8 /100 | #90 | Exceptional 12.4% |
| Dominica | 0.0 /100 | #320 | Tragic 17.5% |
| Dominican Republic | 0.0 /100 | #333 | Tragic 19.3% |
| Eastern Africa | 9.0 /100 | #207 | Tragic 14.2% |
| Eastern Asia | 97.8 /100 | #67 | Exceptional 12.2% |
| Eastern Europe | 97.2 /100 | #76 | Exceptional 12.3% |
| Ecuador | 0.1 /100 | #264 | Tragic 15.6% |
| Egypt | 95.5 /100 | #93 | Exceptional 12.5% |
| El Salvador | 0.1 /100 | #266 | Tragic 15.7% |
| England | 96.9 /100 | #83 | Exceptional 12.3% |
| Eritrea | 2.4 /100 | #226 | Tragic 14.6% |
| Ethiopia | 62.5 /100 | #161 | Good 13.3% |
| Europe | 98.2 /100 | #59 | Exceptional 12.1% |
| Fiji | 71.0 /100 | #153 | Good 13.2% |
| France | 83.6 /100 | #138 | Excellent 12.9% |
| Germany | 74.9 /100 | #151 | Good 13.1% |
| Ghana | 0.3 /100 | #248 | Tragic 15.3% |
| Greece | 99.3 /100 | #37 | Exceptional 11.8% |
| Grenada | 0.0 /100 | #305 | Tragic 16.8% |
| Guatemala | 0.0 /100 | #311 | Tragic 17.0% |
| Guyana | 0.1 /100 | #260 | Tragic 15.6% |
| Haiti | 0.0 /100 | #282 | Tragic 16.1% |
| Honduras | 0.0 /100 | #324 | Tragic 17.7% |
| Hong Kong | 99.9 /100 | #10 | Exceptional 11.2% |
| Hungary | 90.3 /100 | #121 | Exceptional 12.7% |
| India | 100.0 /100 | #1 | Exceptional 9.9% |
| Indonesia | 95.4 /100 | #94 | Exceptional 12.5% |
| Iran | 99.4 /100 | #35 | Exceptional 11.8% |
| Iraq | 50.0 /100 | #174 | Average 13.4% |
| Ireland | 99.9 /100 | #6 | Exceptional 11.0% |
| Israel | 92.0 /100 | #112 | Exceptional 12.6% |
| Italy | 98.0 /100 | #62 | Exceptional 12.2% |
| Jamaica | 0.1 /100 | #257 | Tragic 15.6% |
| Japan | 99.0 /100 | #48 | Exceptional 11.9% |
| Jordan | 86.9 /100 | #132 | Excellent 12.8% |
| Kazakhstan | 78.6 /100 | #147 | Good 13.0% |
| Kenya | 21.1 /100 | #201 | Fair 13.9% |
| Korea | 99.6 /100 | #28 | Exceptional 11.7% |
| Kuwait | 32.7 /100 | #191 | Fair 13.7% |
| Laos | 0.9 /100 | #235 | Tragic 15.0% |
| Latin America | 0.0 /100 | #293 | Tragic 16.4% |
| Latvia | 94.8 /100 | #100 | Exceptional 12.5% |
| Lebanon | 25.6 /100 | #199 | Fair 13.8% |
| Liberia | 0.1 /100 | #265 | Tragic 15.7% |
| Lithuania | 99.9 /100 | #13 | Exceptional 11.3% |
| Malaysia | 80.4 /100 | #143 | Excellent 13.0% |
| Mexico | 0.0 /100 | #309 | Tragic 17.0% |
| Micronesia | 2.8 /100 | #225 | Tragic 14.6% |
| Middle Africa | 0.5 /100 | #239 | Tragic 15.2% |
| Moldova | 99.2 /100 | #42 | Exceptional 11.9% |
| Morocco | 49.4 /100 | #177 | Average 13.4% |
| Nepal | 62.7 /100 | #160 | Good 13.3% |
| Netherlands | 97.8 /100 | #68 | Exceptional 12.2% |
| Nicaragua | 0.1 /100 | #268 | Tragic 15.8% |
| Nigeria | 2.1 /100 | #227 | Tragic 14.7% |
| North America | 97.1 /100 | #79 | Exceptional 12.3% |
| North Macedonia | 99.6 /100 | #29 | Exceptional 11.7% |
| Northern Africa | 68.8 /100 | #157 | Good 13.2% |
| Northern Europe | 99.6 /100 | #25 | Exceptional 11.6% |
| Norway | 89.3 /100 | #124 | Excellent 12.8% |
| Oceania | 59.7 /100 | #166 | Average 13.3% |
| Pakistan | 99.4 /100 | #36 | Exceptional 11.8% |
| Panama | 4.7 /100 | #215 | Tragic 14.4% |
| Peru | 79.1 /100 | #146 | Good 13.0% |
| Philippines | 98.7 /100 | #54 | Exceptional 12.1% |
| Poland | 99.3 /100 | #39 | Exceptional 11.8% |
| Portugal | 41.5 /100 | #186 | Average 13.6% |
| Romania | 99.0 /100 | #49 | Exceptional 12.0% |
| Russia | 91.2 /100 | #116 | Exceptional 12.7% |
| Saudi Arabia | 1.4 /100 | #233 | Tragic 14.8% |
| Scotland | 99.8 /100 | #18 | Exceptional 11.5% |
| Senegal | 0.0 /100 | #296 | Tragic 16.5% |
| Serbia | 98.3 /100 | #57 | Exceptional 12.1% |
| Sierra Leone | 43.2 /100 | #184 | Average 13.5% |
| Singapore | 99.4 /100 | #34 | Exceptional 11.8% |
| Somalia | 0.0 /100 | #312 | Tragic 17.0% |
| South Africa | 95.4 /100 | #95 | Exceptional 12.5% |
| South America | 30.6 /100 | #195 | Fair 13.7% |
| South Central Asia | 99.9 /100 | #8 | Exceptional 11.1% |
| South Eastern Asia | 89.9 /100 | #123 | Excellent 12.7% |
| Southern Europe | 90.9 /100 | #117 | Exceptional 12.7% |
| Spain | 49.9 /100 | #176 | Average 13.4% |
| Sri Lanka | 98.5 /100 | #55 | Exceptional 12.1% |
| St. Vincent and the Grenadines | 0.0 /100 | #271 | Tragic 15.9% |
| Sudan | 0.4 /100 | #241 | Tragic 15.2% |
| Sweden | 97.1 /100 | #81 | Exceptional 12.3% |
| Switzerland | 85.8 /100 | #134 | Excellent 12.9% |
| Syria | 48.8 /100 | #179 | Average 13.5% |
| Taiwan | 100.0 /100 | #4 | Exceptional 10.5% |
| Thailand | 4.5 /100 | #216 | Tragic 14.4% |
| Trinidad and Tobago | 0.3 /100 | #251 | Tragic 15.4% |
| Turkey | 93.8 /100 | #106 | Exceptional 12.6% |
| Uganda | 28.5 /100 | #198 | Fair 13.7% |
| Ukraine | 88.8 /100 | #126 | Excellent 12.8% |
| Uruguay | 14.0 /100 | #206 | Poor 14.0% |
| Uzbekistan | 4.4 /100 | #218 | Tragic 14.4% |
| Venezuela | 41.0 /100 | #187 | Average 13.6% |
| Vietnam | 87.1 /100 | #130 | Excellent 12.8% |
| West Indies | 0.0 /100 | #278 | Tragic 16.1% |
| Western Africa | 0.3 /100 | #250 | Tragic 15.3% |
| Western Asia | 20.7 /100 | #203 | Fair 13.9% |
| Western Europe | 86.6 /100 | #133 | Excellent 12.8% |
| Yemen | 0.0 /100 | #342 | Tragic 22.8% |
| Zaire | 0.0 /100 | #292 | Tragic 16.4% |
| Zimbabwe | 93.1 /100 | #109 | Exceptional 12.6% |
| Azores | 7.9 /100 | #208 | Tragic 14.2% |