Liberian Disability Age 5 to 17
COMPARE
Liberian
Select to Compare
Disability Age 5 to 17
Liberian Disability Age 5 to 17
6.0%
DISABILITY | AGE 5 TO 17
0.4/ 100
METRIC RATING
269th/ 347
METRIC RANK
Liberian Disability Age 5 to 17 Correlation Chart
The statistical analysis conducted on geographies consisting of 117,862,309 people shows a poor negative correlation between the proportion of Liberians and percentage of population with a disability between the ages 5 and 17 in the United States with a correlation coefficient (R) of -0.117 and weighted average of 6.0%. On average, for every 1% (one percent) increase in Liberians within a typical geography, there is a decrease of 0.11% in percentage of population with a disability between the ages 5 and 17.
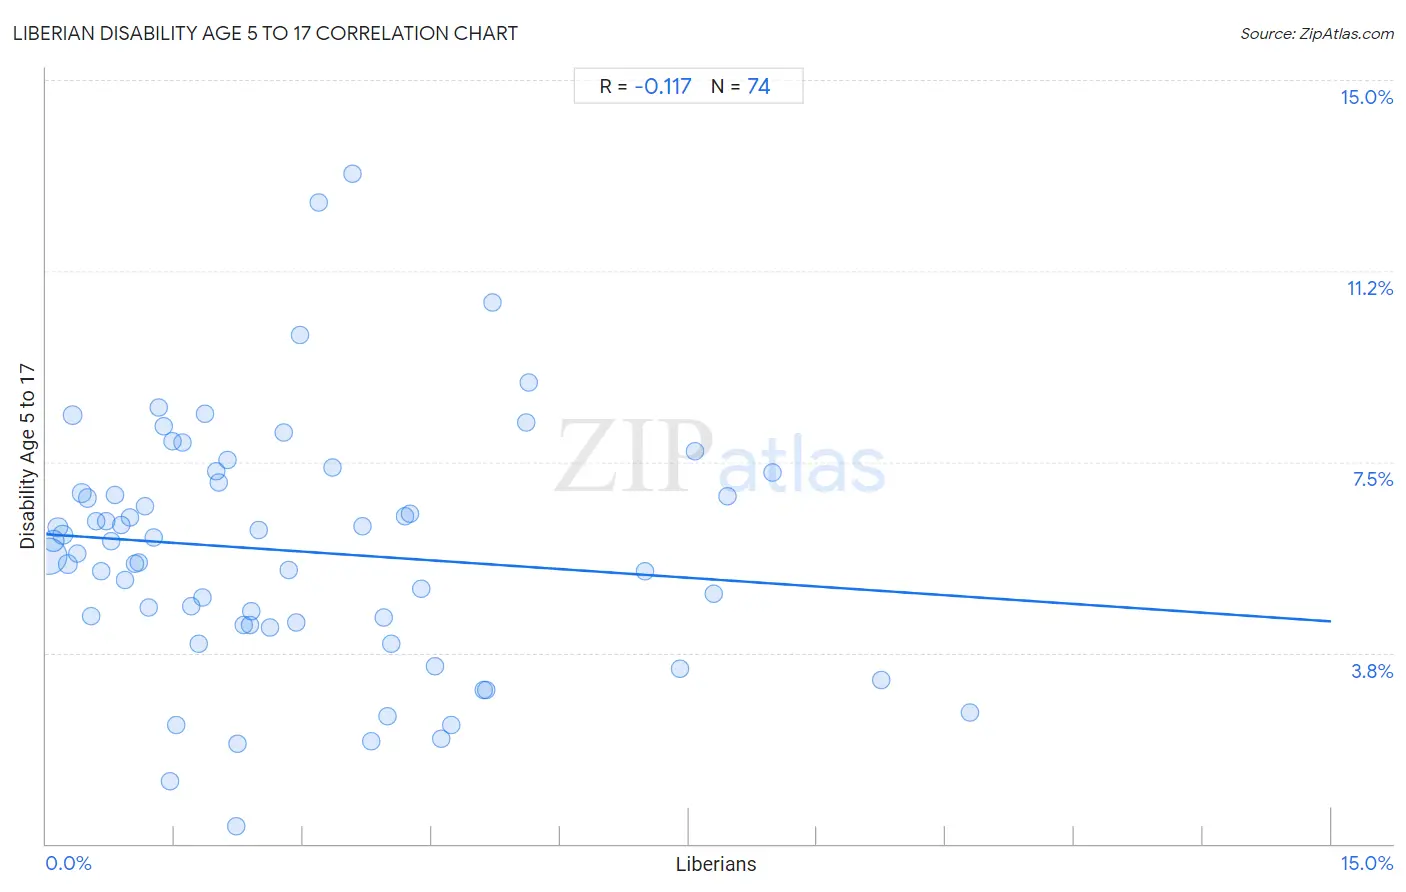
It is essential to understand that the correlation between the percentage of Liberians and percentage of population with a disability between the ages 5 and 17 does not imply a direct cause-and-effect relationship. It remains uncertain whether the presence of Liberians influences an upward or downward trend in the level of percentage of population with a disability between the ages 5 and 17 within an area, or if Liberians simply ended up residing in those areas with higher or lower levels of percentage of population with a disability between the ages 5 and 17 due to other factors.
Demographics Similar to Liberians by Disability Age 5 to 17
In terms of disability age 5 to 17, the demographic groups most similar to Liberians are Sioux (6.0%, a difference of 0.030%), Immigrants from Somalia (6.0%, a difference of 0.19%), Spanish (6.0%, a difference of 0.22%), Slovene (6.0%, a difference of 0.33%), and Panamanian (6.0%, a difference of 0.36%).
| Demographics | Rating | Rank | Disability Age 5 to 17 |
| Immigrants from Western Africa | 0.7 /100 | #262 | Tragic 5.9% |
| Czechoslovakians | 0.7 /100 | #263 | Tragic 5.9% |
| Canadians | 0.6 /100 | #264 | Tragic 6.0% |
| Panamanians | 0.6 /100 | #265 | Tragic 6.0% |
| Slovenes | 0.6 /100 | #266 | Tragic 6.0% |
| Spanish | 0.5 /100 | #267 | Tragic 6.0% |
| Sioux | 0.4 /100 | #268 | Tragic 6.0% |
| Liberians | 0.4 /100 | #269 | Tragic 6.0% |
| Immigrants from Somalia | 0.4 /100 | #270 | Tragic 6.0% |
| Immigrants from Zaire | 0.2 /100 | #271 | Tragic 6.0% |
| Finns | 0.2 /100 | #272 | Tragic 6.0% |
| Alaska Natives | 0.2 /100 | #273 | Tragic 6.0% |
| Cheyenne | 0.2 /100 | #274 | Tragic 6.0% |
| Dutch | 0.2 /100 | #275 | Tragic 6.0% |
| Japanese | 0.1 /100 | #276 | Tragic 6.1% |
Liberian Disability Age 5 to 17 Correlation Summary
| Measurement | Liberian Data | Disability Age 5 to 17 Data |
| Minimum | 0.025% | 0.34% |
| Maximum | 10.8% | 13.2% |
| Range | 10.8% | 12.8% |
| Mean | 2.9% | 5.7% |
| Median | 2.2% | 5.8% |
| Interquartile 25% (IQ1) | 1.0% | 4.3% |
| Interquartile 75% (IQ3) | 4.2% | 7.1% |
| Interquartile Range (IQR) | 3.1% | 2.8% |
| Standard Deviation (Sample) | 2.5% | 2.4% |
| Standard Deviation (Population) | 2.4% | 2.4% |
Correlation Details
| Liberian Percentile | Sample Size | Disability Age 5 to 17 |
[ 0.0% - 0.5% ] 0.025% | 72,203,857 | 5.7% |
[ 0.0% - 0.5% ] 0.083% | 16,898,478 | 5.9% |
[ 0.0% - 0.5% ] 0.14% | 6,809,279 | 6.2% |
[ 0.0% - 0.5% ] 0.19% | 6,932,153 | 6.1% |
[ 0.0% - 0.5% ] 0.25% | 2,158,121 | 5.5% |
[ 0.0% - 0.5% ] 0.31% | 3,795,237 | 8.4% |
[ 0.0% - 0.5% ] 0.36% | 1,400,871 | 5.7% |
[ 0.0% - 0.5% ] 0.42% | 783,098 | 6.9% |
[ 0.0% - 0.5% ] 0.48% | 773,107 | 6.8% |
[ 0.5% - 1.0% ] 0.52% | 690,487 | 4.5% |
[ 0.5% - 1.0% ] 0.59% | 592,311 | 6.3% |
[ 0.5% - 1.0% ] 0.64% | 397,435 | 5.3% |
[ 0.5% - 1.0% ] 0.69% | 407,033 | 6.3% |
[ 0.5% - 1.0% ] 0.75% | 414,838 | 5.9% |
[ 0.5% - 1.0% ] 0.81% | 283,163 | 6.8% |
[ 0.5% - 1.0% ] 0.87% | 218,525 | 6.3% |
[ 0.5% - 1.0% ] 0.93% | 195,026 | 5.2% |
[ 0.5% - 1.0% ] 0.97% | 336,439 | 6.4% |
[ 1.0% - 1.5% ] 1.03% | 136,067 | 5.5% |
[ 1.0% - 1.5% ] 1.08% | 108,683 | 5.5% |
[ 1.0% - 1.5% ] 1.15% | 251,502 | 6.6% |
[ 1.0% - 1.5% ] 1.20% | 105,604 | 4.6% |
[ 1.0% - 1.5% ] 1.25% | 268,406 | 6.0% |
[ 1.0% - 1.5% ] 1.32% | 55,474 | 8.6% |
[ 1.0% - 1.5% ] 1.37% | 61,724 | 8.2% |
[ 1.0% - 1.5% ] 1.44% | 6,812 | 1.2% |
[ 1.0% - 1.5% ] 1.47% | 151,610 | 7.9% |
[ 1.5% - 2.0% ] 1.51% | 66,828 | 2.3% |
[ 1.5% - 2.0% ] 1.59% | 5,647 | 7.9% |
[ 1.5% - 2.0% ] 1.69% | 202,789 | 4.7% |
[ 1.5% - 2.0% ] 1.78% | 2,759 | 3.9% |
[ 1.5% - 2.0% ] 1.82% | 97,674 | 4.8% |
[ 1.5% - 2.0% ] 1.86% | 7,003 | 8.5% |
[ 1.5% - 2.0% ] 1.99% | 3,978 | 7.3% |
[ 2.0% - 2.5% ] 2.02% | 127,319 | 7.1% |
[ 2.0% - 2.5% ] 2.11% | 3,264 | 7.5% |
[ 2.0% - 2.5% ] 2.21% | 8,762 | 0.34% |
[ 2.0% - 2.5% ] 2.24% | 24,437 | 2.0% |
[ 2.0% - 2.5% ] 2.30% | 35,606 | 4.3% |
[ 2.0% - 2.5% ] 2.37% | 66,702 | 4.3% |
[ 2.0% - 2.5% ] 2.40% | 14,960 | 4.6% |
[ 2.0% - 2.5% ] 2.48% | 12,799 | 6.2% |
[ 2.5% - 3.0% ] 2.61% | 54,042 | 4.2% |
[ 2.5% - 3.0% ] 2.77% | 24,283 | 8.1% |
[ 2.5% - 3.0% ] 2.83% | 12,388 | 5.4% |
[ 2.5% - 3.0% ] 2.92% | 67,773 | 4.3% |
[ 2.5% - 3.0% ] 2.96% | 4,523 | 10.0% |
[ 3.0% - 3.5% ] 3.17% | 39,099 | 12.6% |
[ 3.0% - 3.5% ] 3.34% | 31,812 | 7.4% |
[ 3.5% - 4.0% ] 3.57% | 12,277 | 13.2% |
[ 3.5% - 4.0% ] 3.69% | 34,414 | 6.2% |
[ 3.5% - 4.0% ] 3.79% | 9,507 | 2.0% |
[ 3.5% - 4.0% ] 3.94% | 1,751 | 4.4% |
[ 3.5% - 4.0% ] 3.98% | 12,860 | 2.5% |
[ 4.0% - 4.5% ] 4.03% | 36,213 | 3.9% |
[ 4.0% - 4.5% ] 4.18% | 5,976 | 6.4% |
[ 4.0% - 4.5% ] 4.24% | 8,630 | 6.5% |
[ 4.0% - 4.5% ] 4.37% | 48,577 | 5.0% |
[ 4.5% - 5.0% ] 4.54% | 84,951 | 3.5% |
[ 4.5% - 5.0% ] 4.61% | 8,244 | 2.1% |
[ 4.5% - 5.0% ] 4.73% | 7,617 | 2.3% |
[ 5.0% - 5.5% ] 5.11% | 23,967 | 3.0% |
[ 5.0% - 5.5% ] 5.13% | 23,856 | 3.0% |
[ 5.0% - 5.5% ] 5.20% | 1,730 | 10.6% |
[ 5.5% - 6.0% ] 5.60% | 22,493 | 8.3% |
[ 5.5% - 6.0% ] 5.63% | 21,620 | 9.1% |
[ 6.5% - 7.0% ] 6.98% | 2,849 | 5.4% |
[ 7.0% - 7.5% ] 7.39% | 4,762 | 3.4% |
[ 7.5% - 8.0% ] 7.57% | 31,018 | 7.7% |
[ 7.5% - 8.0% ] 7.79% | 33,109 | 4.9% |
[ 7.5% - 8.0% ] 7.96% | 32,967 | 6.8% |
[ 8.0% - 8.5% ] 8.47% | 10,682 | 7.3% |
[ 9.5% - 10.0% ] 9.75% | 28,392 | 3.2% |
[ 10.5% - 11.0% ] 10.79% | 4,060 | 2.6% |