Immigrants from Hong Kong Disability Age 5 to 17
COMPARE
Immigrants from Hong Kong
Select to Compare
Disability Age 5 to 17
Immigrants from Hong Kong Disability Age 5 to 17
4.3%
DISABILITY | AGE 5 TO 17
100.0/ 100
METRIC RATING
3rd/ 347
METRIC RANK
Immigrants from Hong Kong Disability Age 5 to 17 Correlation Chart
The statistical analysis conducted on geographies consisting of 252,525,907 people shows a poor negative correlation between the proportion of Immigrants from Hong Kong and percentage of population with a disability between the ages 5 and 17 in the United States with a correlation coefficient (R) of -0.167 and weighted average of 4.3%. On average, for every 1% (one percent) increase in Immigrants from Hong Kong within a typical geography, there is a decrease of 0.20% in percentage of population with a disability between the ages 5 and 17.
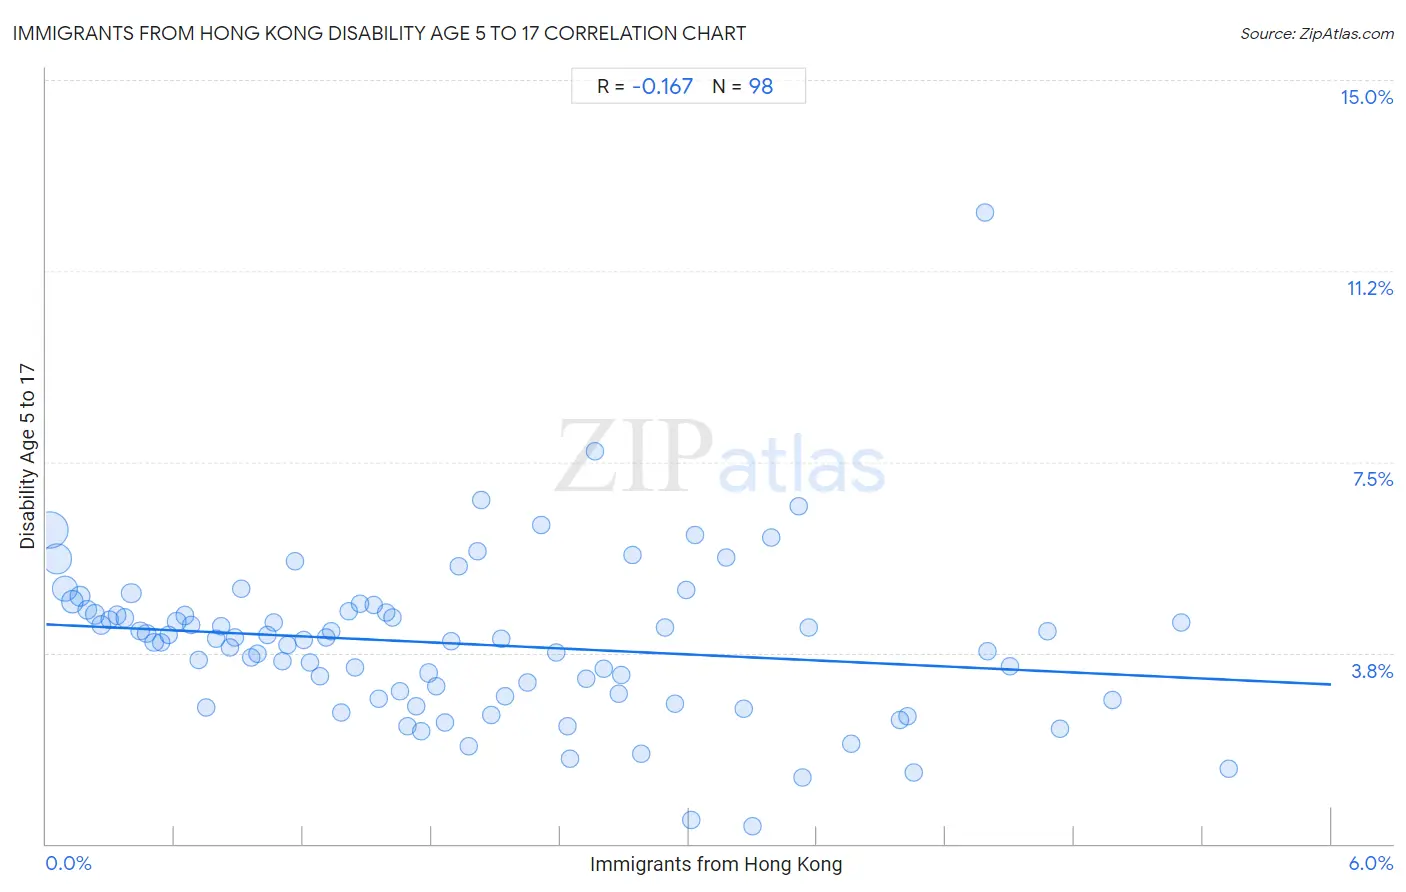
It is essential to understand that the correlation between the percentage of Immigrants from Hong Kong and percentage of population with a disability between the ages 5 and 17 does not imply a direct cause-and-effect relationship. It remains uncertain whether the presence of Immigrants from Hong Kong influences an upward or downward trend in the level of percentage of population with a disability between the ages 5 and 17 within an area, or if Immigrants from Hong Kong simply ended up residing in those areas with higher or lower levels of percentage of population with a disability between the ages 5 and 17 due to other factors.
Demographics Similar to Immigrants from Hong Kong by Disability Age 5 to 17
In terms of disability age 5 to 17, the demographic groups most similar to Immigrants from Hong Kong are Filipino (4.3%, a difference of 1.0%), Immigrants from Iran (4.4%, a difference of 1.5%), Immigrants from Taiwan (4.2%, a difference of 2.5%), Immigrants from Israel (4.5%, a difference of 5.0%), and Immigrants from China (4.5%, a difference of 5.3%).
| Demographics | Rating | Rank | Disability Age 5 to 17 |
| Immigrants from Armenia | 100.0 /100 | #1 | Exceptional 4.1% |
| Immigrants from Taiwan | 100.0 /100 | #2 | Exceptional 4.2% |
| Immigrants from Hong Kong | 100.0 /100 | #3 | Exceptional 4.3% |
| Filipinos | 100.0 /100 | #4 | Exceptional 4.3% |
| Immigrants from Iran | 100.0 /100 | #5 | Exceptional 4.4% |
| Immigrants from Israel | 100.0 /100 | #6 | Exceptional 4.5% |
| Immigrants from China | 100.0 /100 | #7 | Exceptional 4.5% |
| Indians (Asian) | 100.0 /100 | #8 | Exceptional 4.6% |
| Immigrants from Eastern Asia | 100.0 /100 | #9 | Exceptional 4.6% |
| Immigrants from India | 100.0 /100 | #10 | Exceptional 4.6% |
| Armenians | 100.0 /100 | #11 | Exceptional 4.6% |
| Iranians | 100.0 /100 | #12 | Exceptional 4.6% |
| Thais | 100.0 /100 | #13 | Exceptional 4.7% |
| Immigrants from Korea | 100.0 /100 | #14 | Exceptional 4.7% |
| Chinese | 100.0 /100 | #15 | Exceptional 4.7% |
Immigrants from Hong Kong Disability Age 5 to 17 Correlation Summary
| Measurement | Immigrants from Hong Kong Data | Disability Age 5 to 17 Data |
| Minimum | 0.018% | 0.35% |
| Maximum | 5.5% | 12.4% |
| Range | 5.5% | 12.0% |
| Mean | 1.9% | 3.9% |
| Median | 1.7% | 4.0% |
| Interquartile 25% (IQ1) | 0.86% | 2.9% |
| Interquartile 75% (IQ3) | 2.8% | 4.5% |
| Interquartile Range (IQR) | 1.9% | 1.6% |
| Standard Deviation (Sample) | 1.4% | 1.6% |
| Standard Deviation (Population) | 1.3% | 1.6% |
Correlation Details
| Immigrants from Hong Kong Percentile | Sample Size | Disability Age 5 to 17 |
[ 0.0% - 0.5% ] 0.018% | 79,877,263 | 6.2% |
[ 0.0% - 0.5% ] 0.051% | 52,184,367 | 5.6% |
[ 0.0% - 0.5% ] 0.088% | 32,620,756 | 5.0% |
[ 0.0% - 0.5% ] 0.12% | 17,232,704 | 4.8% |
[ 0.0% - 0.5% ] 0.16% | 10,458,813 | 4.9% |
[ 0.0% - 0.5% ] 0.19% | 7,196,105 | 4.6% |
[ 0.0% - 0.5% ] 0.23% | 5,958,624 | 4.5% |
[ 0.0% - 0.5% ] 0.26% | 5,126,159 | 4.3% |
[ 0.0% - 0.5% ] 0.30% | 2,913,662 | 4.4% |
[ 0.0% - 0.5% ] 0.33% | 3,580,946 | 4.5% |
[ 0.0% - 0.5% ] 0.37% | 1,919,470 | 4.4% |
[ 0.0% - 0.5% ] 0.40% | 10,392,981 | 4.9% |
[ 0.0% - 0.5% ] 0.44% | 3,005,662 | 4.2% |
[ 0.0% - 0.5% ] 0.47% | 2,141,101 | 4.1% |
[ 0.5% - 1.0% ] 0.50% | 1,324,348 | 4.0% |
[ 0.5% - 1.0% ] 0.54% | 896,787 | 4.0% |
[ 0.5% - 1.0% ] 0.57% | 949,561 | 4.1% |
[ 0.5% - 1.0% ] 0.61% | 1,196,473 | 4.4% |
[ 0.5% - 1.0% ] 0.65% | 1,054,807 | 4.5% |
[ 0.5% - 1.0% ] 0.68% | 741,865 | 4.3% |
[ 0.5% - 1.0% ] 0.71% | 582,483 | 3.6% |
[ 0.5% - 1.0% ] 0.75% | 267,063 | 2.7% |
[ 0.5% - 1.0% ] 0.79% | 740,407 | 4.0% |
[ 0.5% - 1.0% ] 0.82% | 462,446 | 4.3% |
[ 0.5% - 1.0% ] 0.86% | 428,150 | 3.8% |
[ 0.5% - 1.0% ] 0.88% | 363,182 | 4.1% |
[ 0.5% - 1.0% ] 0.91% | 146,899 | 5.0% |
[ 0.5% - 1.0% ] 0.96% | 250,027 | 3.7% |
[ 0.5% - 1.0% ] 0.99% | 298,492 | 3.7% |
[ 1.0% - 1.5% ] 1.03% | 403,526 | 4.1% |
[ 1.0% - 1.5% ] 1.06% | 203,539 | 4.4% |
[ 1.0% - 1.5% ] 1.10% | 590,088 | 3.6% |
[ 1.0% - 1.5% ] 1.12% | 114,598 | 3.9% |
[ 1.0% - 1.5% ] 1.16% | 264,936 | 5.6% |
[ 1.0% - 1.5% ] 1.20% | 305,254 | 4.0% |
[ 1.0% - 1.5% ] 1.23% | 292,806 | 3.6% |
[ 1.0% - 1.5% ] 1.28% | 455,405 | 3.3% |
[ 1.0% - 1.5% ] 1.31% | 111,609 | 4.0% |
[ 1.0% - 1.5% ] 1.33% | 122,199 | 4.2% |
[ 1.0% - 1.5% ] 1.38% | 204,009 | 2.6% |
[ 1.0% - 1.5% ] 1.41% | 213,769 | 4.6% |
[ 1.0% - 1.5% ] 1.44% | 165,074 | 3.5% |
[ 1.0% - 1.5% ] 1.47% | 89,020 | 4.7% |
[ 1.5% - 2.0% ] 1.53% | 180,375 | 4.7% |
[ 1.5% - 2.0% ] 1.55% | 194,808 | 2.8% |
[ 1.5% - 2.0% ] 1.59% | 104,589 | 4.5% |
[ 1.5% - 2.0% ] 1.62% | 103,875 | 4.5% |
[ 1.5% - 2.0% ] 1.65% | 140,073 | 3.0% |
[ 1.5% - 2.0% ] 1.69% | 212,390 | 2.3% |
[ 1.5% - 2.0% ] 1.73% | 69,708 | 2.7% |
[ 1.5% - 2.0% ] 1.75% | 198,364 | 2.2% |
[ 1.5% - 2.0% ] 1.79% | 938,332 | 3.4% |
[ 1.5% - 2.0% ] 1.82% | 132,977 | 3.1% |
[ 1.5% - 2.0% ] 1.86% | 193,107 | 2.4% |
[ 1.5% - 2.0% ] 1.89% | 198,986 | 4.0% |
[ 1.5% - 2.0% ] 1.93% | 58,705 | 5.4% |
[ 1.5% - 2.0% ] 1.97% | 6,238 | 1.9% |
[ 2.0% - 2.5% ] 2.01% | 61,312 | 5.7% |
[ 2.0% - 2.5% ] 2.03% | 4,336 | 6.8% |
[ 2.0% - 2.5% ] 2.08% | 67,785 | 2.5% |
[ 2.0% - 2.5% ] 2.12% | 70,245 | 4.0% |
[ 2.0% - 2.5% ] 2.14% | 104,605 | 2.9% |
[ 2.0% - 2.5% ] 2.25% | 192,331 | 3.2% |
[ 2.0% - 2.5% ] 2.31% | 10,205 | 6.3% |
[ 2.0% - 2.5% ] 2.38% | 121,317 | 3.8% |
[ 2.0% - 2.5% ] 2.43% | 39,211 | 2.3% |
[ 2.0% - 2.5% ] 2.45% | 43,851 | 1.7% |
[ 2.5% - 3.0% ] 2.52% | 79,195 | 3.2% |
[ 2.5% - 3.0% ] 2.56% | 20,272 | 7.7% |
[ 2.5% - 3.0% ] 2.61% | 66,979 | 3.4% |
[ 2.5% - 3.0% ] 2.67% | 42,916 | 2.9% |
[ 2.5% - 3.0% ] 2.68% | 65,125 | 3.3% |
[ 2.5% - 3.0% ] 2.74% | 10,622 | 5.7% |
[ 2.5% - 3.0% ] 2.78% | 28,212 | 1.8% |
[ 2.5% - 3.0% ] 2.89% | 19,928 | 4.2% |
[ 2.5% - 3.0% ] 2.94% | 239,314 | 2.7% |
[ 2.5% - 3.0% ] 2.99% | 21,738 | 5.0% |
[ 3.0% - 3.5% ] 3.01% | 18,426 | 0.46% |
[ 3.0% - 3.5% ] 3.03% | 56,181 | 6.1% |
[ 3.0% - 3.5% ] 3.17% | 46,331 | 5.6% |
[ 3.0% - 3.5% ] 3.26% | 55,863 | 2.7% |
[ 3.0% - 3.5% ] 3.30% | 12,442 | 0.35% |
[ 3.0% - 3.5% ] 3.39% | 40,738 | 6.0% |
[ 3.5% - 4.0% ] 3.52% | 33,367 | 6.6% |
[ 3.5% - 4.0% ] 3.53% | 29,006 | 1.3% |
[ 3.5% - 4.0% ] 3.56% | 843 | 4.2% |
[ 3.5% - 4.0% ] 3.76% | 4,419 | 2.0% |
[ 3.5% - 4.0% ] 3.99% | 86,804 | 2.4% |
[ 4.0% - 4.5% ] 4.02% | 58,106 | 2.5% |
[ 4.0% - 4.5% ] 4.05% | 22,654 | 1.4% |
[ 4.0% - 4.5% ] 4.39% | 456 | 12.4% |
[ 4.0% - 4.5% ] 4.39% | 43,903 | 3.8% |
[ 4.5% - 5.0% ] 4.50% | 59,453 | 3.5% |
[ 4.5% - 5.0% ] 4.67% | 321 | 4.2% |
[ 4.5% - 5.0% ] 4.73% | 14,225 | 2.3% |
[ 4.5% - 5.0% ] 4.98% | 45,650 | 2.8% |
[ 5.0% - 5.5% ] 5.30% | 283 | 4.3% |
[ 5.5% - 6.0% ] 5.52% | 6,975 | 1.5% |