Tsimshian Disability Age 5 to 17

COMPARE

Tsimshian
Race
Ancestry
AfghanAfricanAlaska NativeAlaskan AthabascanAlbanianAleutAlsatianAmericanApacheArabArapahoArgentineanArmenianAssyrian/Chaldean/SyriacAustralianAustrianBahamianBangladeshiBarbadianBasqueBelgianBelizeanBermudanBhutaneseBlackfeetBolivianBrazilianBritishBritish West IndianBulgarianBurmeseCajunCambodianCanadianCape VerdeanCarpatho RusynCelticCentral AmericanCentral American IndianCherokeeCheyenneChickasawChileanChineseChippewaChoctawColombianColvilleComancheCosta RicanCreeCreekCroatianCrowCubanCypriotCzechCzechoslovakianDanishDelawareDominicanDutchDutch West IndianEastern EuropeanEcuadorianEgyptianEnglishEstonianEthiopianEuropeanFijianFilipinoFinnishFrenchFrench American IndianFrench CanadianGermanGerman RussianGhanaianGreekGuamanian/ChamorroGuatemalanGuyaneseHaitianHmongHonduranHopiHoumaHungarianIcelanderIndian (Asian)IndonesianInupiatIranianIraqiIrishIroquoisIsraeliItalianJamaicanJapaneseJordanianKenyanKiowaKoreanLaotianLatvianLebaneseLiberianLithuanianLumbeeLuxembourgerMacedonianMalaysianMalteseMarshalleseMenomineeMexicanMexican American IndianMongolianMoroccanNative HawaiianNavajoNepaleseNew ZealanderNicaraguanNigerianNorthern EuropeanNorwegianOkinawanOsageOttawaPaiutePakistaniPalestinianPanamanianParaguayanPennsylvania GermanPeruvianPimaPolishPortuguesePotawatomiPuebloPuerto RicanPuget Sound SalishRomanianRussianSalvadoranSamoanScandinavianScotch-IrishScottishSeminoleSenegaleseSerbianShoshoneSierra LeoneanSiouxSlavicSlovakSloveneSomaliSouth AfricanSouth AmericanSouth American IndianSoviet UnionSpaniardSpanishSpanish AmericanSpanish American IndianSri LankanSubsaharan AfricanSudaneseSwedishSwissSyrianTaiwaneseThaiTlingit-HaidaTohono O'OdhamTonganTrinidadian and TobagonianTsimshianTurkishU.S. Virgin IslanderUgandanUkrainianUruguayanUteVenezuelanVietnameseWelshWest IndianYakamaYaquiYugoslavianYumanYup'ikZimbabwean
Immigration
NonimmigrantsImmigrantsAfghanistanAfricaAlbaniaArgentinaArmeniaAsiaAustraliaAustriaBahamasBangladeshBarbadosBelarusBelgiumBelizeBoliviaBosnia and HerzegovinaBrazilBulgariaBurma/MyanmarCabo VerdeCambodiaCameroonCanadaCaribbeanCentral AmericaChileChinaColombiaCongoCosta RicaCroatiaCubaCzechoslovakiaDenmarkDominicaDominican RepublicEastern AfricaEastern AsiaEastern EuropeEcuadorEgyptEl SalvadorEnglandEritreaEthiopiaEuropeFijiFranceGermanyGhanaGreeceGrenadaGuatemalaGuyanaHaitiHondurasHong KongHungaryIndiaIndonesiaIranIraqIrelandIsraelItalyJamaicaJapanJordanKazakhstanKenyaKoreaKuwaitLaosLatin AmericaLatviaLebanonLiberiaLithuaniaMalaysiaMexicoMicronesiaMiddle AfricaMoldovaMoroccoNepalNetherlandsNicaraguaNigeriaNorth AmericaNorth MacedoniaNorthern AfricaNorthern EuropeNorwayOceaniaPakistanPanamaPeruPhilippinesPolandPortugalRomaniaRussiaSaudi ArabiaScotlandSenegalSerbiaSierra LeoneSingaporeSomaliaSouth AfricaSouth AmericaSouth Central AsiaSouth Eastern AsiaSouthern EuropeSpainSri LankaSt. Vincent and the GrenadinesSudanSwedenSwitzerlandSyriaTaiwanThailandTrinidad and TobagoTurkeyUgandaUkraineUruguayUzbekistanVenezuelaVietnamWest IndiesWestern AfricaWestern AsiaWestern EuropeYemenZaireZimbabweAzores
Select to Compare
Race
Ancestry
AfghanAfricanAlaska NativeAlaskan AthabascanAlbanianAleutAlsatianAmericanApacheArabArapahoArgentineanArmenianAssyrian/Chaldean/SyriacAustralianAustrianBahamianBangladeshiBarbadianBasqueBelgianBelizeanBermudanBhutaneseBlackfeetBolivianBrazilianBritishBritish West IndianBulgarianBurmeseCajunCambodianCanadianCape VerdeanCarpatho RusynCelticCentral AmericanCentral American IndianCherokeeCheyenneChickasawChileanChineseChippewaChoctawColombianColvilleComancheCosta RicanCreeCreekCroatianCrowCubanCypriotCzechCzechoslovakianDanishDelawareDominicanDutchDutch West IndianEastern EuropeanEcuadorianEgyptianEnglishEstonianEthiopianEuropeanFijianFilipinoFinnishFrenchFrench American IndianFrench CanadianGermanGerman RussianGhanaianGreekGuamanian/ChamorroGuatemalanGuyaneseHaitianHmongHonduranHopiHoumaHungarianIcelanderIndian (Asian)IndonesianInupiatIranianIraqiIrishIroquoisIsraeliItalianJamaicanJapaneseJordanianKenyanKiowaKoreanLaotianLatvianLebaneseLiberianLithuanianLumbeeLuxembourgerMacedonianMalaysianMalteseMarshalleseMenomineeMexicanMexican American IndianMongolianMoroccanNative HawaiianNavajoNepaleseNew ZealanderNicaraguanNigerianNorthern EuropeanNorwegianOkinawanOsageOttawaPaiutePakistaniPalestinianPanamanianParaguayanPennsylvania GermanPeruvianPimaPolishPortuguesePotawatomiPuebloPuerto RicanPuget Sound SalishRomanianRussianSalvadoranSamoanScandinavianScotch-IrishScottishSeminoleSenegaleseSerbianShoshoneSierra LeoneanSiouxSlavicSlovakSloveneSomaliSouth AfricanSouth AmericanSouth American IndianSoviet UnionSpaniardSpanishSpanish AmericanSpanish American IndianSri LankanSubsaharan AfricanSudaneseSwedishSwissSyrianTaiwaneseThaiTlingit-HaidaTohono O'OdhamTonganTrinidadian and TobagonianTurkishU.S. Virgin IslanderUgandanUkrainianUruguayanUteVenezuelanVietnameseWelshWest IndianYakamaYaquiYugoslavianYumanYup'ikZimbabwean
Immigration
NonimmigrantsImmigrantsAfghanistanAfricaAlbaniaArgentinaArmeniaAsiaAustraliaAustriaBahamasBangladeshBarbadosBelarusBelgiumBelizeBoliviaBosnia and HerzegovinaBrazilBulgariaBurma/MyanmarCabo VerdeCambodiaCameroonCanadaCaribbeanCentral AmericaChileChinaColombiaCongoCosta RicaCroatiaCubaCzechoslovakiaDenmarkDominicaDominican RepublicEastern AfricaEastern AsiaEastern EuropeEcuadorEgyptEl SalvadorEnglandEritreaEthiopiaEuropeFijiFranceGermanyGhanaGreeceGrenadaGuatemalaGuyanaHaitiHondurasHong KongHungaryIndiaIndonesiaIranIraqIrelandIsraelItalyJamaicaJapanJordanKazakhstanKenyaKoreaKuwaitLaosLatin AmericaLatviaLebanonLiberiaLithuaniaMalaysiaMexicoMicronesiaMiddle AfricaMoldovaMoroccoNepalNetherlandsNicaraguaNigeriaNorth AmericaNorth MacedoniaNorthern AfricaNorthern EuropeNorwayOceaniaPakistanPanamaPeruPhilippinesPolandPortugalRomaniaRussiaSaudi ArabiaScotlandSenegalSerbiaSierra LeoneSingaporeSomaliaSouth AfricaSouth AmericaSouth Central AsiaSouth Eastern AsiaSouthern EuropeSpainSri LankaSt. Vincent and the GrenadinesSudanSwedenSwitzerlandSyriaTaiwanThailandTrinidad and TobagoTurkeyUgandaUkraineUruguayUzbekistanVenezuelaVietnamWest IndiesWestern AfricaWestern AsiaWestern EuropeYemenZaireZimbabweAzores
Disability Age 5 to 17
Income
Poverty
Unemployment
Labor Participation
Family Structure
Vehicle Availability
Education Level
Disability

Tsimshian Disability Age 5 to 17
Tragic

7.9%
DISABILITY | AGE 5 TO 17
0.0/ 100
METRIC RATING
345th/ 347
METRIC RANK

Tsimshian Disability Age 5 to 17 Correlation Chart

The statistical analysis conducted on geographies consisting of 15,604,652 people shows a very strong positive correlation between the proportion of Tsimshian and percentage of population with a disability between the ages 5 and 17 in the United States with a correlation coefficient (R) of 0.879 and weighted average of 7.9%. On average, for every 1% (one percent) increase in Tsimshian within a typical geography, there is an increase of 0.14% in percentage of population with a disability between the ages 5 and 17.
Tsimshian Disability Age 5 to 17
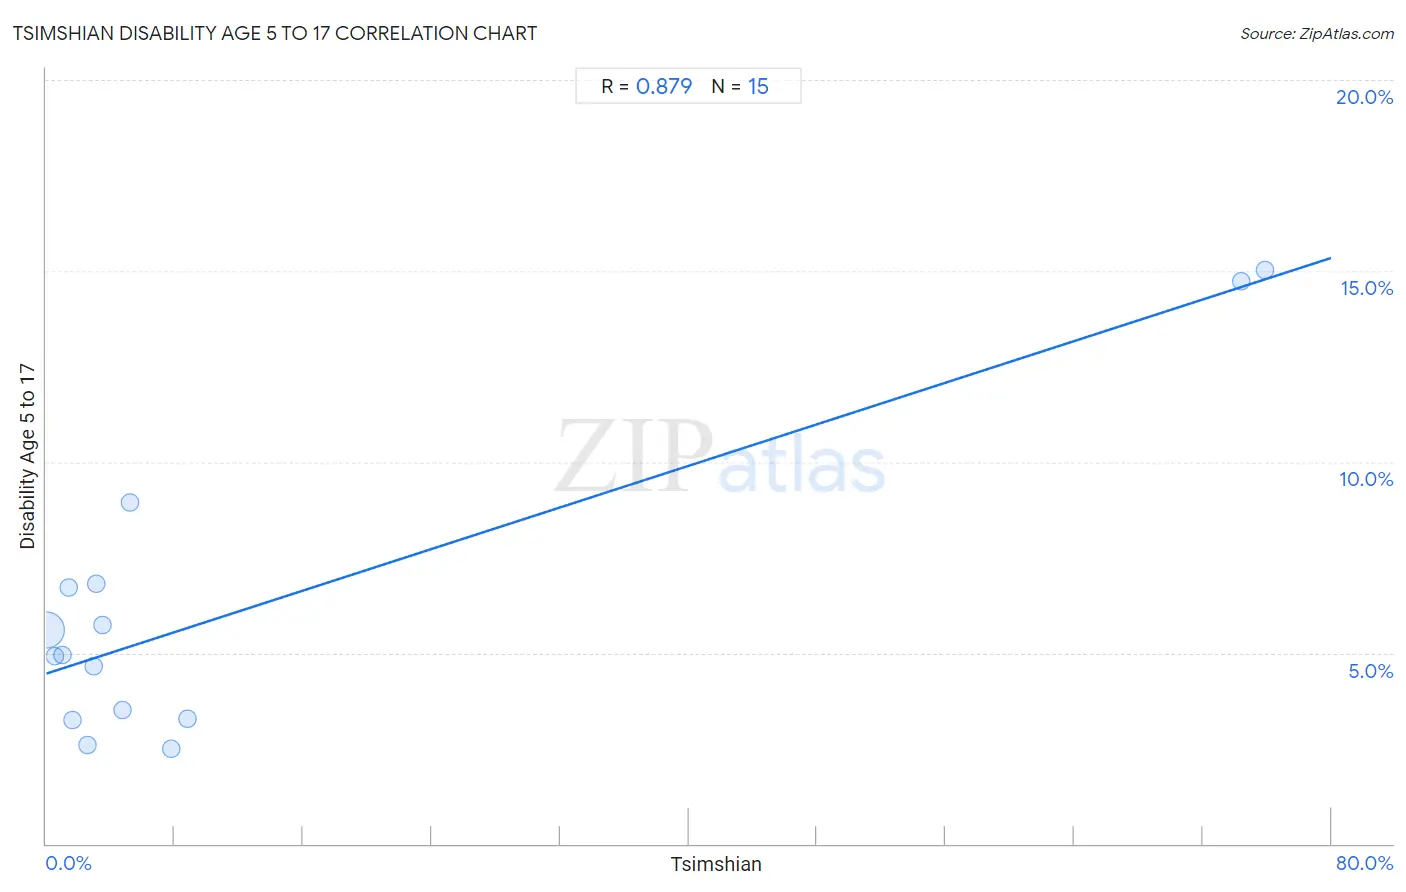
It is essential to understand that the correlation between the percentage of Tsimshian and percentage of population with a disability between the ages 5 and 17 does not imply a direct cause-and-effect relationship. It remains uncertain whether the presence of Tsimshian influences an upward or downward trend in the level of percentage of population with a disability between the ages 5 and 17 within an area, or if Tsimshian simply ended up residing in those areas with higher or lower levels of percentage of population with a disability between the ages 5 and 17 due to other factors.

Demographics Similar to Tsimshian by Disability Age 5 to 17

In terms of disability age 5 to 17, the demographic groups most similar to Tsimshian are Puerto Rican (8.3%, a difference of 4.4%), Cajun (7.2%, a difference of 10.4%), Immigrants from Cabo Verde (7.1%, a difference of 11.2%), Chippewa (7.1%, a difference of 11.5%), and Cape Verdean (7.0%, a difference of 13.9%).
DemographicsRating | RankDisability Age 5 to 17
Blacks/African Americans
0.0
/100
|
#333
Tragic
6.8%
Seminole
0.0
/100
|
#334
Tragic
6.8%
Ottawa
0.0
/100
|
#335
Tragic
6.8%
Chickasaw
0.0
/100
|
#336
Tragic
6.8%
Creek
0.0
/100
|
#337
Tragic
6.9%
Iroquois
0.0
/100
|
#338
Tragic
6.9%
Choctaw
0.0
/100
|
#339
Tragic
6.9%
Cherokee
0.0
/100
|
#340
Tragic
6.9%
Cape Verdeans
0.0
/100
|
#341
Tragic
7.0%
Chippewa
0.0
/100
|
#342
Tragic
7.1%
Immigrants from Cabo Verde
0.0
/100
|
#343
Tragic
7.1%
Cajuns
0.0
/100
|
#344
Tragic
7.2%
Tsimshian
0.0
/100
|
#345
Tragic
7.9%
Puerto Ricans
0.0
/100
|
#346
Tragic
8.3%
Houma
0.0
/100
|
#347
Tragic
9.1%

Tsimshian Disability Age 5 to 17 Correlation Summary

MeasurementTsimshian DataDisability Age 5 to 17 Data
Minimum0.024%2.5%
Maximum75.9%15.0%
Range75.8%12.5%
Mean12.9%6.2%
Median3.1%4.9%
Interquartile 25% (IQ1)1.4%3.3%
Interquartile 75% (IQ3)7.8%6.8%
Interquartile Range (IQR)6.3%3.6%
Standard Deviation (Sample)25.4%3.9%
Standard Deviation (Population)24.5%3.8%

Correlation Details

Tsimshian PercentileSample SizeDisability Age 5 to 17
[
0.0%
-
0.5%
]
0.024%
15,385,8645.6%
[
0.5%
-
1.0%
]
0.53%
170,0824.9%
[
0.5%
-
1.0%
]
0.99%
15,5804.9%
[
1.0%
-
1.5%
]
1.41%
3,3266.7%
[
1.5%
-
2.0%
]
1.62%
8043.2%
[
2.5%
-
3.0%
]
2.53%
7902.6%
[
2.5%
-
3.0%
]
2.92%
8224.6%
[
3.0%
-
3.5%
]
3.10%
8386.8%
[
3.0%
-
3.5%
]
3.46%
13,9135.7%
[
4.5%
-
5.0%
]
4.77%
8,1683.5%
[
5.0%
-
5.5%
]
5.18%
6568.9%
[
7.5%
-
8.0%
]
7.76%
3612.5%
[
8.5%
-
9.0%
]
8.79%
5463.3%
[
74.0%
-
74.5%
]
74.40%
1,46514.7%
[
75.5%
-
76.0%
]
75.85%
1,43715.0%