American Disability Age 5 to 17
COMPARE
American
Select to Compare
Disability Age 5 to 17
American Disability Age 5 to 17
6.5%
DISABILITY | AGE 5 TO 17
0.0/ 100
METRIC RATING
325th/ 347
METRIC RANK
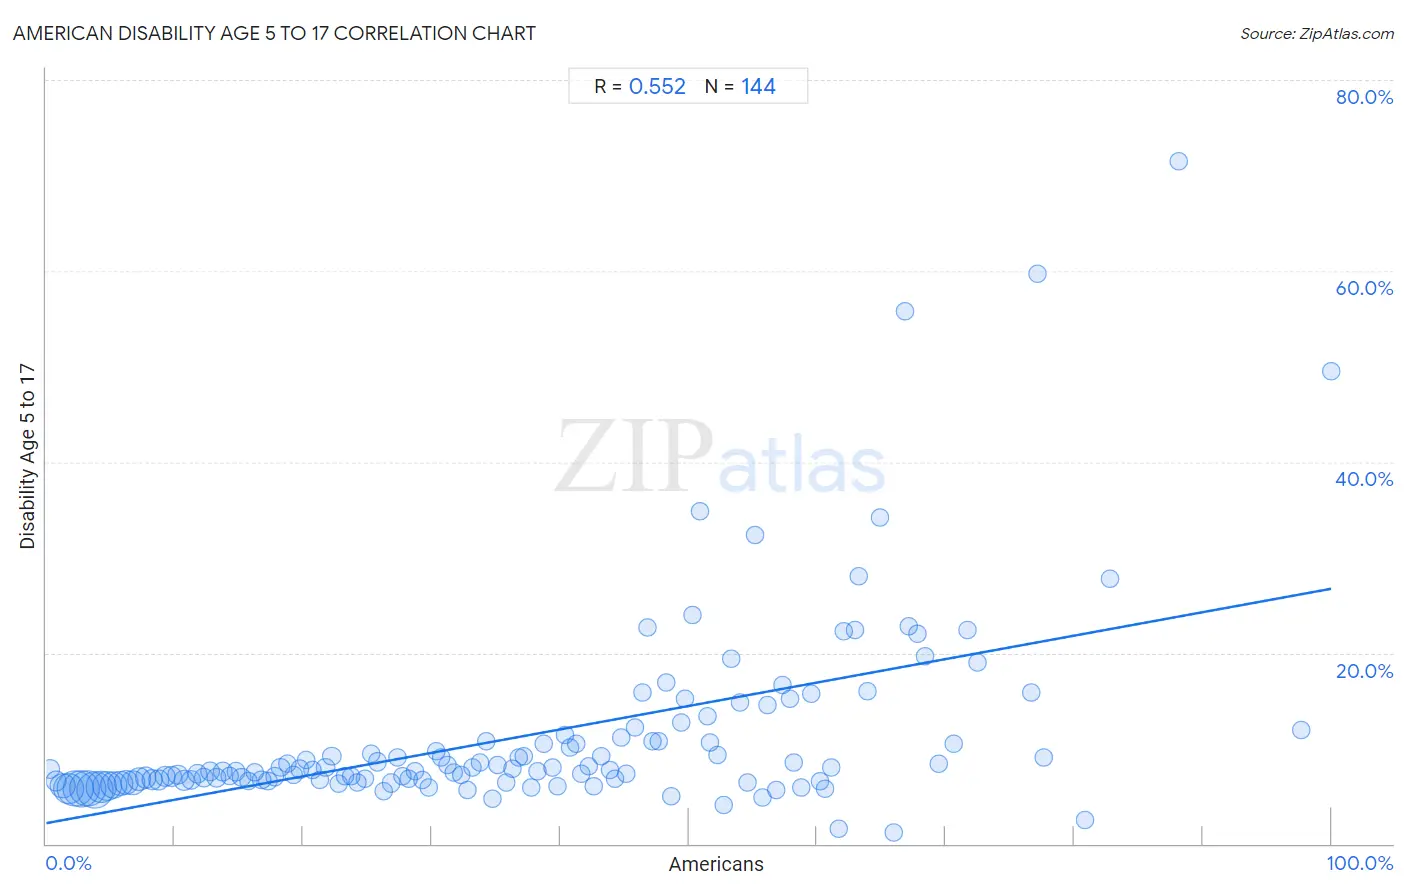
American Disability Age 5 to 17 Correlation Chart
The statistical analysis conducted on geographies consisting of 566,133,165 people shows a substantial positive correlation between the proportion of Americans and percentage of population with a disability between the ages 5 and 17 in the United States with a correlation coefficient (R) of 0.552 and weighted average of 6.5%. On average, for every 1% (one percent) increase in Americans within a typical geography, there is an increase of 0.25% in percentage of population with a disability between the ages 5 and 17.
It is essential to understand that the correlation between the percentage of Americans and percentage of population with a disability between the ages 5 and 17 does not imply a direct cause-and-effect relationship. It remains uncertain whether the presence of Americans influences an upward or downward trend in the level of percentage of population with a disability between the ages 5 and 17 within an area, or if Americans simply ended up residing in those areas with higher or lower levels of percentage of population with a disability between the ages 5 and 17 due to other factors.
Demographics Similar to Americans by Disability Age 5 to 17
In terms of disability age 5 to 17, the demographic groups most similar to Americans are Dominican (6.5%, a difference of 0.050%), Potawatomi (6.5%, a difference of 0.13%), Osage (6.5%, a difference of 0.14%), Slovak (6.5%, a difference of 0.17%), and Tohono O'odham (6.5%, a difference of 0.19%).
| Demographics | Rating | Rank | Disability Age 5 to 17 |
| Comanche | 0.0 /100 | #318 | Tragic 6.4% |
| Delaware | 0.0 /100 | #319 | Tragic 6.5% |
| Africans | 0.0 /100 | #320 | Tragic 6.5% |
| Tohono O'odham | 0.0 /100 | #321 | Tragic 6.5% |
| Slovaks | 0.0 /100 | #322 | Tragic 6.5% |
| Osage | 0.0 /100 | #323 | Tragic 6.5% |
| Dominicans | 0.0 /100 | #324 | Tragic 6.5% |
| Americans | 0.0 /100 | #325 | Tragic 6.5% |
| Potawatomi | 0.0 /100 | #326 | Tragic 6.5% |
| French American Indians | 0.0 /100 | #327 | Tragic 6.6% |
| Pennsylvania Germans | 0.0 /100 | #328 | Tragic 6.6% |
| Blackfeet | 0.0 /100 | #329 | Tragic 6.6% |
| Dutch West Indians | 0.0 /100 | #330 | Tragic 6.7% |
| French Canadians | 0.0 /100 | #331 | Tragic 6.7% |
| Immigrants from the Azores | 0.0 /100 | #332 | Tragic 6.7% |
American Disability Age 5 to 17 Correlation Summary
| Measurement | American Data | Disability Age 5 to 17 Data |
| Minimum | 0.34% | 1.2% |
| Maximum | 100.0% | 71.4% |
| Range | 99.7% | 70.2% |
| Mean | 37.1% | 11.3% |
| Median | 36.0% | 7.7% |
| Interquartile 25% (IQ1) | 18.0% | 6.6% |
| Interquartile 75% (IQ3) | 54.3% | 10.8% |
| Interquartile Range (IQR) | 36.3% | 4.2% |
| Standard Deviation (Sample) | 22.9% | 10.2% |
| Standard Deviation (Population) | 22.8% | 10.2% |
Correlation Details
| American Percentile | Sample Size | Disability Age 5 to 17 |
[ 0.0% - 0.5% ] 0.34% | 2,542,916 | 7.8% |
[ 0.5% - 1.0% ] 0.79% | 8,720,163 | 6.6% |
[ 1.0% - 1.5% ] 1.28% | 21,883,294 | 6.1% |
[ 1.5% - 2.0% ] 1.76% | 38,793,751 | 5.8% |
[ 2.0% - 2.5% ] 2.26% | 55,493,486 | 5.8% |
[ 2.5% - 3.0% ] 2.75% | 56,739,832 | 5.7% |
[ 3.0% - 3.5% ] 3.24% | 55,691,235 | 5.8% |
[ 3.5% - 4.0% ] 3.75% | 57,275,820 | 5.7% |
[ 4.0% - 4.5% ] 4.25% | 38,441,807 | 6.0% |
[ 4.5% - 5.0% ] 4.74% | 36,271,669 | 6.0% |
[ 5.0% - 5.5% ] 5.25% | 26,826,177 | 6.2% |
[ 5.5% - 6.0% ] 5.76% | 21,032,046 | 6.3% |
[ 6.0% - 6.5% ] 6.24% | 19,723,306 | 6.4% |
[ 6.5% - 7.0% ] 6.75% | 17,153,305 | 6.4% |
[ 7.0% - 7.5% ] 7.24% | 12,835,997 | 6.8% |
[ 7.5% - 8.0% ] 7.74% | 10,960,924 | 6.9% |
[ 8.0% - 8.5% ] 8.26% | 9,835,133 | 6.7% |
[ 8.5% - 9.0% ] 8.74% | 7,598,885 | 6.7% |
[ 9.0% - 9.5% ] 9.24% | 7,063,587 | 7.1% |
[ 9.5% - 10.0% ] 9.74% | 5,994,504 | 7.0% |
[ 10.0% - 10.5% ] 10.24% | 5,743,514 | 7.3% |
[ 10.5% - 11.0% ] 10.73% | 5,481,596 | 6.7% |
[ 11.0% - 11.5% ] 11.24% | 4,458,496 | 6.7% |
[ 11.5% - 12.0% ] 11.72% | 4,041,031 | 7.3% |
[ 12.0% - 12.5% ] 12.24% | 3,274,742 | 7.0% |
[ 12.5% - 13.0% ] 12.73% | 3,113,900 | 7.6% |
[ 13.0% - 13.5% ] 13.24% | 2,358,882 | 6.9% |
[ 13.5% - 14.0% ] 13.75% | 2,073,175 | 7.6% |
[ 14.0% - 14.5% ] 14.27% | 1,873,290 | 7.1% |
[ 14.5% - 15.0% ] 14.76% | 1,656,900 | 7.5% |
[ 15.0% - 15.5% ] 15.21% | 1,420,739 | 7.0% |
[ 15.5% - 16.0% ] 15.76% | 1,726,952 | 6.6% |
[ 16.0% - 16.5% ] 16.25% | 1,508,999 | 7.5% |
[ 16.5% - 17.0% ] 16.77% | 1,095,767 | 6.7% |
[ 17.0% - 17.5% ] 17.23% | 1,406,431 | 6.5% |
[ 17.5% - 18.0% ] 17.76% | 1,343,113 | 7.0% |
[ 18.0% - 18.5% ] 18.22% | 894,628 | 8.0% |
[ 18.5% - 19.0% ] 18.75% | 716,808 | 8.4% |
[ 19.0% - 19.5% ] 19.23% | 779,590 | 7.2% |
[ 19.5% - 20.0% ] 19.77% | 899,047 | 7.8% |
[ 20.0% - 20.5% ] 20.24% | 538,073 | 8.8% |
[ 20.5% - 21.0% ] 20.73% | 472,820 | 7.7% |
[ 21.0% - 21.5% ] 21.29% | 651,470 | 6.7% |
[ 21.5% - 22.0% ] 21.73% | 520,242 | 8.0% |
[ 22.0% - 22.5% ] 22.23% | 311,311 | 9.1% |
[ 22.5% - 23.0% ] 22.75% | 578,458 | 6.2% |
[ 23.0% - 23.5% ] 23.27% | 354,664 | 7.1% |
[ 23.5% - 24.0% ] 23.75% | 377,687 | 7.1% |
[ 24.0% - 24.5% ] 24.26% | 426,547 | 6.4% |
[ 24.5% - 25.0% ] 24.76% | 279,346 | 6.9% |
[ 25.0% - 25.5% ] 25.26% | 269,512 | 9.4% |
[ 25.5% - 26.0% ] 25.74% | 269,255 | 8.6% |
[ 26.0% - 26.5% ] 26.25% | 256,297 | 5.4% |
[ 26.5% - 27.0% ] 26.86% | 500,945 | 6.4% |
[ 27.0% - 27.5% ] 27.31% | 235,178 | 9.0% |
[ 27.5% - 28.0% ] 27.75% | 254,030 | 7.1% |
[ 28.0% - 28.5% ] 28.22% | 229,372 | 6.8% |
[ 28.5% - 29.0% ] 28.71% | 136,945 | 7.5% |
[ 29.0% - 29.5% ] 29.25% | 218,319 | 6.7% |
[ 29.5% - 30.0% ] 29.72% | 173,163 | 5.9% |
[ 30.0% - 30.5% ] 30.31% | 96,108 | 9.7% |
[ 30.5% - 31.0% ] 30.75% | 241,083 | 9.0% |
[ 31.0% - 31.5% ] 31.24% | 121,051 | 8.2% |
[ 31.5% - 32.0% ] 31.73% | 68,992 | 7.5% |
[ 32.0% - 32.5% ] 32.25% | 235,989 | 7.2% |
[ 32.5% - 33.0% ] 32.75% | 95,207 | 5.6% |
[ 33.0% - 33.5% ] 33.20% | 91,674 | 8.0% |
[ 33.5% - 34.0% ] 33.72% | 75,793 | 8.5% |
[ 34.0% - 34.5% ] 34.20% | 35,721 | 10.8% |
[ 34.5% - 35.0% ] 34.75% | 89,833 | 4.8% |
[ 35.0% - 35.5% ] 35.16% | 48,954 | 8.2% |
[ 35.5% - 36.0% ] 35.78% | 98,700 | 6.4% |
[ 36.0% - 36.5% ] 36.27% | 123,607 | 7.8% |
[ 36.5% - 37.0% ] 36.81% | 49,234 | 9.1% |
[ 37.0% - 37.5% ] 37.19% | 55,529 | 9.2% |
[ 37.5% - 38.0% ] 37.71% | 79,061 | 5.9% |
[ 38.0% - 38.5% ] 38.21% | 30,131 | 7.6% |
[ 38.5% - 39.0% ] 38.72% | 34,502 | 10.5% |
[ 39.0% - 39.5% ] 39.36% | 67,525 | 7.9% |
[ 39.5% - 40.0% ] 39.80% | 51,255 | 6.1% |
[ 40.0% - 40.5% ] 40.34% | 21,020 | 11.5% |
[ 40.5% - 41.0% ] 40.79% | 25,278 | 10.1% |
[ 41.0% - 41.5% ] 41.28% | 30,734 | 10.5% |
[ 41.5% - 42.0% ] 41.63% | 27,244 | 7.4% |
[ 42.0% - 42.5% ] 42.26% | 19,614 | 8.1% |
[ 42.5% - 43.0% ] 42.65% | 11,656 | 6.0% |
[ 43.0% - 43.5% ] 43.22% | 43,399 | 9.1% |
[ 43.5% - 44.0% ] 43.87% | 37,582 | 7.8% |
[ 44.0% - 44.5% ] 44.25% | 15,194 | 6.8% |
[ 44.5% - 45.0% ] 44.76% | 35,405 | 11.2% |
[ 45.0% - 45.5% ] 45.14% | 9,507 | 7.4% |
[ 45.5% - 46.0% ] 45.80% | 15,776 | 12.1% |
[ 46.0% - 46.5% ] 46.36% | 8,473 | 15.9% |
[ 46.5% - 47.0% ] 46.83% | 2,022 | 22.6% |
[ 47.0% - 47.5% ] 47.15% | 29,648 | 10.8% |
[ 47.5% - 48.0% ] 47.71% | 7,604 | 10.7% |
[ 48.0% - 48.5% ] 48.28% | 23,252 | 16.9% |
[ 48.5% - 49.0% ] 48.63% | 5,637 | 5.0% |
[ 49.0% - 49.5% ] 49.37% | 15,683 | 12.7% |
[ 49.5% - 50.0% ] 49.71% | 16,134 | 15.2% |
[ 50.0% - 50.5% ] 50.26% | 8,529 | 24.0% |
[ 50.5% - 51.0% ] 50.87% | 2,974 | 34.8% |
[ 51.0% - 51.5% ] 51.44% | 2,323 | 13.4% |
[ 51.5% - 52.0% ] 51.63% | 11,891 | 10.6% |
[ 52.0% - 52.5% ] 52.22% | 10,214 | 9.3% |
[ 52.5% - 53.0% ] 52.69% | 1,657 | 4.0% |
[ 53.0% - 53.5% ] 53.31% | 13,952 | 19.4% |
[ 53.5% - 54.0% ] 53.96% | 845 | 14.8% |
[ 54.5% - 55.0% ] 54.55% | 8,524 | 6.4% |
[ 55.0% - 55.5% ] 55.16% | 1,280 | 32.4% |
[ 55.5% - 56.0% ] 55.74% | 2,133 | 4.8% |
[ 56.0% - 56.5% ] 56.12% | 8,678 | 14.6% |
[ 56.5% - 57.0% ] 56.81% | 15,750 | 5.6% |
[ 57.0% - 57.5% ] 57.27% | 1,919 | 16.7% |
[ 57.5% - 58.0% ] 57.91% | 411 | 15.2% |
[ 58.0% - 58.5% ] 58.13% | 1,383 | 8.5% |
[ 58.5% - 59.0% ] 58.77% | 10,808 | 5.8% |
[ 59.5% - 60.0% ] 59.52% | 1,213 | 15.7% |
[ 60.0% - 60.5% ] 60.25% | 3,849 | 6.5% |
[ 60.5% - 61.0% ] 60.57% | 1,461 | 5.7% |
[ 61.0% - 61.5% ] 61.13% | 705 | 7.9% |
[ 61.5% - 62.0% ] 61.68% | 6,107 | 1.6% |
[ 62.0% - 62.5% ] 62.09% | 153 | 22.2% |
[ 62.5% - 63.0% ] 62.97% | 2,471 | 22.4% |
[ 63.0% - 63.5% ] 63.28% | 4,967 | 28.0% |
[ 63.5% - 64.0% ] 63.87% | 2,336 | 15.9% |
[ 64.5% - 65.0% ] 64.85% | 1,687 | 34.1% |
[ 65.5% - 66.0% ] 65.94% | 508 | 1.2% |
[ 66.5% - 67.0% ] 66.81% | 1,856 | 55.7% |
[ 67.0% - 67.5% ] 67.08% | 1,917 | 22.8% |
[ 67.5% - 68.0% ] 67.80% | 236 | 22.0% |
[ 68.0% - 68.5% ] 68.41% | 1,412 | 19.7% |
[ 69.5% - 70.0% ] 69.50% | 2,528 | 8.4% |
[ 70.5% - 71.0% ] 70.64% | 613 | 10.4% |
[ 71.5% - 72.0% ] 71.72% | 389 | 22.3% |
[ 72.0% - 72.5% ] 72.44% | 2,431 | 19.0% |
[ 76.5% - 77.0% ] 76.67% | 883 | 15.8% |
[ 77.0% - 77.5% ] 77.19% | 583 | 59.6% |
[ 77.5% - 78.0% ] 77.62% | 478 | 9.1% |
[ 80.5% - 81.0% ] 80.82% | 146 | 2.4% |
[ 82.5% - 83.0% ] 82.81% | 128 | 27.8% |
[ 88.0% - 88.5% ] 88.10% | 42 | 71.4% |
[ 97.5% - 98.0% ] 97.64% | 339 | 11.9% |
[ 99.5% - 100.0% ] 100.00% | 574 | 49.5% |