Immigrants from El Salvador Disability Age 5 to 17
COMPARE
Immigrants from El Salvador
Select to Compare
Disability Age 5 to 17
Immigrants from El Salvador Disability Age 5 to 17
5.3%
DISABILITY | AGE 5 TO 17
99.0/ 100
METRIC RATING
96th/ 347
METRIC RANK
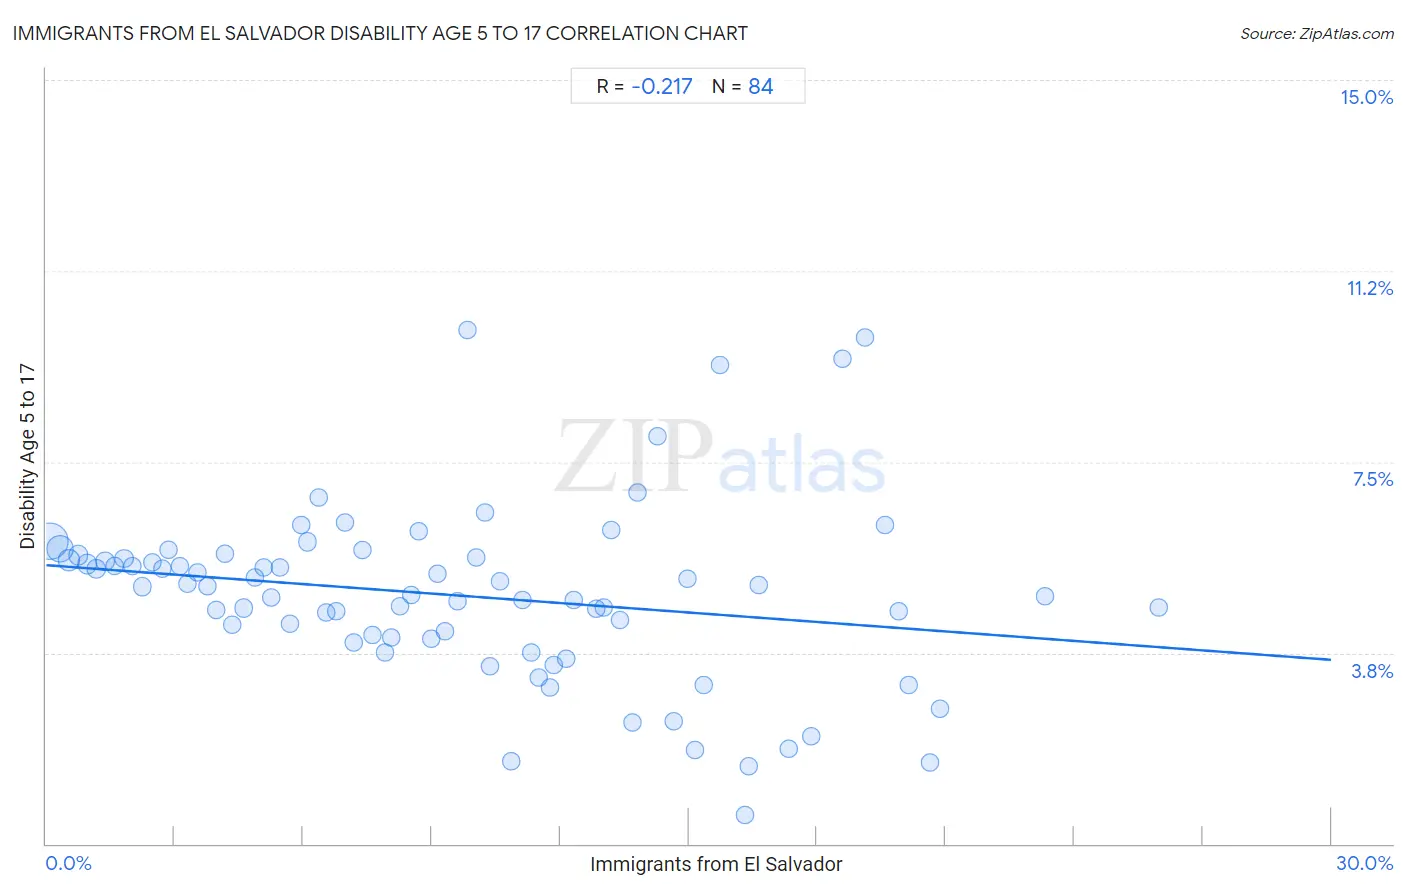
Immigrants from El Salvador Disability Age 5 to 17 Correlation Chart
The statistical analysis conducted on geographies consisting of 355,746,060 people shows a weak negative correlation between the proportion of Immigrants from El Salvador and percentage of population with a disability between the ages 5 and 17 in the United States with a correlation coefficient (R) of -0.217 and weighted average of 5.3%. On average, for every 1% (one percent) increase in Immigrants from El Salvador within a typical geography, there is a decrease of 0.062% in percentage of population with a disability between the ages 5 and 17.
It is essential to understand that the correlation between the percentage of Immigrants from El Salvador and percentage of population with a disability between the ages 5 and 17 does not imply a direct cause-and-effect relationship. It remains uncertain whether the presence of Immigrants from El Salvador influences an upward or downward trend in the level of percentage of population with a disability between the ages 5 and 17 within an area, or if Immigrants from El Salvador simply ended up residing in those areas with higher or lower levels of percentage of population with a disability between the ages 5 and 17 due to other factors.
Demographics Similar to Immigrants from El Salvador by Disability Age 5 to 17
In terms of disability age 5 to 17, the demographic groups most similar to Immigrants from El Salvador are Immigrants from Europe (5.3%, a difference of 0.0%), Immigrants from Austria (5.3%, a difference of 0.050%), Cambodian (5.3%, a difference of 0.15%), Immigrants from Grenada (5.3%, a difference of 0.16%), and Immigrants from Jordan (5.3%, a difference of 0.18%).
| Demographics | Rating | Rank | Disability Age 5 to 17 |
| Immigrants from Spain | 99.4 /100 | #89 | Exceptional 5.2% |
| Immigrants from Kuwait | 99.4 /100 | #90 | Exceptional 5.3% |
| Mongolians | 99.2 /100 | #91 | Exceptional 5.3% |
| Luxembourgers | 99.2 /100 | #92 | Exceptional 5.3% |
| Immigrants from Peru | 99.1 /100 | #93 | Exceptional 5.3% |
| Immigrants from Jordan | 99.1 /100 | #94 | Exceptional 5.3% |
| Immigrants from Grenada | 99.1 /100 | #95 | Exceptional 5.3% |
| Immigrants from El Salvador | 99.0 /100 | #96 | Exceptional 5.3% |
| Immigrants from Europe | 99.0 /100 | #97 | Exceptional 5.3% |
| Immigrants from Austria | 98.9 /100 | #98 | Exceptional 5.3% |
| Cambodians | 98.8 /100 | #99 | Exceptional 5.3% |
| Nepalese | 98.7 /100 | #100 | Exceptional 5.3% |
| Menominee | 98.7 /100 | #101 | Exceptional 5.3% |
| Nicaraguans | 98.6 /100 | #102 | Exceptional 5.3% |
| Salvadorans | 98.6 /100 | #103 | Exceptional 5.3% |
Immigrants from El Salvador Disability Age 5 to 17 Correlation Summary
| Measurement | Immigrants from El Salvador Data | Disability Age 5 to 17 Data |
| Minimum | 0.094% | 0.57% |
| Maximum | 26.0% | 10.1% |
| Range | 25.9% | 9.5% |
| Mean | 9.6% | 4.9% |
| Median | 9.1% | 5.0% |
| Interquartile 25% (IQ1) | 4.5% | 4.0% |
| Interquartile 75% (IQ3) | 13.7% | 5.6% |
| Interquartile Range (IQR) | 9.3% | 1.6% |
| Standard Deviation (Sample) | 6.1% | 1.8% |
| Standard Deviation (Population) | 6.1% | 1.7% |
Correlation Details
| Immigrants from El Salvador Percentile | Sample Size | Disability Age 5 to 17 |
[ 0.0% - 0.5% ] 0.094% | 159,483,620 | 6.0% |
[ 0.0% - 0.5% ] 0.32% | 73,598,329 | 5.8% |
[ 0.5% - 1.0% ] 0.53% | 28,993,965 | 5.6% |
[ 0.5% - 1.0% ] 0.75% | 18,264,546 | 5.7% |
[ 0.5% - 1.0% ] 0.96% | 15,148,858 | 5.5% |
[ 1.0% - 1.5% ] 1.16% | 9,956,889 | 5.4% |
[ 1.0% - 1.5% ] 1.39% | 8,349,893 | 5.5% |
[ 1.5% - 2.0% ] 1.60% | 5,653,716 | 5.5% |
[ 1.5% - 2.0% ] 1.82% | 4,120,047 | 5.6% |
[ 2.0% - 2.5% ] 2.02% | 2,802,324 | 5.5% |
[ 2.0% - 2.5% ] 2.24% | 2,857,595 | 5.0% |
[ 2.0% - 2.5% ] 2.47% | 2,169,689 | 5.5% |
[ 2.5% - 3.0% ] 2.70% | 1,825,654 | 5.4% |
[ 2.5% - 3.0% ] 2.85% | 3,605,793 | 5.8% |
[ 3.0% - 3.5% ] 3.11% | 1,207,511 | 5.4% |
[ 3.0% - 3.5% ] 3.30% | 1,078,593 | 5.1% |
[ 3.5% - 4.0% ] 3.52% | 1,051,843 | 5.3% |
[ 3.5% - 4.0% ] 3.76% | 851,364 | 5.1% |
[ 3.5% - 4.0% ] 3.97% | 635,110 | 4.6% |
[ 4.0% - 4.5% ] 4.19% | 503,868 | 5.7% |
[ 4.0% - 4.5% ] 4.35% | 4,428,853 | 4.3% |
[ 4.5% - 5.0% ] 4.62% | 674,687 | 4.6% |
[ 4.5% - 5.0% ] 4.87% | 601,028 | 5.2% |
[ 5.0% - 5.5% ] 5.07% | 594,963 | 5.4% |
[ 5.0% - 5.5% ] 5.25% | 294,869 | 4.8% |
[ 5.0% - 5.5% ] 5.47% | 694,904 | 5.4% |
[ 5.5% - 6.0% ] 5.69% | 376,170 | 4.3% |
[ 5.5% - 6.0% ] 5.94% | 217,826 | 6.3% |
[ 6.0% - 6.5% ] 6.11% | 238,390 | 5.9% |
[ 6.0% - 6.5% ] 6.35% | 150,230 | 6.8% |
[ 6.5% - 7.0% ] 6.53% | 459,282 | 4.5% |
[ 6.5% - 7.0% ] 6.76% | 394,445 | 4.6% |
[ 6.5% - 7.0% ] 6.98% | 87,131 | 6.3% |
[ 7.0% - 7.5% ] 7.17% | 168,495 | 4.0% |
[ 7.0% - 7.5% ] 7.37% | 289,220 | 5.8% |
[ 7.5% - 8.0% ] 7.62% | 239,849 | 4.1% |
[ 7.5% - 8.0% ] 7.90% | 82,344 | 3.7% |
[ 8.0% - 8.5% ] 8.07% | 109,881 | 4.1% |
[ 8.0% - 8.5% ] 8.26% | 367,588 | 4.7% |
[ 8.5% - 9.0% ] 8.53% | 339,140 | 4.9% |
[ 8.5% - 9.0% ] 8.71% | 150,141 | 6.1% |
[ 8.5% - 9.0% ] 9.00% | 85,996 | 4.0% |
[ 9.0% - 9.5% ] 9.13% | 155,953 | 5.3% |
[ 9.0% - 9.5% ] 9.32% | 326,786 | 4.2% |
[ 9.5% - 10.0% ] 9.59% | 95,999 | 4.8% |
[ 9.5% - 10.0% ] 9.82% | 136,570 | 10.1% |
[ 10.0% - 10.5% ] 10.05% | 103,022 | 5.6% |
[ 10.0% - 10.5% ] 10.25% | 33,408 | 6.5% |
[ 10.0% - 10.5% ] 10.37% | 64,890 | 3.5% |
[ 10.5% - 11.0% ] 10.59% | 114,601 | 5.2% |
[ 10.5% - 11.0% ] 10.85% | 9,431 | 1.6% |
[ 11.0% - 11.5% ] 11.12% | 25,324 | 4.8% |
[ 11.0% - 11.5% ] 11.32% | 201,194 | 3.7% |
[ 11.0% - 11.5% ] 11.49% | 42,619 | 3.3% |
[ 11.5% - 12.0% ] 11.76% | 4,328 | 3.1% |
[ 11.5% - 12.0% ] 11.84% | 32,191 | 3.5% |
[ 12.0% - 12.5% ] 12.15% | 58,064 | 3.6% |
[ 12.0% - 12.5% ] 12.30% | 91,938 | 4.8% |
[ 12.5% - 13.0% ] 12.84% | 126,256 | 4.6% |
[ 13.0% - 13.5% ] 13.01% | 85,124 | 4.6% |
[ 13.0% - 13.5% ] 13.19% | 74,842 | 6.2% |
[ 13.0% - 13.5% ] 13.40% | 120,534 | 4.4% |
[ 13.5% - 14.0% ] 13.69% | 22,966 | 2.4% |
[ 13.5% - 14.0% ] 13.80% | 31,411 | 6.9% |
[ 14.0% - 14.5% ] 14.26% | 2,118 | 8.0% |
[ 14.5% - 15.0% ] 14.64% | 87,056 | 2.4% |
[ 14.5% - 15.0% ] 14.97% | 154,449 | 5.2% |
[ 15.0% - 15.5% ] 15.14% | 766 | 1.9% |
[ 15.0% - 15.5% ] 15.36% | 34,625 | 3.1% |
[ 15.5% - 16.0% ] 15.74% | 807 | 9.4% |
[ 16.0% - 16.5% ] 16.32% | 15,127 | 0.57% |
[ 16.0% - 16.5% ] 16.40% | 16,944 | 1.5% |
[ 16.5% - 17.0% ] 16.63% | 6,947 | 5.1% |
[ 17.0% - 17.5% ] 17.32% | 6,218 | 1.9% |
[ 17.5% - 18.0% ] 17.85% | 24,325 | 2.1% |
[ 18.5% - 19.0% ] 18.58% | 79,765 | 9.5% |
[ 19.0% - 19.5% ] 19.10% | 9,031 | 9.9% |
[ 19.5% - 20.0% ] 19.59% | 1,751 | 6.2% |
[ 19.5% - 20.0% ] 19.89% | 10,563 | 4.6% |
[ 20.0% - 20.5% ] 20.12% | 18,080 | 3.1% |
[ 20.5% - 21.0% ] 20.62% | 50,387 | 1.6% |
[ 20.5% - 21.0% ] 20.87% | 35,908 | 2.7% |
[ 23.0% - 23.5% ] 23.33% | 14,736 | 4.9% |
[ 25.5% - 26.0% ] 25.98% | 14,367 | 4.6% |