Dominican Disability Age 5 to 17
COMPARE
Dominican
Select to Compare
Disability Age 5 to 17
Dominican Disability Age 5 to 17
6.5%
DISABILITY | AGE 5 TO 17
0.0/ 100
METRIC RATING
324th/ 347
METRIC RANK
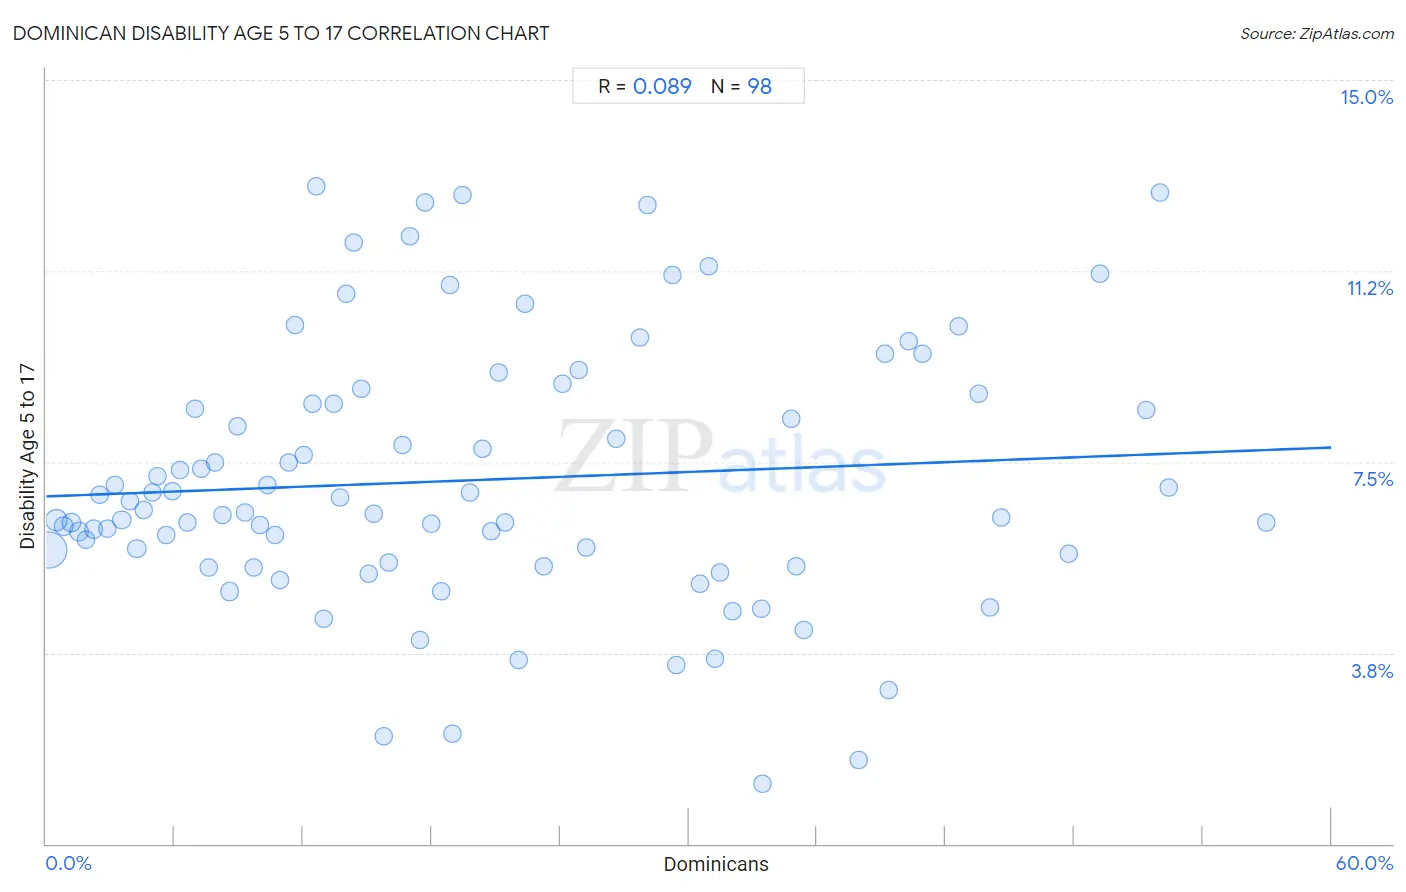
Dominican Disability Age 5 to 17 Correlation Chart
The statistical analysis conducted on geographies consisting of 352,404,408 people shows a slight positive correlation between the proportion of Dominicans and percentage of population with a disability between the ages 5 and 17 in the United States with a correlation coefficient (R) of 0.089 and weighted average of 6.5%. On average, for every 1% (one percent) increase in Dominicans within a typical geography, there is an increase of 0.016% in percentage of population with a disability between the ages 5 and 17.
It is essential to understand that the correlation between the percentage of Dominicans and percentage of population with a disability between the ages 5 and 17 does not imply a direct cause-and-effect relationship. It remains uncertain whether the presence of Dominicans influences an upward or downward trend in the level of percentage of population with a disability between the ages 5 and 17 within an area, or if Dominicans simply ended up residing in those areas with higher or lower levels of percentage of population with a disability between the ages 5 and 17 due to other factors.
Demographics Similar to Dominicans by Disability Age 5 to 17
In terms of disability age 5 to 17, the demographic groups most similar to Dominicans are American (6.5%, a difference of 0.050%), Osage (6.5%, a difference of 0.080%), Slovak (6.5%, a difference of 0.12%), Tohono O'odham (6.5%, a difference of 0.14%), and Potawatomi (6.5%, a difference of 0.19%).
| Demographics | Rating | Rank | Disability Age 5 to 17 |
| Kiowa | 0.0 /100 | #317 | Tragic 6.4% |
| Comanche | 0.0 /100 | #318 | Tragic 6.4% |
| Delaware | 0.0 /100 | #319 | Tragic 6.5% |
| Africans | 0.0 /100 | #320 | Tragic 6.5% |
| Tohono O'odham | 0.0 /100 | #321 | Tragic 6.5% |
| Slovaks | 0.0 /100 | #322 | Tragic 6.5% |
| Osage | 0.0 /100 | #323 | Tragic 6.5% |
| Dominicans | 0.0 /100 | #324 | Tragic 6.5% |
| Americans | 0.0 /100 | #325 | Tragic 6.5% |
| Potawatomi | 0.0 /100 | #326 | Tragic 6.5% |
| French American Indians | 0.0 /100 | #327 | Tragic 6.6% |
| Pennsylvania Germans | 0.0 /100 | #328 | Tragic 6.6% |
| Blackfeet | 0.0 /100 | #329 | Tragic 6.6% |
| Dutch West Indians | 0.0 /100 | #330 | Tragic 6.7% |
| French Canadians | 0.0 /100 | #331 | Tragic 6.7% |
Dominican Disability Age 5 to 17 Correlation Summary
| Measurement | Dominican Data | Disability Age 5 to 17 Data |
| Minimum | 0.11% | 1.2% |
| Maximum | 57.0% | 12.9% |
| Range | 56.9% | 11.7% |
| Mean | 19.9% | 7.1% |
| Median | 16.8% | 6.5% |
| Interquartile 25% (IQ1) | 8.2% | 5.5% |
| Interquartile 75% (IQ3) | 30.5% | 8.7% |
| Interquartile Range (IQR) | 22.3% | 3.1% |
| Standard Deviation (Sample) | 14.4% | 2.6% |
| Standard Deviation (Population) | 14.4% | 2.6% |
Correlation Details
| Dominican Percentile | Sample Size | Disability Age 5 to 17 |
[ 0.0% - 0.5% ] 0.11% | 220,653,068 | 5.8% |
[ 0.0% - 0.5% ] 0.48% | 40,759,285 | 6.4% |
[ 0.5% - 1.0% ] 0.83% | 16,021,037 | 6.2% |
[ 1.0% - 1.5% ] 1.17% | 11,477,886 | 6.3% |
[ 1.5% - 2.0% ] 1.52% | 8,836,234 | 6.1% |
[ 1.5% - 2.0% ] 1.84% | 6,542,044 | 6.0% |
[ 2.0% - 2.5% ] 2.19% | 4,082,456 | 6.2% |
[ 2.5% - 3.0% ] 2.50% | 6,545,928 | 6.8% |
[ 2.5% - 3.0% ] 2.86% | 3,654,539 | 6.2% |
[ 3.0% - 3.5% ] 3.22% | 2,655,078 | 7.1% |
[ 3.5% - 4.0% ] 3.53% | 2,879,795 | 6.4% |
[ 3.5% - 4.0% ] 3.89% | 1,518,393 | 6.7% |
[ 4.0% - 4.5% ] 4.23% | 1,283,740 | 5.8% |
[ 4.5% - 5.0% ] 4.56% | 915,708 | 6.6% |
[ 4.5% - 5.0% ] 4.94% | 875,439 | 6.9% |
[ 5.0% - 5.5% ] 5.21% | 943,868 | 7.2% |
[ 5.5% - 6.0% ] 5.58% | 911,453 | 6.1% |
[ 5.5% - 6.0% ] 5.88% | 1,409,538 | 6.9% |
[ 6.0% - 6.5% ] 6.25% | 525,551 | 7.3% |
[ 6.5% - 7.0% ] 6.61% | 930,207 | 6.3% |
[ 6.5% - 7.0% ] 6.95% | 1,030,133 | 8.5% |
[ 7.0% - 7.5% ] 7.22% | 421,034 | 7.4% |
[ 7.5% - 8.0% ] 7.60% | 492,685 | 5.4% |
[ 7.5% - 8.0% ] 7.89% | 523,864 | 7.5% |
[ 8.0% - 8.5% ] 8.23% | 129,853 | 6.4% |
[ 8.5% - 9.0% ] 8.55% | 8,679,502 | 5.0% |
[ 8.5% - 9.0% ] 8.92% | 142,890 | 8.2% |
[ 9.0% - 9.5% ] 9.26% | 476,935 | 6.5% |
[ 9.5% - 10.0% ] 9.67% | 228,631 | 5.4% |
[ 10.0% - 10.5% ] 10.01% | 216,843 | 6.3% |
[ 10.0% - 10.5% ] 10.35% | 454,546 | 7.0% |
[ 10.5% - 11.0% ] 10.66% | 389,731 | 6.1% |
[ 10.5% - 11.0% ] 10.93% | 143,151 | 5.2% |
[ 11.0% - 11.5% ] 11.30% | 222,335 | 7.5% |
[ 11.5% - 12.0% ] 11.62% | 160,016 | 10.2% |
[ 12.0% - 12.5% ] 12.01% | 179,045 | 7.6% |
[ 12.0% - 12.5% ] 12.44% | 27,996 | 8.6% |
[ 12.5% - 13.0% ] 12.60% | 30,253 | 12.9% |
[ 12.5% - 13.0% ] 12.95% | 148,617 | 4.4% |
[ 13.0% - 13.5% ] 13.40% | 187,039 | 8.7% |
[ 13.5% - 14.0% ] 13.69% | 59,390 | 6.8% |
[ 14.0% - 14.5% ] 14.03% | 240,823 | 10.8% |
[ 14.0% - 14.5% ] 14.38% | 15,121 | 11.8% |
[ 14.5% - 15.0% ] 14.70% | 119,137 | 8.9% |
[ 15.0% - 15.5% ] 15.05% | 261,271 | 5.3% |
[ 15.0% - 15.5% ] 15.30% | 254,656 | 6.5% |
[ 15.5% - 16.0% ] 15.73% | 67,652 | 2.1% |
[ 15.5% - 16.0% ] 15.99% | 176,953 | 5.5% |
[ 16.5% - 17.0% ] 16.66% | 178,216 | 7.8% |
[ 17.0% - 17.5% ] 17.01% | 193,383 | 11.9% |
[ 17.0% - 17.5% ] 17.46% | 46,486 | 4.0% |
[ 17.5% - 18.0% ] 17.70% | 119,400 | 12.6% |
[ 17.5% - 18.0% ] 17.99% | 136,680 | 6.3% |
[ 18.0% - 18.5% ] 18.44% | 27,319 | 5.0% |
[ 18.5% - 19.0% ] 18.83% | 115,936 | 11.0% |
[ 18.5% - 19.0% ] 18.98% | 26,322 | 2.2% |
[ 19.0% - 19.5% ] 19.41% | 79,714 | 12.7% |
[ 19.5% - 20.0% ] 19.78% | 87,444 | 6.9% |
[ 20.0% - 20.5% ] 20.37% | 129,263 | 7.8% |
[ 20.5% - 21.0% ] 20.79% | 190,580 | 6.1% |
[ 21.0% - 21.5% ] 21.15% | 125,036 | 9.3% |
[ 21.0% - 21.5% ] 21.42% | 73,231 | 6.3% |
[ 22.0% - 22.5% ] 22.04% | 11,280 | 3.6% |
[ 22.0% - 22.5% ] 22.35% | 10,649 | 10.6% |
[ 23.0% - 23.5% ] 23.22% | 191,407 | 5.4% |
[ 24.0% - 24.5% ] 24.10% | 2,332 | 9.0% |
[ 24.5% - 25.0% ] 24.86% | 95,009 | 9.3% |
[ 25.0% - 25.5% ] 25.20% | 14,865 | 5.8% |
[ 26.5% - 27.0% ] 26.59% | 149,813 | 8.0% |
[ 27.5% - 28.0% ] 27.71% | 2,021 | 9.9% |
[ 28.0% - 28.5% ] 28.06% | 56,702 | 12.5% |
[ 29.0% - 29.5% ] 29.27% | 59,852 | 11.2% |
[ 29.0% - 29.5% ] 29.40% | 160,705 | 3.5% |
[ 30.0% - 30.5% ] 30.50% | 61,044 | 5.1% |
[ 30.5% - 31.0% ] 30.95% | 79,817 | 11.3% |
[ 31.0% - 31.5% ] 31.23% | 24,572 | 3.6% |
[ 31.0% - 31.5% ] 31.45% | 11,069 | 5.3% |
[ 32.0% - 32.5% ] 32.02% | 11,939 | 4.6% |
[ 33.0% - 33.5% ] 33.36% | 25,674 | 4.6% |
[ 33.0% - 33.5% ] 33.44% | 15,139 | 1.2% |
[ 34.5% - 35.0% ] 34.77% | 82,678 | 8.4% |
[ 35.0% - 35.5% ] 35.00% | 78,624 | 5.5% |
[ 35.0% - 35.5% ] 35.36% | 49,273 | 4.2% |
[ 37.5% - 38.0% ] 37.93% | 18,461 | 1.7% |
[ 39.0% - 39.5% ] 39.15% | 58,136 | 9.6% |
[ 39.0% - 39.5% ] 39.36% | 6,252 | 3.0% |
[ 40.0% - 40.5% ] 40.29% | 111,904 | 9.9% |
[ 40.5% - 41.0% ] 40.92% | 55,226 | 9.6% |
[ 42.5% - 43.0% ] 42.60% | 34,801 | 10.2% |
[ 43.5% - 44.0% ] 43.57% | 60,480 | 8.8% |
[ 44.0% - 44.5% ] 44.09% | 87,063 | 4.6% |
[ 44.5% - 45.0% ] 44.59% | 32,860 | 6.4% |
[ 47.5% - 48.0% ] 47.73% | 81,397 | 5.7% |
[ 49.0% - 49.5% ] 49.23% | 41,570 | 11.2% |
[ 51.0% - 51.5% ] 51.35% | 43,653 | 8.5% |
[ 51.5% - 52.0% ] 52.00% | 6,977 | 12.8% |
[ 52.0% - 52.5% ] 52.39% | 88,067 | 7.0% |
[ 56.5% - 57.0% ] 56.99% | 52,738 | 6.3% |