Immigrants from Trinidad and Tobago Disability Age 5 to 17
COMPARE
Immigrants from Trinidad and Tobago
Select to Compare
Disability Age 5 to 17
Immigrants from Trinidad and Tobago Disability Age 5 to 17
5.6%
DISABILITY | AGE 5 TO 17
47.6/ 100
METRIC RATING
178th/ 347
METRIC RANK
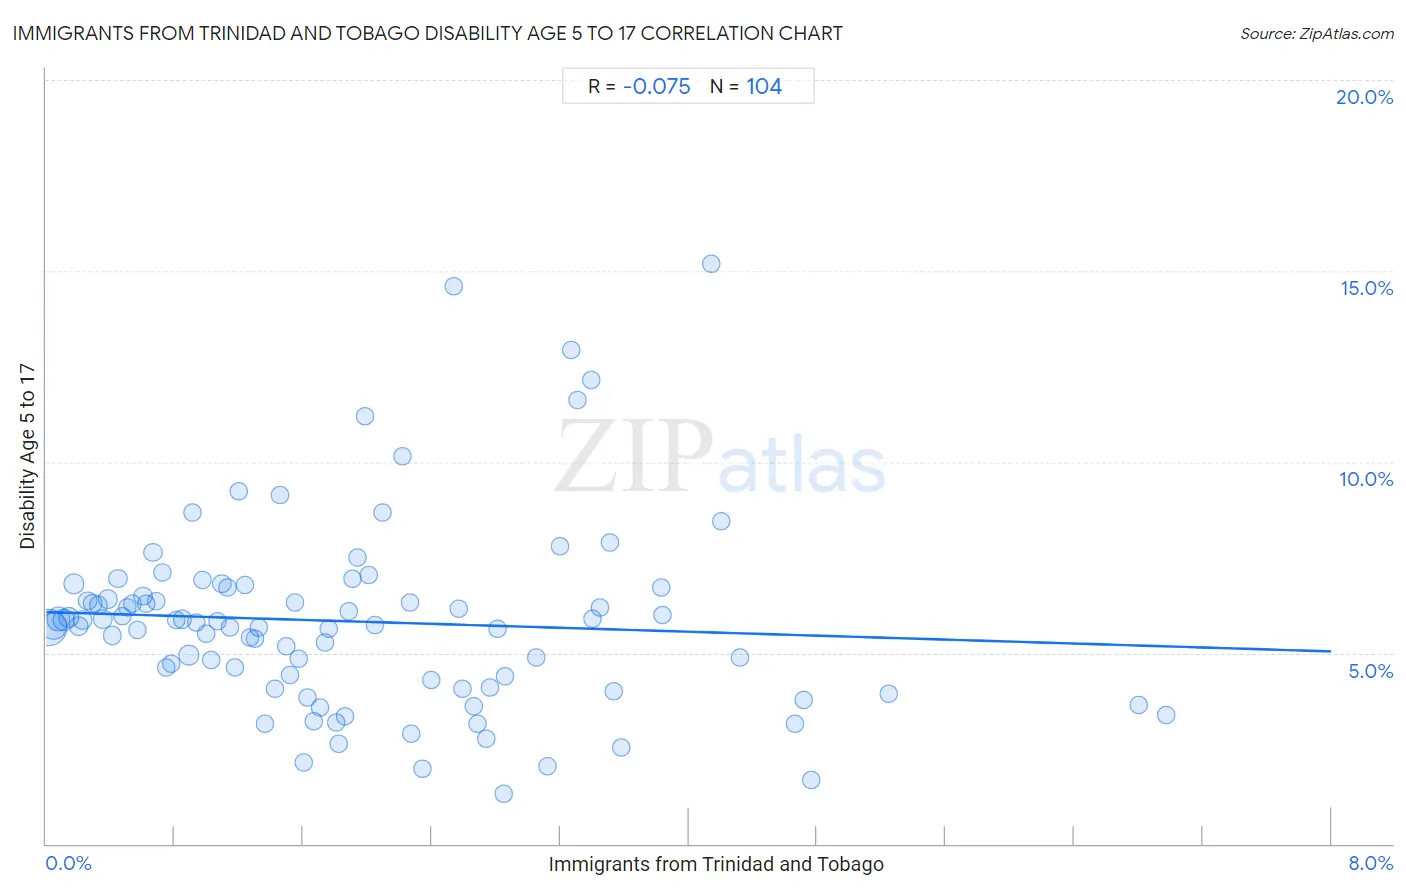
Immigrants from Trinidad and Tobago Disability Age 5 to 17 Correlation Chart
The statistical analysis conducted on geographies consisting of 222,636,548 people shows a slight negative correlation between the proportion of Immigrants from Trinidad and Tobago and percentage of population with a disability between the ages 5 and 17 in the United States with a correlation coefficient (R) of -0.075 and weighted average of 5.6%. On average, for every 1% (one percent) increase in Immigrants from Trinidad and Tobago within a typical geography, there is a decrease of 0.13% in percentage of population with a disability between the ages 5 and 17.
It is essential to understand that the correlation between the percentage of Immigrants from Trinidad and Tobago and percentage of population with a disability between the ages 5 and 17 does not imply a direct cause-and-effect relationship. It remains uncertain whether the presence of Immigrants from Trinidad and Tobago influences an upward or downward trend in the level of percentage of population with a disability between the ages 5 and 17 within an area, or if Immigrants from Trinidad and Tobago simply ended up residing in those areas with higher or lower levels of percentage of population with a disability between the ages 5 and 17 due to other factors.
Demographics Similar to Immigrants from Trinidad and Tobago by Disability Age 5 to 17
In terms of disability age 5 to 17, the demographic groups most similar to Immigrants from Trinidad and Tobago are Immigrants from Western Europe (5.6%, a difference of 0.010%), Shoshone (5.6%, a difference of 0.090%), Immigrants from Central America (5.6%, a difference of 0.090%), Costa Rican (5.6%, a difference of 0.12%), and Uruguayan (5.6%, a difference of 0.17%).
| Demographics | Rating | Rank | Disability Age 5 to 17 |
| Immigrants from Iraq | 53.9 /100 | #171 | Average 5.6% |
| Ukrainians | 51.5 /100 | #172 | Average 5.6% |
| Uruguayans | 51.0 /100 | #173 | Average 5.6% |
| Costa Ricans | 50.0 /100 | #174 | Average 5.6% |
| Shoshone | 49.4 /100 | #175 | Average 5.6% |
| Immigrants from Central America | 49.4 /100 | #176 | Average 5.6% |
| Immigrants from Western Europe | 47.8 /100 | #177 | Average 5.6% |
| Immigrants from Trinidad and Tobago | 47.6 /100 | #178 | Average 5.6% |
| Immigrants from Barbados | 40.5 /100 | #179 | Average 5.6% |
| Immigrants from Uruguay | 37.7 /100 | #180 | Fair 5.6% |
| Immigrants from England | 36.4 /100 | #181 | Fair 5.6% |
| Mexican American Indians | 35.2 /100 | #182 | Fair 5.6% |
| Immigrants from Latin America | 34.3 /100 | #183 | Fair 5.6% |
| Syrians | 33.8 /100 | #184 | Fair 5.6% |
| Immigrants from Mexico | 33.7 /100 | #185 | Fair 5.6% |
Immigrants from Trinidad and Tobago Disability Age 5 to 17 Correlation Summary
| Measurement | Immigrants from Trinidad and Tobago Data | Disability Age 5 to 17 Data |
| Minimum | 0.016% | 1.3% |
| Maximum | 7.0% | 15.2% |
| Range | 7.0% | 13.9% |
| Mean | 1.9% | 5.8% |
| Median | 1.6% | 5.8% |
| Interquartile 25% (IQ1) | 0.80% | 4.2% |
| Interquartile 75% (IQ3) | 2.8% | 6.6% |
| Interquartile Range (IQR) | 2.0% | 2.4% |
| Standard Deviation (Sample) | 1.4% | 2.5% |
| Standard Deviation (Population) | 1.4% | 2.5% |
Correlation Details
| Immigrants from Trinidad and Tobago Percentile | Sample Size | Disability Age 5 to 17 |
[ 0.0% - 0.5% ] 0.016% | 75,502,258 | 5.7% |
[ 0.0% - 0.5% ] 0.045% | 36,349,709 | 5.7% |
[ 0.0% - 0.5% ] 0.075% | 23,428,982 | 5.9% |
[ 0.0% - 0.5% ] 0.11% | 15,345,139 | 5.9% |
[ 0.0% - 0.5% ] 0.14% | 10,169,140 | 5.9% |
[ 0.0% - 0.5% ] 0.17% | 9,318,761 | 6.8% |
[ 0.0% - 0.5% ] 0.20% | 5,440,574 | 5.7% |
[ 0.0% - 0.5% ] 0.23% | 4,935,797 | 5.9% |
[ 0.0% - 0.5% ] 0.26% | 3,723,846 | 6.4% |
[ 0.0% - 0.5% ] 0.29% | 3,174,601 | 6.3% |
[ 0.0% - 0.5% ] 0.32% | 2,873,261 | 6.2% |
[ 0.0% - 0.5% ] 0.35% | 2,667,002 | 5.9% |
[ 0.0% - 0.5% ] 0.38% | 2,142,348 | 6.4% |
[ 0.0% - 0.5% ] 0.41% | 1,748,239 | 5.5% |
[ 0.0% - 0.5% ] 0.45% | 1,799,912 | 6.9% |
[ 0.0% - 0.5% ] 0.47% | 993,631 | 6.0% |
[ 0.5% - 1.0% ] 0.51% | 1,253,972 | 6.2% |
[ 0.5% - 1.0% ] 0.54% | 1,356,536 | 6.3% |
[ 0.5% - 1.0% ] 0.57% | 622,366 | 5.6% |
[ 0.5% - 1.0% ] 0.60% | 634,474 | 6.5% |
[ 0.5% - 1.0% ] 0.63% | 568,581 | 6.3% |
[ 0.5% - 1.0% ] 0.66% | 1,006,154 | 7.6% |
[ 0.5% - 1.0% ] 0.69% | 522,134 | 6.4% |
[ 0.5% - 1.0% ] 0.72% | 290,777 | 7.1% |
[ 0.5% - 1.0% ] 0.75% | 206,549 | 4.6% |
[ 0.5% - 1.0% ] 0.78% | 431,784 | 4.7% |
[ 0.5% - 1.0% ] 0.81% | 377,263 | 5.9% |
[ 0.5% - 1.0% ] 0.85% | 779,599 | 5.9% |
[ 0.5% - 1.0% ] 0.89% | 9,102,946 | 4.9% |
[ 0.5% - 1.0% ] 0.91% | 253,348 | 8.7% |
[ 0.5% - 1.0% ] 0.94% | 145,228 | 5.8% |
[ 0.5% - 1.0% ] 0.97% | 200,834 | 6.9% |
[ 0.5% - 1.0% ] 1.00% | 250,733 | 5.5% |
[ 1.0% - 1.5% ] 1.02% | 271,131 | 4.8% |
[ 1.0% - 1.5% ] 1.06% | 127,985 | 5.8% |
[ 1.0% - 1.5% ] 1.09% | 295,756 | 6.8% |
[ 1.0% - 1.5% ] 1.13% | 114,448 | 6.7% |
[ 1.0% - 1.5% ] 1.14% | 104,411 | 5.7% |
[ 1.0% - 1.5% ] 1.18% | 265,291 | 4.6% |
[ 1.0% - 1.5% ] 1.20% | 70,352 | 9.2% |
[ 1.0% - 1.5% ] 1.24% | 245,567 | 6.8% |
[ 1.0% - 1.5% ] 1.27% | 78,255 | 5.4% |
[ 1.0% - 1.5% ] 1.30% | 259,326 | 5.4% |
[ 1.0% - 1.5% ] 1.32% | 17,251 | 5.6% |
[ 1.0% - 1.5% ] 1.36% | 44,733 | 3.1% |
[ 1.0% - 1.5% ] 1.42% | 110,190 | 4.1% |
[ 1.0% - 1.5% ] 1.45% | 75,816 | 9.1% |
[ 1.0% - 1.5% ] 1.49% | 155,340 | 5.2% |
[ 1.5% - 2.0% ] 1.52% | 28,841 | 4.4% |
[ 1.5% - 2.0% ] 1.55% | 129,494 | 6.3% |
[ 1.5% - 2.0% ] 1.57% | 36,359 | 4.9% |
[ 1.5% - 2.0% ] 1.60% | 100,450 | 2.1% |
[ 1.5% - 2.0% ] 1.63% | 31,200 | 3.8% |
[ 1.5% - 2.0% ] 1.67% | 56,182 | 3.2% |
[ 1.5% - 2.0% ] 1.70% | 47,515 | 3.6% |
[ 1.5% - 2.0% ] 1.73% | 40,484 | 5.3% |
[ 1.5% - 2.0% ] 1.76% | 145,080 | 5.6% |
[ 1.5% - 2.0% ] 1.80% | 20,336 | 3.2% |
[ 1.5% - 2.0% ] 1.82% | 115,966 | 2.6% |
[ 1.5% - 2.0% ] 1.86% | 43,396 | 3.3% |
[ 1.5% - 2.0% ] 1.89% | 10,821 | 6.1% |
[ 1.5% - 2.0% ] 1.90% | 29,348 | 7.0% |
[ 1.5% - 2.0% ] 1.94% | 55,114 | 7.5% |
[ 1.5% - 2.0% ] 1.98% | 55,336 | 11.2% |
[ 2.0% - 2.5% ] 2.01% | 40,738 | 7.0% |
[ 2.0% - 2.5% ] 2.05% | 52,000 | 5.7% |
[ 2.0% - 2.5% ] 2.09% | 47,691 | 8.7% |
[ 2.0% - 2.5% ] 2.22% | 4,100 | 10.2% |
[ 2.0% - 2.5% ] 2.27% | 7,104 | 6.3% |
[ 2.0% - 2.5% ] 2.27% | 18,470 | 2.9% |
[ 2.0% - 2.5% ] 2.34% | 898 | 2.0% |
[ 2.0% - 2.5% ] 2.40% | 61,456 | 4.3% |
[ 2.5% - 3.0% ] 2.54% | 1,538 | 14.6% |
[ 2.5% - 3.0% ] 2.57% | 96,801 | 6.2% |
[ 2.5% - 3.0% ] 2.59% | 189,692 | 4.1% |
[ 2.5% - 3.0% ] 2.66% | 10,526 | 3.6% |
[ 2.5% - 3.0% ] 2.68% | 4,286 | 3.1% |
[ 2.5% - 3.0% ] 2.74% | 108,992 | 2.7% |
[ 2.5% - 3.0% ] 2.77% | 79,458 | 4.1% |
[ 2.5% - 3.0% ] 2.81% | 32,296 | 5.6% |
[ 2.5% - 3.0% ] 2.85% | 6,529 | 1.3% |
[ 2.5% - 3.0% ] 2.86% | 67,242 | 4.4% |
[ 3.0% - 3.5% ] 3.05% | 17,400 | 4.9% |
[ 3.0% - 3.5% ] 3.12% | 83,125 | 2.0% |
[ 3.0% - 3.5% ] 3.20% | 9,011 | 7.8% |
[ 3.0% - 3.5% ] 3.26% | 24,994 | 12.9% |
[ 3.0% - 3.5% ] 3.31% | 1,510 | 11.6% |
[ 3.0% - 3.5% ] 3.39% | 29,820 | 12.1% |
[ 3.0% - 3.5% ] 3.40% | 69,131 | 5.9% |
[ 3.0% - 3.5% ] 3.45% | 55,143 | 6.2% |
[ 3.5% - 4.0% ] 3.51% | 84,006 | 7.9% |
[ 3.5% - 4.0% ] 3.53% | 27,845 | 4.0% |
[ 3.5% - 4.0% ] 3.58% | 100,082 | 2.5% |
[ 3.5% - 4.0% ] 3.83% | 58,396 | 6.7% |
[ 3.5% - 4.0% ] 3.84% | 5,938 | 6.0% |
[ 4.0% - 4.5% ] 4.14% | 8,260 | 15.2% |
[ 4.0% - 4.5% ] 4.20% | 8,779 | 8.5% |
[ 4.0% - 4.5% ] 4.32% | 21,349 | 4.9% |
[ 4.5% - 5.0% ] 4.66% | 63,426 | 3.1% |
[ 4.5% - 5.0% ] 4.72% | 101,053 | 3.8% |
[ 4.5% - 5.0% ] 4.77% | 2,980 | 1.7% |
[ 5.0% - 5.5% ] 5.24% | 58,476 | 3.9% |
[ 6.5% - 7.0% ] 6.80% | 99,249 | 3.6% |
[ 6.5% - 7.0% ] 6.98% | 78,506 | 3.4% |