West Indian Disability Age 5 to 17

COMPARE

West Indian
Race
Ancestry
AfghanAfricanAlaska NativeAlaskan AthabascanAlbanianAleutAlsatianAmericanApacheArabArapahoArgentineanArmenianAssyrian/Chaldean/SyriacAustralianAustrianBahamianBangladeshiBarbadianBasqueBelgianBelizeanBermudanBhutaneseBlackfeetBolivianBrazilianBritishBritish West IndianBulgarianBurmeseCajunCambodianCanadianCape VerdeanCarpatho RusynCelticCentral AmericanCentral American IndianCherokeeCheyenneChickasawChileanChineseChippewaChoctawColombianColvilleComancheCosta RicanCreeCreekCroatianCrowCubanCypriotCzechCzechoslovakianDanishDelawareDominicanDutchDutch West IndianEastern EuropeanEcuadorianEgyptianEnglishEstonianEthiopianEuropeanFijianFilipinoFinnishFrenchFrench American IndianFrench CanadianGermanGerman RussianGhanaianGreekGuamanian/ChamorroGuatemalanGuyaneseHaitianHmongHonduranHopiHoumaHungarianIcelanderIndian (Asian)IndonesianInupiatIranianIraqiIrishIroquoisIsraeliItalianJamaicanJapaneseJordanianKenyanKiowaKoreanLaotianLatvianLebaneseLiberianLithuanianLumbeeLuxembourgerMacedonianMalaysianMalteseMarshalleseMenomineeMexicanMexican American IndianMongolianMoroccanNative HawaiianNavajoNepaleseNew ZealanderNicaraguanNigerianNorthern EuropeanNorwegianOkinawanOsageOttawaPaiutePakistaniPalestinianPanamanianParaguayanPennsylvania GermanPeruvianPimaPolishPortuguesePotawatomiPuebloPuerto RicanPuget Sound SalishRomanianRussianSalvadoranSamoanScandinavianScotch-IrishScottishSeminoleSenegaleseSerbianShoshoneSierra LeoneanSiouxSlavicSlovakSloveneSomaliSouth AfricanSouth AmericanSouth American IndianSoviet UnionSpaniardSpanishSpanish AmericanSpanish American IndianSri LankanSubsaharan AfricanSudaneseSwedishSwissSyrianTaiwaneseThaiTlingit-HaidaTohono O'OdhamTonganTrinidadian and TobagonianTsimshianTurkishU.S. Virgin IslanderUgandanUkrainianUruguayanUteVenezuelanVietnameseWelshWest IndianYakamaYaquiYugoslavianYumanYup'ikZimbabwean
Immigration
NonimmigrantsImmigrantsAfghanistanAfricaAlbaniaArgentinaArmeniaAsiaAustraliaAustriaBahamasBangladeshBarbadosBelarusBelgiumBelizeBoliviaBosnia and HerzegovinaBrazilBulgariaBurma/MyanmarCabo VerdeCambodiaCameroonCanadaCaribbeanCentral AmericaChileChinaColombiaCongoCosta RicaCroatiaCubaCzechoslovakiaDenmarkDominicaDominican RepublicEastern AfricaEastern AsiaEastern EuropeEcuadorEgyptEl SalvadorEnglandEritreaEthiopiaEuropeFijiFranceGermanyGhanaGreeceGrenadaGuatemalaGuyanaHaitiHondurasHong KongHungaryIndiaIndonesiaIranIraqIrelandIsraelItalyJamaicaJapanJordanKazakhstanKenyaKoreaKuwaitLaosLatin AmericaLatviaLebanonLiberiaLithuaniaMalaysiaMexicoMicronesiaMiddle AfricaMoldovaMoroccoNepalNetherlandsNicaraguaNigeriaNorth AmericaNorth MacedoniaNorthern AfricaNorthern EuropeNorwayOceaniaPakistanPanamaPeruPhilippinesPolandPortugalRomaniaRussiaSaudi ArabiaScotlandSenegalSerbiaSierra LeoneSingaporeSomaliaSouth AfricaSouth AmericaSouth Central AsiaSouth Eastern AsiaSouthern EuropeSpainSri LankaSt. Vincent and the GrenadinesSudanSwedenSwitzerlandSyriaTaiwanThailandTrinidad and TobagoTurkeyUgandaUkraineUruguayUzbekistanVenezuelaVietnamWest IndiesWestern AfricaWestern AsiaWestern EuropeYemenZaireZimbabweAzores
Select to Compare
Race
Ancestry
AfghanAfricanAlaska NativeAlaskan AthabascanAlbanianAleutAlsatianAmericanApacheArabArapahoArgentineanArmenianAssyrian/Chaldean/SyriacAustralianAustrianBahamianBangladeshiBarbadianBasqueBelgianBelizeanBermudanBhutaneseBlackfeetBolivianBrazilianBritishBritish West IndianBulgarianBurmeseCajunCambodianCanadianCape VerdeanCarpatho RusynCelticCentral AmericanCentral American IndianCherokeeCheyenneChickasawChileanChineseChippewaChoctawColombianColvilleComancheCosta RicanCreeCreekCroatianCrowCubanCypriotCzechCzechoslovakianDanishDelawareDominicanDutchDutch West IndianEastern EuropeanEcuadorianEgyptianEnglishEstonianEthiopianEuropeanFijianFilipinoFinnishFrenchFrench American IndianFrench CanadianGermanGerman RussianGhanaianGreekGuamanian/ChamorroGuatemalanGuyaneseHaitianHmongHonduranHopiHoumaHungarianIcelanderIndian (Asian)IndonesianInupiatIranianIraqiIrishIroquoisIsraeliItalianJamaicanJapaneseJordanianKenyanKiowaKoreanLaotianLatvianLebaneseLiberianLithuanianLumbeeLuxembourgerMacedonianMalaysianMalteseMarshalleseMenomineeMexicanMexican American IndianMongolianMoroccanNative HawaiianNavajoNepaleseNew ZealanderNicaraguanNigerianNorthern EuropeanNorwegianOkinawanOsageOttawaPaiutePakistaniPalestinianPanamanianParaguayanPennsylvania GermanPeruvianPimaPolishPortuguesePotawatomiPuebloPuerto RicanPuget Sound SalishRomanianRussianSalvadoranSamoanScandinavianScotch-IrishScottishSeminoleSenegaleseSerbianShoshoneSierra LeoneanSiouxSlavicSlovakSloveneSomaliSouth AfricanSouth AmericanSouth American IndianSoviet UnionSpaniardSpanishSpanish AmericanSpanish American IndianSri LankanSubsaharan AfricanSudaneseSwedishSwissSyrianTaiwaneseThaiTlingit-HaidaTohono O'OdhamTonganTrinidadian and TobagonianTsimshianTurkishU.S. Virgin IslanderUgandanUkrainianUruguayanUteVenezuelanVietnameseWelshYakamaYaquiYugoslavianYumanYup'ikZimbabwean
Immigration
NonimmigrantsImmigrantsAfghanistanAfricaAlbaniaArgentinaArmeniaAsiaAustraliaAustriaBahamasBangladeshBarbadosBelarusBelgiumBelizeBoliviaBosnia and HerzegovinaBrazilBulgariaBurma/MyanmarCabo VerdeCambodiaCameroonCanadaCaribbeanCentral AmericaChileChinaColombiaCongoCosta RicaCroatiaCubaCzechoslovakiaDenmarkDominicaDominican RepublicEastern AfricaEastern AsiaEastern EuropeEcuadorEgyptEl SalvadorEnglandEritreaEthiopiaEuropeFijiFranceGermanyGhanaGreeceGrenadaGuatemalaGuyanaHaitiHondurasHong KongHungaryIndiaIndonesiaIranIraqIrelandIsraelItalyJamaicaJapanJordanKazakhstanKenyaKoreaKuwaitLaosLatin AmericaLatviaLebanonLiberiaLithuaniaMalaysiaMexicoMicronesiaMiddle AfricaMoldovaMoroccoNepalNetherlandsNicaraguaNigeriaNorth AmericaNorth MacedoniaNorthern AfricaNorthern EuropeNorwayOceaniaPakistanPanamaPeruPhilippinesPolandPortugalRomaniaRussiaSaudi ArabiaScotlandSenegalSerbiaSierra LeoneSingaporeSomaliaSouth AfricaSouth AmericaSouth Central AsiaSouth Eastern AsiaSouthern EuropeSpainSri LankaSt. Vincent and the GrenadinesSudanSwedenSwitzerlandSyriaTaiwanThailandTrinidad and TobagoTurkeyUgandaUkraineUruguayUzbekistanVenezuelaVietnamWest IndiesWestern AfricaWestern AsiaWestern EuropeYemenZaireZimbabweAzores
Disability Age 5 to 17
Income
Poverty
Unemployment
Labor Participation
Family Structure
Vehicle Availability
Education Level
Disability

West Indian Disability Age 5 to 17
Tragic

5.9%
DISABILITY | AGE 5 TO 17
2.4/ 100
METRIC RATING
240th/ 347
METRIC RANK

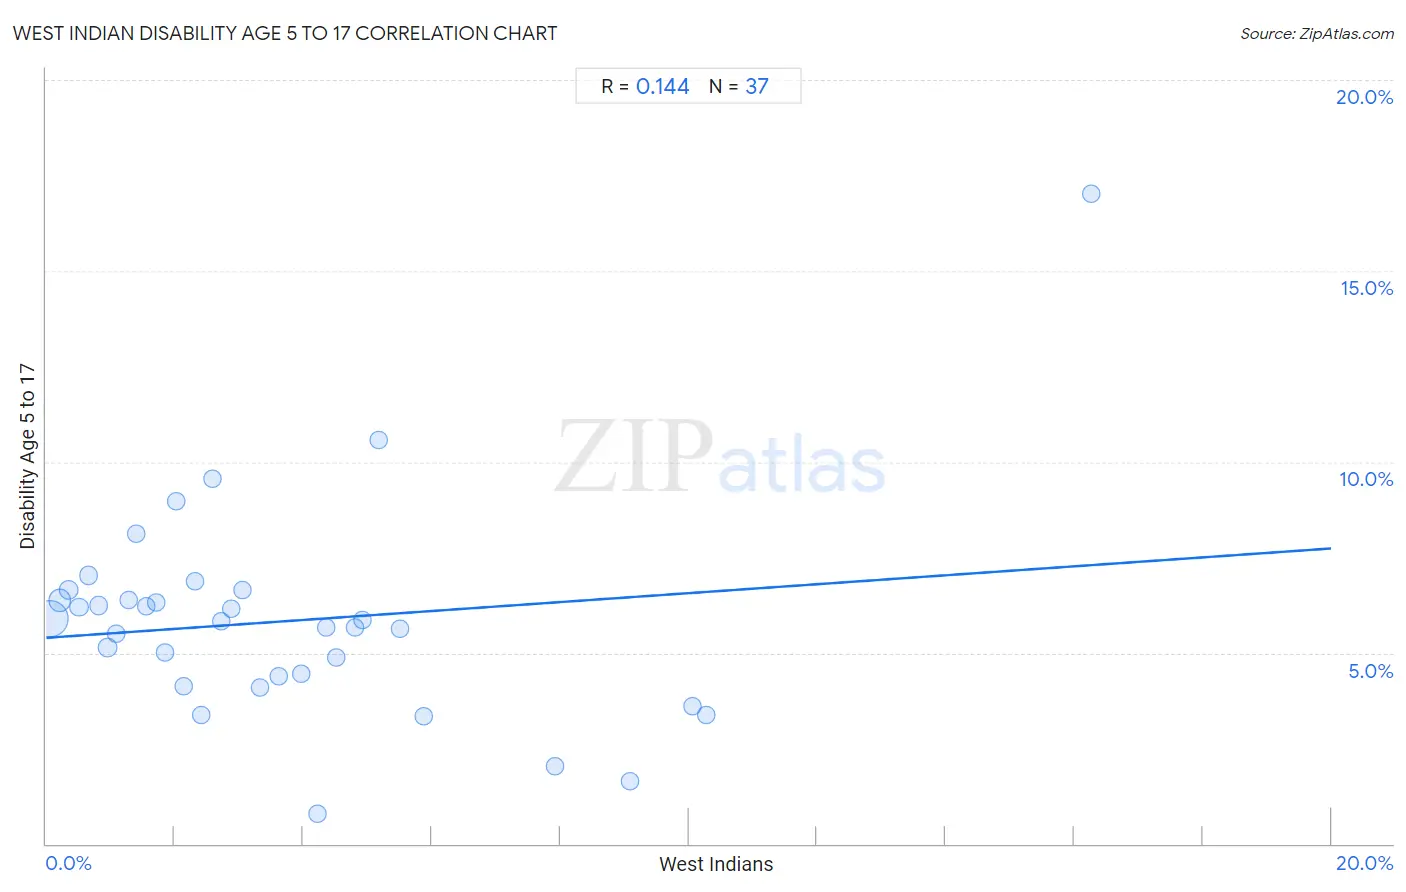
West Indian Disability Age 5 to 17 Correlation Chart

The statistical analysis conducted on geographies consisting of 253,061,388 people shows a poor positive correlation between the proportion of West Indians and percentage of population with a disability between the ages 5 and 17 in the United States with a correlation coefficient (R) of 0.144 and weighted average of 5.9%. On average, for every 1% (one percent) increase in West Indians within a typical geography, there is an increase of 0.12% in percentage of population with a disability between the ages 5 and 17.
West Indian Disability Age 5 to 17
It is essential to understand that the correlation between the percentage of West Indians and percentage of population with a disability between the ages 5 and 17 does not imply a direct cause-and-effect relationship. It remains uncertain whether the presence of West Indians influences an upward or downward trend in the level of percentage of population with a disability between the ages 5 and 17 within an area, or if West Indians simply ended up residing in those areas with higher or lower levels of percentage of population with a disability between the ages 5 and 17 due to other factors.

Demographics Similar to West Indians by Disability Age 5 to 17

In terms of disability age 5 to 17, the demographic groups most similar to West Indians are German Russian (5.9%, a difference of 0.020%), Hungarian (5.8%, a difference of 0.12%), Immigrants from Caribbean (5.9%, a difference of 0.13%), Spaniard (5.9%, a difference of 0.21%), and Sudanese (5.8%, a difference of 0.22%).
DemographicsRating | RankDisability Age 5 to 17
Immigrants from West Indies
3.5
/100
|
#233
Tragic
5.8%
Immigrants from Kenya
3.4
/100
|
#234
Tragic
5.8%
Malaysians
3.4
/100
|
#235
Tragic
5.8%
Immigrants from Brazil
3.2
/100
|
#236
Tragic
5.8%
Sudanese
2.9
/100
|
#237
Tragic
5.8%
Hungarians
2.6
/100
|
#238
Tragic
5.8%
German Russians
2.4
/100
|
#239
Tragic
5.9%
West Indians
2.4
/100
|
#240
Tragic
5.9%
Immigrants from Caribbean
2.1
/100
|
#241
Tragic
5.9%
Spaniards
2.0
/100
|
#242
Tragic
5.9%
Indonesians
2.0
/100
|
#243
Tragic
5.9%
Immigrants from Germany
1.9
/100
|
#244
Tragic
5.9%
Immigrants from Micronesia
1.9
/100
|
#245
Tragic
5.9%
Tlingit-Haida
1.9
/100
|
#246
Tragic
5.9%
Immigrants from Honduras
1.8
/100
|
#247
Tragic
5.9%

West Indian Disability Age 5 to 17 Correlation Summary

MeasurementWest Indian DataDisability Age 5 to 17 Data
Minimum0.054%0.79%
Maximum16.3%17.0%
Range16.2%16.2%
Mean3.7%5.8%
Median2.7%5.8%
Interquartile 25% (IQ1)1.3%4.3%
Interquartile 75% (IQ3)4.9%6.5%
Interquartile Range (IQR)3.5%2.3%
Standard Deviation (Sample)3.4%2.8%
Standard Deviation (Population)3.4%2.7%

Correlation Details

West Indian PercentileSample SizeDisability Age 5 to 17
[
0.0%
-
0.5%
]
0.054%
173,358,7705.9%
[
0.0%
-
0.5%
]
0.21%
39,540,4836.4%
[
0.0%
-
0.5%
]
0.35%
13,061,8156.6%
[
0.5%
-
1.0%
]
0.51%
6,056,0456.2%
[
0.5%
-
1.0%
]
0.66%
4,022,6847.0%
[
0.5%
-
1.0%
]
0.82%
1,994,6776.2%
[
0.5%
-
1.0%
]
0.95%
10,338,3215.1%
[
1.0%
-
1.5%
]
1.09%
1,084,5175.5%
[
1.0%
-
1.5%
]
1.28%
549,3356.4%
[
1.0%
-
1.5%
]
1.41%
294,2658.1%
[
1.5%
-
2.0%
]
1.56%
432,4526.2%
[
1.5%
-
2.0%
]
1.71%
332,3066.3%
[
1.5%
-
2.0%
]
1.85%
177,4735.0%
[
2.0%
-
2.5%
]
2.02%
133,3459.0%
[
2.0%
-
2.5%
]
2.15%
200,2204.1%
[
2.0%
-
2.5%
]
2.32%
141,0736.9%
[
2.0%
-
2.5%
]
2.42%
199,1243.4%
[
2.5%
-
3.0%
]
2.59%
150,4639.6%
[
2.5%
-
3.0%
]
2.73%
283,3665.8%
[
2.5%
-
3.0%
]
2.88%
39,5726.1%
[
3.0%
-
3.5%
]
3.05%
5,3446.6%
[
3.0%
-
3.5%
]
3.32%
189,0614.1%
[
3.5%
-
4.0%
]
3.61%
75,7254.4%
[
3.5%
-
4.0%
]
3.98%
67,4874.4%
[
4.0%
-
4.5%
]
4.21%
6170.79%
[
4.0%
-
4.5%
]
4.36%
7,8635.7%
[
4.5%
-
5.0%
]
4.52%
21,3494.9%
[
4.5%
-
5.0%
]
4.81%
3,1815.7%
[
4.5%
-
5.0%
]
4.91%
3,1145.8%
[
5.0%
-
5.5%
]
5.17%
6,85110.6%
[
5.0%
-
5.5%
]
5.50%
32,2965.6%
[
5.5%
-
6.0%
]
5.88%
85,4253.3%
[
7.5%
-
8.0%
]
7.93%
83,1252.0%
[
9.0%
-
9.5%
]
9.09%
2861.6%
[
10.0%
-
10.5%
]
10.06%
10,5263.6%
[
10.0%
-
10.5%
]
10.27%
78,5063.4%
[
16.0%
-
16.5%
]
16.26%
32617.0%