Immigrants from Indonesia Disability Age 5 to 17

COMPARE

Immigrants from Indonesia
Race
Ancestry
AfghanAfricanAlaska NativeAlaskan AthabascanAlbanianAleutAlsatianAmericanApacheArabArapahoArgentineanArmenianAssyrian/Chaldean/SyriacAustralianAustrianBahamianBangladeshiBarbadianBasqueBelgianBelizeanBermudanBhutaneseBlackfeetBolivianBrazilianBritishBritish West IndianBulgarianBurmeseCajunCambodianCanadianCape VerdeanCarpatho RusynCelticCentral AmericanCentral American IndianCherokeeCheyenneChickasawChileanChineseChippewaChoctawColombianColvilleComancheCosta RicanCreeCreekCroatianCrowCubanCypriotCzechCzechoslovakianDanishDelawareDominicanDutchDutch West IndianEastern EuropeanEcuadorianEgyptianEnglishEstonianEthiopianEuropeanFijianFilipinoFinnishFrenchFrench American IndianFrench CanadianGermanGerman RussianGhanaianGreekGuamanian/ChamorroGuatemalanGuyaneseHaitianHmongHonduranHopiHoumaHungarianIcelanderIndian (Asian)IndonesianInupiatIranianIraqiIrishIroquoisIsraeliItalianJamaicanJapaneseJordanianKenyanKiowaKoreanLaotianLatvianLebaneseLiberianLithuanianLumbeeLuxembourgerMacedonianMalaysianMalteseMarshalleseMenomineeMexicanMexican American IndianMongolianMoroccanNative HawaiianNavajoNepaleseNew ZealanderNicaraguanNigerianNorthern EuropeanNorwegianOkinawanOsageOttawaPaiutePakistaniPalestinianPanamanianParaguayanPennsylvania GermanPeruvianPimaPolishPortuguesePotawatomiPuebloPuerto RicanPuget Sound SalishRomanianRussianSalvadoranSamoanScandinavianScotch-IrishScottishSeminoleSenegaleseSerbianShoshoneSierra LeoneanSiouxSlavicSlovakSloveneSomaliSouth AfricanSouth AmericanSouth American IndianSoviet UnionSpaniardSpanishSpanish AmericanSpanish American IndianSri LankanSubsaharan AfricanSudaneseSwedishSwissSyrianTaiwaneseThaiTlingit-HaidaTohono O'OdhamTonganTrinidadian and TobagonianTsimshianTurkishU.S. Virgin IslanderUgandanUkrainianUruguayanUteVenezuelanVietnameseWelshWest IndianYakamaYaquiYugoslavianYumanYup'ikZimbabwean
Immigration
NonimmigrantsImmigrantsAfghanistanAfricaAlbaniaArgentinaArmeniaAsiaAustraliaAustriaBahamasBangladeshBarbadosBelarusBelgiumBelizeBoliviaBosnia and HerzegovinaBrazilBulgariaBurma/MyanmarCabo VerdeCambodiaCameroonCanadaCaribbeanCentral AmericaChileChinaColombiaCongoCosta RicaCroatiaCubaCzechoslovakiaDenmarkDominicaDominican RepublicEastern AfricaEastern AsiaEastern EuropeEcuadorEgyptEl SalvadorEnglandEritreaEthiopiaEuropeFijiFranceGermanyGhanaGreeceGrenadaGuatemalaGuyanaHaitiHondurasHong KongHungaryIndiaIndonesiaIranIraqIrelandIsraelItalyJamaicaJapanJordanKazakhstanKenyaKoreaKuwaitLaosLatin AmericaLatviaLebanonLiberiaLithuaniaMalaysiaMexicoMicronesiaMiddle AfricaMoldovaMoroccoNepalNetherlandsNicaraguaNigeriaNorth AmericaNorth MacedoniaNorthern AfricaNorthern EuropeNorwayOceaniaPakistanPanamaPeruPhilippinesPolandPortugalRomaniaRussiaSaudi ArabiaScotlandSenegalSerbiaSierra LeoneSingaporeSomaliaSouth AfricaSouth AmericaSouth Central AsiaSouth Eastern AsiaSouthern EuropeSpainSri LankaSt. Vincent and the GrenadinesSudanSwedenSwitzerlandSyriaTaiwanThailandTrinidad and TobagoTurkeyUgandaUkraineUruguayUzbekistanVenezuelaVietnamWest IndiesWestern AfricaWestern AsiaWestern EuropeYemenZaireZimbabweAzores
Select to Compare
Race
Ancestry
AfghanAfricanAlaska NativeAlaskan AthabascanAlbanianAleutAlsatianAmericanApacheArabArapahoArgentineanArmenianAssyrian/Chaldean/SyriacAustralianAustrianBahamianBangladeshiBarbadianBasqueBelgianBelizeanBermudanBhutaneseBlackfeetBolivianBrazilianBritishBritish West IndianBulgarianBurmeseCajunCambodianCanadianCape VerdeanCarpatho RusynCelticCentral AmericanCentral American IndianCherokeeCheyenneChickasawChileanChineseChippewaChoctawColombianColvilleComancheCosta RicanCreeCreekCroatianCrowCubanCypriotCzechCzechoslovakianDanishDelawareDominicanDutchDutch West IndianEastern EuropeanEcuadorianEgyptianEnglishEstonianEthiopianEuropeanFijianFilipinoFinnishFrenchFrench American IndianFrench CanadianGermanGerman RussianGhanaianGreekGuamanian/ChamorroGuatemalanGuyaneseHaitianHmongHonduranHopiHoumaHungarianIcelanderIndian (Asian)IndonesianInupiatIranianIraqiIrishIroquoisIsraeliItalianJamaicanJapaneseJordanianKenyanKiowaKoreanLaotianLatvianLebaneseLiberianLithuanianLumbeeLuxembourgerMacedonianMalaysianMalteseMarshalleseMenomineeMexicanMexican American IndianMongolianMoroccanNative HawaiianNavajoNepaleseNew ZealanderNicaraguanNigerianNorthern EuropeanNorwegianOkinawanOsageOttawaPaiutePakistaniPalestinianPanamanianParaguayanPennsylvania GermanPeruvianPimaPolishPortuguesePotawatomiPuebloPuerto RicanPuget Sound SalishRomanianRussianSalvadoranSamoanScandinavianScotch-IrishScottishSeminoleSenegaleseSerbianShoshoneSierra LeoneanSiouxSlavicSlovakSloveneSomaliSouth AfricanSouth AmericanSouth American IndianSoviet UnionSpaniardSpanishSpanish AmericanSpanish American IndianSri LankanSubsaharan AfricanSudaneseSwedishSwissSyrianTaiwaneseThaiTlingit-HaidaTohono O'OdhamTonganTrinidadian and TobagonianTsimshianTurkishU.S. Virgin IslanderUgandanUkrainianUruguayanUteVenezuelanVietnameseWelshWest IndianYakamaYaquiYugoslavianYumanYup'ikZimbabwean
Immigration
NonimmigrantsImmigrantsAfghanistanAfricaAlbaniaArgentinaArmeniaAsiaAustraliaAustriaBahamasBangladeshBarbadosBelarusBelgiumBelizeBoliviaBosnia and HerzegovinaBrazilBulgariaBurma/MyanmarCabo VerdeCambodiaCameroonCanadaCaribbeanCentral AmericaChileChinaColombiaCongoCosta RicaCroatiaCubaCzechoslovakiaDenmarkDominicaDominican RepublicEastern AfricaEastern AsiaEastern EuropeEcuadorEgyptEl SalvadorEnglandEritreaEthiopiaEuropeFijiFranceGermanyGhanaGreeceGrenadaGuatemalaGuyanaHaitiHondurasHong KongHungaryIndiaIranIraqIrelandIsraelItalyJamaicaJapanJordanKazakhstanKenyaKoreaKuwaitLaosLatin AmericaLatviaLebanonLiberiaLithuaniaMalaysiaMexicoMicronesiaMiddle AfricaMoldovaMoroccoNepalNetherlandsNicaraguaNigeriaNorth AmericaNorth MacedoniaNorthern AfricaNorthern EuropeNorwayOceaniaPakistanPanamaPeruPhilippinesPolandPortugalRomaniaRussiaSaudi ArabiaScotlandSenegalSerbiaSierra LeoneSingaporeSomaliaSouth AfricaSouth AmericaSouth Central AsiaSouth Eastern AsiaSouthern EuropeSpainSri LankaSt. Vincent and the GrenadinesSudanSwedenSwitzerlandSyriaTaiwanThailandTrinidad and TobagoTurkeyUgandaUkraineUruguayUzbekistanVenezuelaVietnamWest IndiesWestern AfricaWestern AsiaWestern EuropeYemenZaireZimbabweAzores
Disability Age 5 to 17
Income
Poverty
Unemployment
Labor Participation
Family Structure
Vehicle Availability
Education Level
Disability

Immigrants from Indonesia Disability Age 5 to 17
Exceptional

5.0%
DISABILITY | AGE 5 TO 17
100.0/ 100
METRIC RATING
33rd/ 347
METRIC RANK

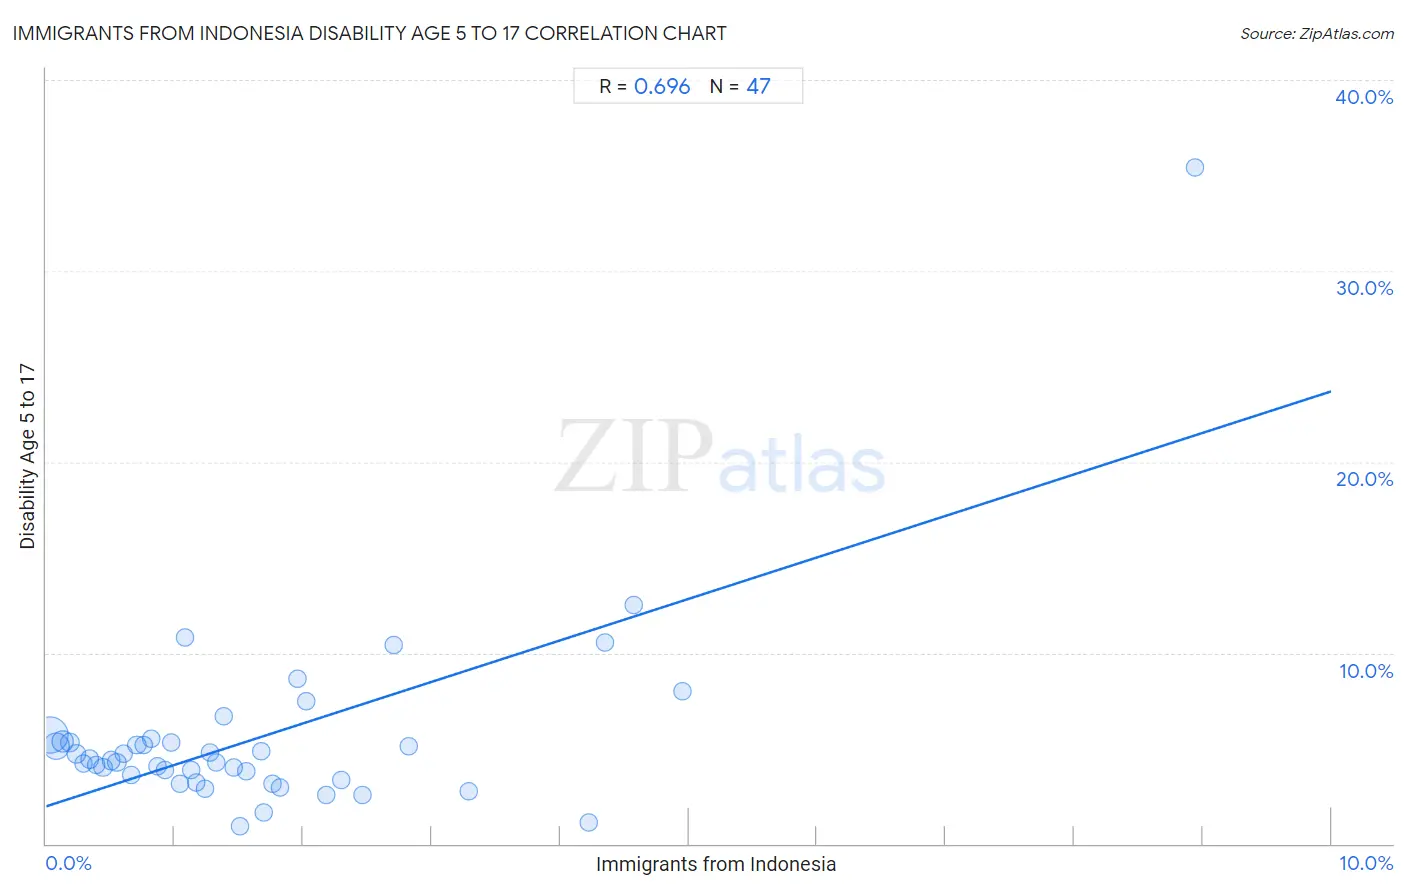
Immigrants from Indonesia Disability Age 5 to 17 Correlation Chart

The statistical analysis conducted on geographies consisting of 214,816,459 people shows a significant positive correlation between the proportion of Immigrants from Indonesia and percentage of population with a disability between the ages 5 and 17 in the United States with a correlation coefficient (R) of 0.696 and weighted average of 5.0%. On average, for every 1% (one percent) increase in Immigrants from Indonesia within a typical geography, there is an increase of 2.2% in percentage of population with a disability between the ages 5 and 17.
Immigrants from Indonesia Disability Age 5 to 17
It is essential to understand that the correlation between the percentage of Immigrants from Indonesia and percentage of population with a disability between the ages 5 and 17 does not imply a direct cause-and-effect relationship. It remains uncertain whether the presence of Immigrants from Indonesia influences an upward or downward trend in the level of percentage of population with a disability between the ages 5 and 17 within an area, or if Immigrants from Indonesia simply ended up residing in those areas with higher or lower levels of percentage of population with a disability between the ages 5 and 17 due to other factors.

Demographics Similar to Immigrants from Indonesia by Disability Age 5 to 17

In terms of disability age 5 to 17, the demographic groups most similar to Immigrants from Indonesia are Israeli (5.0%, a difference of 0.12%), Bolivian (5.0%, a difference of 0.30%), Soviet Union (5.0%, a difference of 0.32%), Immigrants from Egypt (5.0%, a difference of 0.35%), and Immigrants from Pakistan (5.0%, a difference of 0.36%).
DemographicsRating | RankDisability Age 5 to 17
Bhutanese
100.0
/100
|
#26
Exceptional
4.9%
Taiwanese
100.0
/100
|
#27
Exceptional
4.9%
Immigrants from Japan
100.0
/100
|
#28
Exceptional
4.9%
Immigrants from Serbia
100.0
/100
|
#29
Exceptional
4.9%
Immigrants from Malaysia
100.0
/100
|
#30
Exceptional
5.0%
Immigrants from Pakistan
100.0
/100
|
#31
Exceptional
5.0%
Soviet Union
100.0
/100
|
#32
Exceptional
5.0%
Immigrants from Indonesia
100.0
/100
|
#33
Exceptional
5.0%
Israelis
100.0
/100
|
#34
Exceptional
5.0%
Bolivians
100.0
/100
|
#35
Exceptional
5.0%
Immigrants from Egypt
100.0
/100
|
#36
Exceptional
5.0%
Immigrants from Belarus
100.0
/100
|
#37
Exceptional
5.0%
Immigrants from Philippines
100.0
/100
|
#38
Exceptional
5.0%
Immigrants from Argentina
100.0
/100
|
#39
Exceptional
5.0%
Okinawans
100.0
/100
|
#40
Exceptional
5.0%

Immigrants from Indonesia Disability Age 5 to 17 Correlation Summary

MeasurementImmigrants from Indonesia DataDisability Age 5 to 17 Data
Minimum0.025%0.90%
Maximum8.9%35.4%
Range8.9%34.5%
Mean1.6%5.5%
Median1.2%4.4%
Interquartile 25% (IQ1)0.60%3.3%
Interquartile 75% (IQ3)2.0%5.4%
Interquartile Range (IQR)1.4%2.0%
Standard Deviation (Sample)1.6%5.1%
Standard Deviation (Population)1.6%5.0%

Correlation Details

Immigrants from Indonesia PercentileSample SizeDisability Age 5 to 17
[
0.0%
-
0.5%
]
0.025%
113,624,4905.7%
[
0.0%
-
0.5%
]
0.075%
53,659,2025.1%
[
0.0%
-
0.5%
]
0.13%
20,694,3485.4%
[
0.0%
-
0.5%
]
0.18%
8,234,7815.3%
[
0.0%
-
0.5%
]
0.24%
6,156,8674.7%
[
0.0%
-
0.5%
]
0.29%
2,875,6544.2%
[
0.0%
-
0.5%
]
0.34%
3,211,8974.4%
[
0.0%
-
0.5%
]
0.39%
1,359,0074.1%
[
0.0%
-
0.5%
]
0.44%
932,8734.0%
[
0.5%
-
1.0%
]
0.50%
602,2424.4%
[
0.5%
-
1.0%
]
0.55%
666,3684.2%
[
0.5%
-
1.0%
]
0.60%
711,7034.7%
[
0.5%
-
1.0%
]
0.66%
442,8783.6%
[
0.5%
-
1.0%
]
0.71%
302,7375.2%
[
0.5%
-
1.0%
]
0.75%
242,2565.2%
[
0.5%
-
1.0%
]
0.81%
61,6995.5%
[
0.5%
-
1.0%
]
0.86%
206,4184.1%
[
0.5%
-
1.0%
]
0.93%
83,6173.9%
[
0.5%
-
1.0%
]
0.97%
75,1295.3%
[
1.0%
-
1.5%
]
1.04%
25,1743.2%
[
1.0%
-
1.5%
]
1.08%
14,10910.8%
[
1.0%
-
1.5%
]
1.13%
123,6033.9%
[
1.0%
-
1.5%
]
1.17%
59,7953.2%
[
1.0%
-
1.5%
]
1.24%
55,8832.9%
[
1.0%
-
1.5%
]
1.27%
8,4964.8%
[
1.0%
-
1.5%
]
1.32%
107,7754.3%
[
1.0%
-
1.5%
]
1.39%
7226.7%
[
1.0%
-
1.5%
]
1.46%
2,9494.0%
[
1.5%
-
2.0%
]
1.51%
1,4560.90%
[
1.5%
-
2.0%
]
1.56%
10,1373.8%
[
1.5%
-
2.0%
]
1.67%
67,9684.8%
[
1.5%
-
2.0%
]
1.69%
9471.7%
[
1.5%
-
2.0%
]
1.76%
55,3333.1%
[
1.5%
-
2.0%
]
1.82%
2,3682.9%
[
1.5%
-
2.0%
]
1.95%
2058.6%
[
2.0%
-
2.5%
]
2.02%
44,1077.5%
[
2.0%
-
2.5%
]
2.18%
30,2552.5%
[
2.0%
-
2.5%
]
2.29%
6,0663.3%
[
2.0%
-
2.5%
]
2.46%
4,1502.5%
[
2.5%
-
3.0%
]
2.70%
10,62310.4%
[
2.5%
-
3.0%
]
2.82%
12,4785.1%
[
3.0%
-
3.5%
]
3.29%
23,0542.8%
[
4.0%
-
4.5%
]
4.22%
1,1381.1%
[
4.0%
-
4.5%
]
4.35%
1,01210.6%
[
4.5%
-
5.0%
]
4.57%
63412.5%
[
4.5%
-
5.0%
]
4.95%
2228.0%
[
8.5%
-
9.0%
]
8.94%
1,63435.4%