Immigrants from Turkey Disability Age 5 to 17
COMPARE
Immigrants from Turkey
Select to Compare
Disability Age 5 to 17
Immigrants from Turkey Disability Age 5 to 17
5.1%
DISABILITY | AGE 5 TO 17
99.9/ 100
METRIC RATING
56th/ 347
METRIC RANK
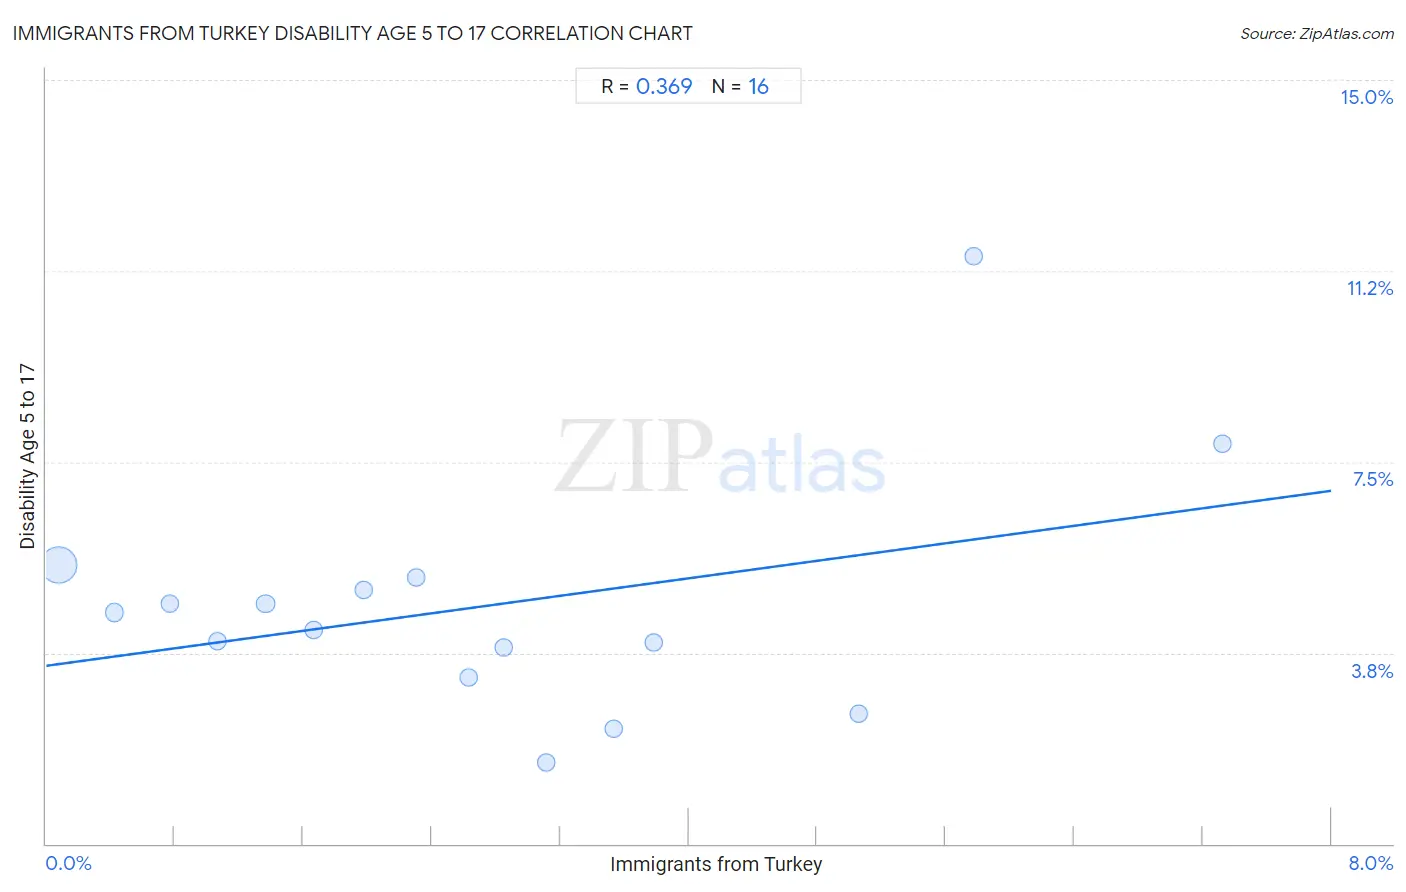
Immigrants from Turkey Disability Age 5 to 17 Correlation Chart
The statistical analysis conducted on geographies consisting of 221,880,411 people shows a mild positive correlation between the proportion of Immigrants from Turkey and percentage of population with a disability between the ages 5 and 17 in the United States with a correlation coefficient (R) of 0.369 and weighted average of 5.1%. On average, for every 1% (one percent) increase in Immigrants from Turkey within a typical geography, there is an increase of 0.43% in percentage of population with a disability between the ages 5 and 17.
It is essential to understand that the correlation between the percentage of Immigrants from Turkey and percentage of population with a disability between the ages 5 and 17 does not imply a direct cause-and-effect relationship. It remains uncertain whether the presence of Immigrants from Turkey influences an upward or downward trend in the level of percentage of population with a disability between the ages 5 and 17 within an area, or if Immigrants from Turkey simply ended up residing in those areas with higher or lower levels of percentage of population with a disability between the ages 5 and 17 due to other factors.
Demographics Similar to Immigrants from Turkey by Disability Age 5 to 17
In terms of disability age 5 to 17, the demographic groups most similar to Immigrants from Turkey are Laotian (5.1%, a difference of 0.010%), Paraguayan (5.1%, a difference of 0.060%), Immigrants from Lithuania (5.1%, a difference of 0.090%), Immigrants from Fiji (5.1%, a difference of 0.14%), and Immigrants from Poland (5.1%, a difference of 0.14%).
| Demographics | Rating | Rank | Disability Age 5 to 17 |
| Immigrants from Western Asia | 100.0 /100 | #49 | Exceptional 5.1% |
| Argentineans | 99.9 /100 | #50 | Exceptional 5.1% |
| Turks | 99.9 /100 | #51 | Exceptional 5.1% |
| Immigrants from Fiji | 99.9 /100 | #52 | Exceptional 5.1% |
| Immigrants from Lithuania | 99.9 /100 | #53 | Exceptional 5.1% |
| Paraguayans | 99.9 /100 | #54 | Exceptional 5.1% |
| Laotians | 99.9 /100 | #55 | Exceptional 5.1% |
| Immigrants from Turkey | 99.9 /100 | #56 | Exceptional 5.1% |
| Immigrants from Poland | 99.9 /100 | #57 | Exceptional 5.1% |
| Immigrants from Ukraine | 99.9 /100 | #58 | Exceptional 5.1% |
| Immigrants from North Macedonia | 99.9 /100 | #59 | Exceptional 5.1% |
| Immigrants from Eastern Europe | 99.9 /100 | #60 | Exceptional 5.1% |
| Immigrants from Switzerland | 99.8 /100 | #61 | Exceptional 5.2% |
| Immigrants from Ireland | 99.8 /100 | #62 | Exceptional 5.2% |
| Immigrants from Bangladesh | 99.8 /100 | #63 | Exceptional 5.2% |
Immigrants from Turkey Disability Age 5 to 17 Correlation Summary
| Measurement | Immigrants from Turkey Data | Disability Age 5 to 17 Data |
| Minimum | 0.074% | 1.6% |
| Maximum | 7.3% | 11.5% |
| Range | 7.2% | 9.9% |
| Mean | 2.7% | 4.7% |
| Median | 2.5% | 4.4% |
| Interquartile 25% (IQ1) | 1.2% | 3.6% |
| Interquartile 75% (IQ3) | 3.7% | 5.1% |
| Interquartile Range (IQR) | 2.4% | 1.5% |
| Standard Deviation (Sample) | 2.0% | 2.3% |
| Standard Deviation (Population) | 1.9% | 2.3% |
Correlation Details
| Immigrants from Turkey Percentile | Sample Size | Disability Age 5 to 17 |
[ 0.0% - 0.5% ] 0.074% | 205,109,933 | 5.5% |
[ 0.0% - 0.5% ] 0.42% | 12,620,770 | 4.6% |
[ 0.5% - 1.0% ] 0.77% | 2,256,645 | 4.7% |
[ 1.0% - 1.5% ] 1.06% | 807,878 | 4.0% |
[ 1.0% - 1.5% ] 1.37% | 283,362 | 4.7% |
[ 1.5% - 2.0% ] 1.67% | 328,762 | 4.2% |
[ 1.5% - 2.0% ] 1.98% | 290,008 | 5.0% |
[ 2.0% - 2.5% ] 2.30% | 57,150 | 5.2% |
[ 2.5% - 3.0% ] 2.63% | 39,711 | 3.3% |
[ 2.5% - 3.0% ] 2.85% | 32,612 | 3.9% |
[ 3.0% - 3.5% ] 3.11% | 5,491 | 1.6% |
[ 3.5% - 4.0% ] 3.53% | 9,765 | 2.3% |
[ 3.5% - 4.0% ] 3.78% | 17,240 | 4.0% |
[ 5.0% - 5.5% ] 5.06% | 4,150 | 2.5% |
[ 5.5% - 6.0% ] 5.78% | 11,458 | 11.5% |
[ 7.0% - 7.5% ] 7.32% | 5,476 | 7.9% |