Tohono O'odham Disability Age 5 to 17

COMPARE

Tohono O'odham
Race
Ancestry
AfghanAfricanAlaska NativeAlaskan AthabascanAlbanianAleutAlsatianAmericanApacheArabArapahoArgentineanArmenianAssyrian/Chaldean/SyriacAustralianAustrianBahamianBangladeshiBarbadianBasqueBelgianBelizeanBermudanBhutaneseBlackfeetBolivianBrazilianBritishBritish West IndianBulgarianBurmeseCajunCambodianCanadianCape VerdeanCarpatho RusynCelticCentral AmericanCentral American IndianCherokeeCheyenneChickasawChileanChineseChippewaChoctawColombianColvilleComancheCosta RicanCreeCreekCroatianCrowCubanCypriotCzechCzechoslovakianDanishDelawareDominicanDutchDutch West IndianEastern EuropeanEcuadorianEgyptianEnglishEstonianEthiopianEuropeanFijianFilipinoFinnishFrenchFrench American IndianFrench CanadianGermanGerman RussianGhanaianGreekGuamanian/ChamorroGuatemalanGuyaneseHaitianHmongHonduranHopiHoumaHungarianIcelanderIndian (Asian)IndonesianInupiatIranianIraqiIrishIroquoisIsraeliItalianJamaicanJapaneseJordanianKenyanKiowaKoreanLaotianLatvianLebaneseLiberianLithuanianLumbeeLuxembourgerMacedonianMalaysianMalteseMarshalleseMenomineeMexicanMexican American IndianMongolianMoroccanNative HawaiianNavajoNepaleseNew ZealanderNicaraguanNigerianNorthern EuropeanNorwegianOkinawanOsageOttawaPaiutePakistaniPalestinianPanamanianParaguayanPennsylvania GermanPeruvianPimaPolishPortuguesePotawatomiPuebloPuerto RicanPuget Sound SalishRomanianRussianSalvadoranSamoanScandinavianScotch-IrishScottishSeminoleSenegaleseSerbianShoshoneSierra LeoneanSiouxSlavicSlovakSloveneSomaliSouth AfricanSouth AmericanSouth American IndianSoviet UnionSpaniardSpanishSpanish AmericanSpanish American IndianSri LankanSubsaharan AfricanSudaneseSwedishSwissSyrianTaiwaneseThaiTlingit-HaidaTohono O'OdhamTonganTrinidadian and TobagonianTsimshianTurkishU.S. Virgin IslanderUgandanUkrainianUruguayanUteVenezuelanVietnameseWelshWest IndianYakamaYaquiYugoslavianYumanYup'ikZimbabwean
Immigration
NonimmigrantsImmigrantsAfghanistanAfricaAlbaniaArgentinaArmeniaAsiaAustraliaAustriaBahamasBangladeshBarbadosBelarusBelgiumBelizeBoliviaBosnia and HerzegovinaBrazilBulgariaBurma/MyanmarCabo VerdeCambodiaCameroonCanadaCaribbeanCentral AmericaChileChinaColombiaCongoCosta RicaCroatiaCubaCzechoslovakiaDenmarkDominicaDominican RepublicEastern AfricaEastern AsiaEastern EuropeEcuadorEgyptEl SalvadorEnglandEritreaEthiopiaEuropeFijiFranceGermanyGhanaGreeceGrenadaGuatemalaGuyanaHaitiHondurasHong KongHungaryIndiaIndonesiaIranIraqIrelandIsraelItalyJamaicaJapanJordanKazakhstanKenyaKoreaKuwaitLaosLatin AmericaLatviaLebanonLiberiaLithuaniaMalaysiaMexicoMicronesiaMiddle AfricaMoldovaMoroccoNepalNetherlandsNicaraguaNigeriaNorth AmericaNorth MacedoniaNorthern AfricaNorthern EuropeNorwayOceaniaPakistanPanamaPeruPhilippinesPolandPortugalRomaniaRussiaSaudi ArabiaScotlandSenegalSerbiaSierra LeoneSingaporeSomaliaSouth AfricaSouth AmericaSouth Central AsiaSouth Eastern AsiaSouthern EuropeSpainSri LankaSt. Vincent and the GrenadinesSudanSwedenSwitzerlandSyriaTaiwanThailandTrinidad and TobagoTurkeyUgandaUkraineUruguayUzbekistanVenezuelaVietnamWest IndiesWestern AfricaWestern AsiaWestern EuropeYemenZaireZimbabweAzores
Select to Compare
Race
Ancestry
AfghanAfricanAlaska NativeAlaskan AthabascanAlbanianAleutAlsatianAmericanApacheArabArapahoArgentineanArmenianAssyrian/Chaldean/SyriacAustralianAustrianBahamianBangladeshiBarbadianBasqueBelgianBelizeanBermudanBhutaneseBlackfeetBolivianBrazilianBritishBritish West IndianBulgarianBurmeseCajunCambodianCanadianCape VerdeanCarpatho RusynCelticCentral AmericanCentral American IndianCherokeeCheyenneChickasawChileanChineseChippewaChoctawColombianColvilleComancheCosta RicanCreeCreekCroatianCrowCubanCypriotCzechCzechoslovakianDanishDelawareDominicanDutchDutch West IndianEastern EuropeanEcuadorianEgyptianEnglishEstonianEthiopianEuropeanFijianFilipinoFinnishFrenchFrench American IndianFrench CanadianGermanGerman RussianGhanaianGreekGuamanian/ChamorroGuatemalanGuyaneseHaitianHmongHonduranHopiHoumaHungarianIcelanderIndian (Asian)IndonesianInupiatIranianIraqiIrishIroquoisIsraeliItalianJamaicanJapaneseJordanianKenyanKiowaKoreanLaotianLatvianLebaneseLiberianLithuanianLumbeeLuxembourgerMacedonianMalaysianMalteseMarshalleseMenomineeMexicanMexican American IndianMongolianMoroccanNative HawaiianNavajoNepaleseNew ZealanderNicaraguanNigerianNorthern EuropeanNorwegianOkinawanOsageOttawaPaiutePakistaniPalestinianPanamanianParaguayanPennsylvania GermanPeruvianPimaPolishPortuguesePotawatomiPuebloPuerto RicanPuget Sound SalishRomanianRussianSalvadoranSamoanScandinavianScotch-IrishScottishSeminoleSenegaleseSerbianShoshoneSierra LeoneanSiouxSlavicSlovakSloveneSomaliSouth AfricanSouth AmericanSouth American IndianSoviet UnionSpaniardSpanishSpanish AmericanSpanish American IndianSri LankanSubsaharan AfricanSudaneseSwedishSwissSyrianTaiwaneseThaiTlingit-HaidaTonganTrinidadian and TobagonianTsimshianTurkishU.S. Virgin IslanderUgandanUkrainianUruguayanUteVenezuelanVietnameseWelshWest IndianYakamaYaquiYugoslavianYumanYup'ikZimbabwean
Immigration
NonimmigrantsImmigrantsAfghanistanAfricaAlbaniaArgentinaArmeniaAsiaAustraliaAustriaBahamasBangladeshBarbadosBelarusBelgiumBelizeBoliviaBosnia and HerzegovinaBrazilBulgariaBurma/MyanmarCabo VerdeCambodiaCameroonCanadaCaribbeanCentral AmericaChileChinaColombiaCongoCosta RicaCroatiaCubaCzechoslovakiaDenmarkDominicaDominican RepublicEastern AfricaEastern AsiaEastern EuropeEcuadorEgyptEl SalvadorEnglandEritreaEthiopiaEuropeFijiFranceGermanyGhanaGreeceGrenadaGuatemalaGuyanaHaitiHondurasHong KongHungaryIndiaIndonesiaIranIraqIrelandIsraelItalyJamaicaJapanJordanKazakhstanKenyaKoreaKuwaitLaosLatin AmericaLatviaLebanonLiberiaLithuaniaMalaysiaMexicoMicronesiaMiddle AfricaMoldovaMoroccoNepalNetherlandsNicaraguaNigeriaNorth AmericaNorth MacedoniaNorthern AfricaNorthern EuropeNorwayOceaniaPakistanPanamaPeruPhilippinesPolandPortugalRomaniaRussiaSaudi ArabiaScotlandSenegalSerbiaSierra LeoneSingaporeSomaliaSouth AfricaSouth AmericaSouth Central AsiaSouth Eastern AsiaSouthern EuropeSpainSri LankaSt. Vincent and the GrenadinesSudanSwedenSwitzerlandSyriaTaiwanThailandTrinidad and TobagoTurkeyUgandaUkraineUruguayUzbekistanVenezuelaVietnamWest IndiesWestern AfricaWestern AsiaWestern EuropeYemenZaireZimbabweAzores
Disability Age 5 to 17
Income
Poverty
Unemployment
Labor Participation
Family Structure
Vehicle Availability
Education Level
Disability

Tohono O'odham Disability Age 5 to 17
Tragic

6.5%
DISABILITY | AGE 5 TO 17
0.0/ 100
METRIC RATING
321st/ 347
METRIC RANK

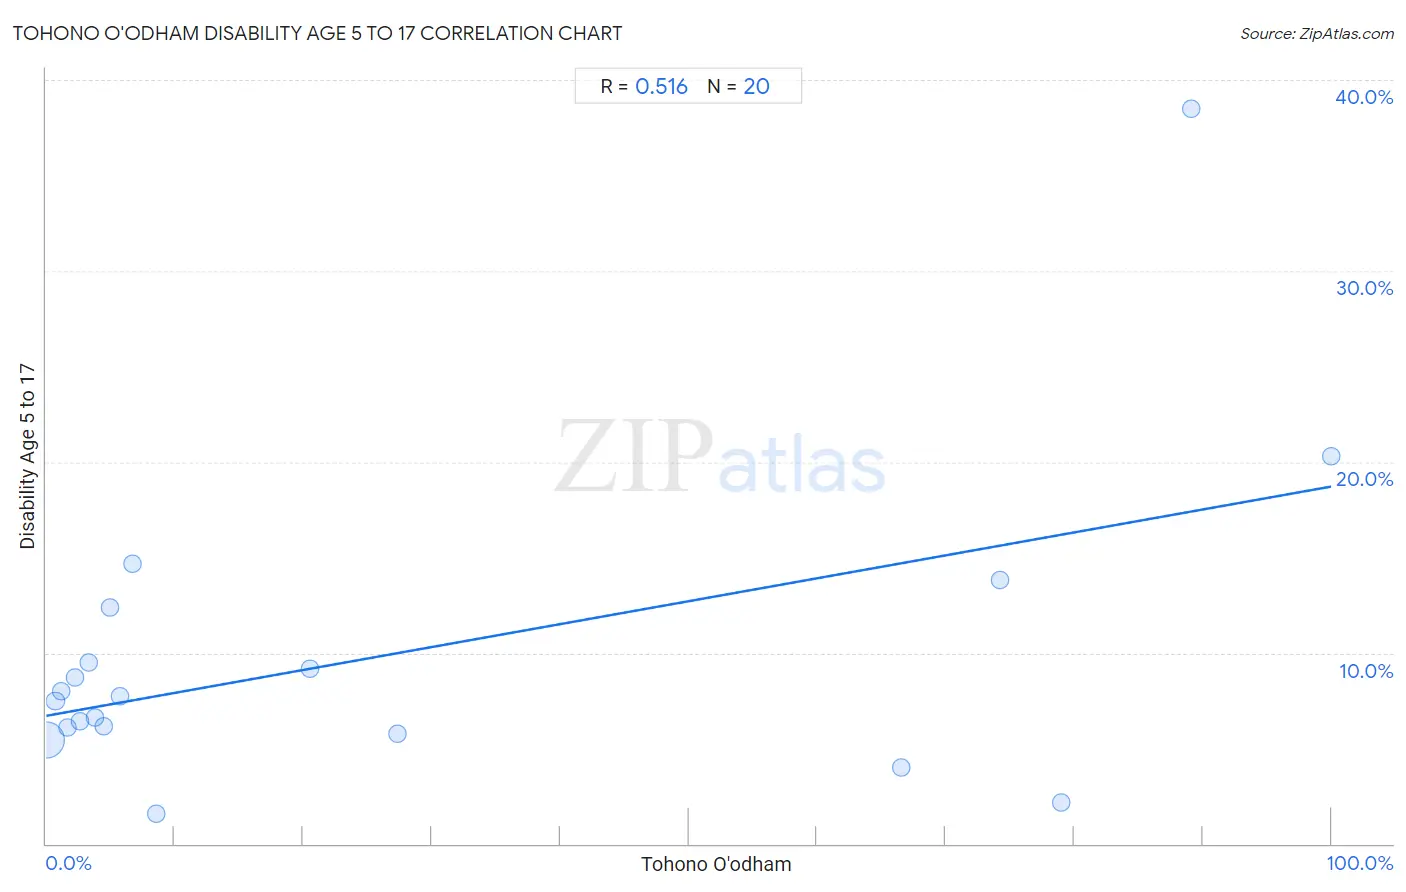
Tohono O'odham Disability Age 5 to 17 Correlation Chart

The statistical analysis conducted on geographies consisting of 58,652,190 people shows a substantial positive correlation between the proportion of Tohono O'odham and percentage of population with a disability between the ages 5 and 17 in the United States with a correlation coefficient (R) of 0.516 and weighted average of 6.5%. On average, for every 1% (one percent) increase in Tohono O'odham within a typical geography, there is an increase of 0.12% in percentage of population with a disability between the ages 5 and 17.
Tohono O'odham Disability Age 5 to 17
It is essential to understand that the correlation between the percentage of Tohono O'odham and percentage of population with a disability between the ages 5 and 17 does not imply a direct cause-and-effect relationship. It remains uncertain whether the presence of Tohono O'odham influences an upward or downward trend in the level of percentage of population with a disability between the ages 5 and 17 within an area, or if Tohono O'odham simply ended up residing in those areas with higher or lower levels of percentage of population with a disability between the ages 5 and 17 due to other factors.

Demographics Similar to Tohono O'odham by Disability Age 5 to 17

In terms of disability age 5 to 17, the demographic groups most similar to Tohono O'odham are Slovak (6.5%, a difference of 0.020%), Osage (6.5%, a difference of 0.060%), Dominican (6.5%, a difference of 0.14%), American (6.5%, a difference of 0.19%), and Potawatomi (6.5%, a difference of 0.32%).
DemographicsRating | RankDisability Age 5 to 17
French
0.0
/100
|
#314
Tragic
6.4%
Immigrants from Portugal
0.0
/100
|
#315
Tragic
6.4%
Immigrants from Dominican Republic
0.0
/100
|
#316
Tragic
6.4%
Kiowa
0.0
/100
|
#317
Tragic
6.4%
Comanche
0.0
/100
|
#318
Tragic
6.4%
Delaware
0.0
/100
|
#319
Tragic
6.5%
Africans
0.0
/100
|
#320
Tragic
6.5%
Tohono O'odham
0.0
/100
|
#321
Tragic
6.5%
Slovaks
0.0
/100
|
#322
Tragic
6.5%
Osage
0.0
/100
|
#323
Tragic
6.5%
Dominicans
0.0
/100
|
#324
Tragic
6.5%
Americans
0.0
/100
|
#325
Tragic
6.5%
Potawatomi
0.0
/100
|
#326
Tragic
6.5%
French American Indians
0.0
/100
|
#327
Tragic
6.6%
Pennsylvania Germans
0.0
/100
|
#328
Tragic
6.6%

Tohono O'odham Disability Age 5 to 17 Correlation Summary

MeasurementTohono O'odham DataDisability Age 5 to 17 Data
Minimum0.034%1.6%
Maximum100.0%38.5%
Range100.0%37.0%
Mean25.1%9.7%
Median5.4%7.6%
Interquartile 25% (IQ1)2.4%5.9%
Interquartile 75% (IQ3)46.9%10.9%
Interquartile Range (IQR)44.5%5.0%
Standard Deviation (Sample)34.7%8.1%
Standard Deviation (Population)33.8%7.9%

Correlation Details

Tohono O'odham PercentileSample SizeDisability Age 5 to 17
[
0.0%
-
0.5%
]
0.034%
56,741,4605.4%
[
0.5%
-
1.0%
]
0.71%
1,352,3247.5%
[
1.0%
-
1.5%
]
1.19%
386,6578.0%
[
1.5%
-
2.0%
]
1.65%
62,8106.1%
[
2.0%
-
2.5%
]
2.20%
8,9898.7%
[
2.5%
-
3.0%
]
2.63%
56,8326.4%
[
3.0%
-
3.5%
]
3.31%
7,0479.5%
[
3.5%
-
4.0%
]
3.81%
1,8356.6%
[
4.0%
-
4.5%
]
4.50%
1,1786.1%
[
4.5%
-
5.0%
]
4.93%
1,82412.4%
[
5.5%
-
6.0%
]
5.77%
5,4247.7%
[
6.5%
-
7.0%
]
6.68%
7,68514.7%
[
8.5%
-
9.0%
]
8.57%
2,4031.6%
[
20.5%
-
21.0%
]
20.52%
3,6219.2%
[
27.0%
-
27.5%
]
27.30%
1,5645.7%
[
66.0%
-
66.5%
]
66.49%
7494.0%
[
74.0%
-
74.5%
]
74.20%
31413.8%
[
78.5%
-
79.0%
]
78.94%
8,4342.2%
[
89.0%
-
89.5%
]
89.12%
88238.5%
[
99.5%
-
100.0%
]
100.00%
15820.3%