Nigerian Disability Age 5 to 17

COMPARE

Nigerian
Race
Ancestry
AfghanAfricanAlaska NativeAlaskan AthabascanAlbanianAleutAlsatianAmericanApacheArabArapahoArgentineanArmenianAssyrian/Chaldean/SyriacAustralianAustrianBahamianBangladeshiBarbadianBasqueBelgianBelizeanBermudanBhutaneseBlackfeetBolivianBrazilianBritishBritish West IndianBulgarianBurmeseCajunCambodianCanadianCape VerdeanCarpatho RusynCelticCentral AmericanCentral American IndianCherokeeCheyenneChickasawChileanChineseChippewaChoctawColombianColvilleComancheCosta RicanCreeCreekCroatianCrowCubanCypriotCzechCzechoslovakianDanishDelawareDominicanDutchDutch West IndianEastern EuropeanEcuadorianEgyptianEnglishEstonianEthiopianEuropeanFijianFilipinoFinnishFrenchFrench American IndianFrench CanadianGermanGerman RussianGhanaianGreekGuamanian/ChamorroGuatemalanGuyaneseHaitianHmongHonduranHopiHoumaHungarianIcelanderIndian (Asian)IndonesianInupiatIranianIraqiIrishIroquoisIsraeliItalianJamaicanJapaneseJordanianKenyanKiowaKoreanLaotianLatvianLebaneseLiberianLithuanianLumbeeLuxembourgerMacedonianMalaysianMalteseMarshalleseMenomineeMexicanMexican American IndianMongolianMoroccanNative HawaiianNavajoNepaleseNew ZealanderNicaraguanNigerianNorthern EuropeanNorwegianOkinawanOsageOttawaPaiutePakistaniPalestinianPanamanianParaguayanPennsylvania GermanPeruvianPimaPolishPortuguesePotawatomiPuebloPuerto RicanPuget Sound SalishRomanianRussianSalvadoranSamoanScandinavianScotch-IrishScottishSeminoleSenegaleseSerbianShoshoneSierra LeoneanSiouxSlavicSlovakSloveneSomaliSouth AfricanSouth AmericanSouth American IndianSoviet UnionSpaniardSpanishSpanish AmericanSpanish American IndianSri LankanSubsaharan AfricanSudaneseSwedishSwissSyrianTaiwaneseThaiTlingit-HaidaTohono O'OdhamTonganTrinidadian and TobagonianTsimshianTurkishU.S. Virgin IslanderUgandanUkrainianUruguayanUteVenezuelanVietnameseWelshWest IndianYakamaYaquiYugoslavianYumanYup'ikZimbabwean
Immigration
NonimmigrantsImmigrantsAfghanistanAfricaAlbaniaArgentinaArmeniaAsiaAustraliaAustriaBahamasBangladeshBarbadosBelarusBelgiumBelizeBoliviaBosnia and HerzegovinaBrazilBulgariaBurma/MyanmarCabo VerdeCambodiaCameroonCanadaCaribbeanCentral AmericaChileChinaColombiaCongoCosta RicaCroatiaCubaCzechoslovakiaDenmarkDominicaDominican RepublicEastern AfricaEastern AsiaEastern EuropeEcuadorEgyptEl SalvadorEnglandEritreaEthiopiaEuropeFijiFranceGermanyGhanaGreeceGrenadaGuatemalaGuyanaHaitiHondurasHong KongHungaryIndiaIndonesiaIranIraqIrelandIsraelItalyJamaicaJapanJordanKazakhstanKenyaKoreaKuwaitLaosLatin AmericaLatviaLebanonLiberiaLithuaniaMalaysiaMexicoMicronesiaMiddle AfricaMoldovaMoroccoNepalNetherlandsNicaraguaNigeriaNorth AmericaNorth MacedoniaNorthern AfricaNorthern EuropeNorwayOceaniaPakistanPanamaPeruPhilippinesPolandPortugalRomaniaRussiaSaudi ArabiaScotlandSenegalSerbiaSierra LeoneSingaporeSomaliaSouth AfricaSouth AmericaSouth Central AsiaSouth Eastern AsiaSouthern EuropeSpainSri LankaSt. Vincent and the GrenadinesSudanSwedenSwitzerlandSyriaTaiwanThailandTrinidad and TobagoTurkeyUgandaUkraineUruguayUzbekistanVenezuelaVietnamWest IndiesWestern AfricaWestern AsiaWestern EuropeYemenZaireZimbabweAzores
Select to Compare
Race
Ancestry
AfghanAfricanAlaska NativeAlaskan AthabascanAlbanianAleutAlsatianAmericanApacheArabArapahoArgentineanArmenianAssyrian/Chaldean/SyriacAustralianAustrianBahamianBangladeshiBarbadianBasqueBelgianBelizeanBermudanBhutaneseBlackfeetBolivianBrazilianBritishBritish West IndianBulgarianBurmeseCajunCambodianCanadianCape VerdeanCarpatho RusynCelticCentral AmericanCentral American IndianCherokeeCheyenneChickasawChileanChineseChippewaChoctawColombianColvilleComancheCosta RicanCreeCreekCroatianCrowCubanCypriotCzechCzechoslovakianDanishDelawareDominicanDutchDutch West IndianEastern EuropeanEcuadorianEgyptianEnglishEstonianEthiopianEuropeanFijianFilipinoFinnishFrenchFrench American IndianFrench CanadianGermanGerman RussianGhanaianGreekGuamanian/ChamorroGuatemalanGuyaneseHaitianHmongHonduranHopiHoumaHungarianIcelanderIndian (Asian)IndonesianInupiatIranianIraqiIrishIroquoisIsraeliItalianJamaicanJapaneseJordanianKenyanKiowaKoreanLaotianLatvianLebaneseLiberianLithuanianLumbeeLuxembourgerMacedonianMalaysianMalteseMarshalleseMenomineeMexicanMexican American IndianMongolianMoroccanNative HawaiianNavajoNepaleseNew ZealanderNicaraguanNorthern EuropeanNorwegianOkinawanOsageOttawaPaiutePakistaniPalestinianPanamanianParaguayanPennsylvania GermanPeruvianPimaPolishPortuguesePotawatomiPuebloPuerto RicanPuget Sound SalishRomanianRussianSalvadoranSamoanScandinavianScotch-IrishScottishSeminoleSenegaleseSerbianShoshoneSierra LeoneanSiouxSlavicSlovakSloveneSomaliSouth AfricanSouth AmericanSouth American IndianSoviet UnionSpaniardSpanishSpanish AmericanSpanish American IndianSri LankanSubsaharan AfricanSudaneseSwedishSwissSyrianTaiwaneseThaiTlingit-HaidaTohono O'OdhamTonganTrinidadian and TobagonianTsimshianTurkishU.S. Virgin IslanderUgandanUkrainianUruguayanUteVenezuelanVietnameseWelshWest IndianYakamaYaquiYugoslavianYumanYup'ikZimbabwean
Immigration
NonimmigrantsImmigrantsAfghanistanAfricaAlbaniaArgentinaArmeniaAsiaAustraliaAustriaBahamasBangladeshBarbadosBelarusBelgiumBelizeBoliviaBosnia and HerzegovinaBrazilBulgariaBurma/MyanmarCabo VerdeCambodiaCameroonCanadaCaribbeanCentral AmericaChileChinaColombiaCongoCosta RicaCroatiaCubaCzechoslovakiaDenmarkDominicaDominican RepublicEastern AfricaEastern AsiaEastern EuropeEcuadorEgyptEl SalvadorEnglandEritreaEthiopiaEuropeFijiFranceGermanyGhanaGreeceGrenadaGuatemalaGuyanaHaitiHondurasHong KongHungaryIndiaIndonesiaIranIraqIrelandIsraelItalyJamaicaJapanJordanKazakhstanKenyaKoreaKuwaitLaosLatin AmericaLatviaLebanonLiberiaLithuaniaMalaysiaMexicoMicronesiaMiddle AfricaMoldovaMoroccoNepalNetherlandsNicaraguaNigeriaNorth AmericaNorth MacedoniaNorthern AfricaNorthern EuropeNorwayOceaniaPakistanPanamaPeruPhilippinesPolandPortugalRomaniaRussiaSaudi ArabiaScotlandSenegalSerbiaSierra LeoneSingaporeSomaliaSouth AfricaSouth AmericaSouth Central AsiaSouth Eastern AsiaSouthern EuropeSpainSri LankaSt. Vincent and the GrenadinesSudanSwedenSwitzerlandSyriaTaiwanThailandTrinidad and TobagoTurkeyUgandaUkraineUruguayUzbekistanVenezuelaVietnamWest IndiesWestern AfricaWestern AsiaWestern EuropeYemenZaireZimbabweAzores
Disability Age 5 to 17
Income
Poverty
Unemployment
Labor Participation
Family Structure
Vehicle Availability
Education Level
Disability

Nigerian Disability Age 5 to 17
Tragic

5.8%
DISABILITY | AGE 5 TO 17
7.5/ 100
METRIC RATING
216th/ 347
METRIC RANK

Nigerian Disability Age 5 to 17 Correlation Chart

The statistical analysis conducted on geographies consisting of 330,899,838 people shows a significant positive correlation between the proportion of Nigerians and percentage of population with a disability between the ages 5 and 17 in the United States with a correlation coefficient (R) of 0.631 and weighted average of 5.8%. On average, for every 1% (one percent) increase in Nigerians within a typical geography, there is an increase of 0.46% in percentage of population with a disability between the ages 5 and 17.
Nigerian Disability Age 5 to 17
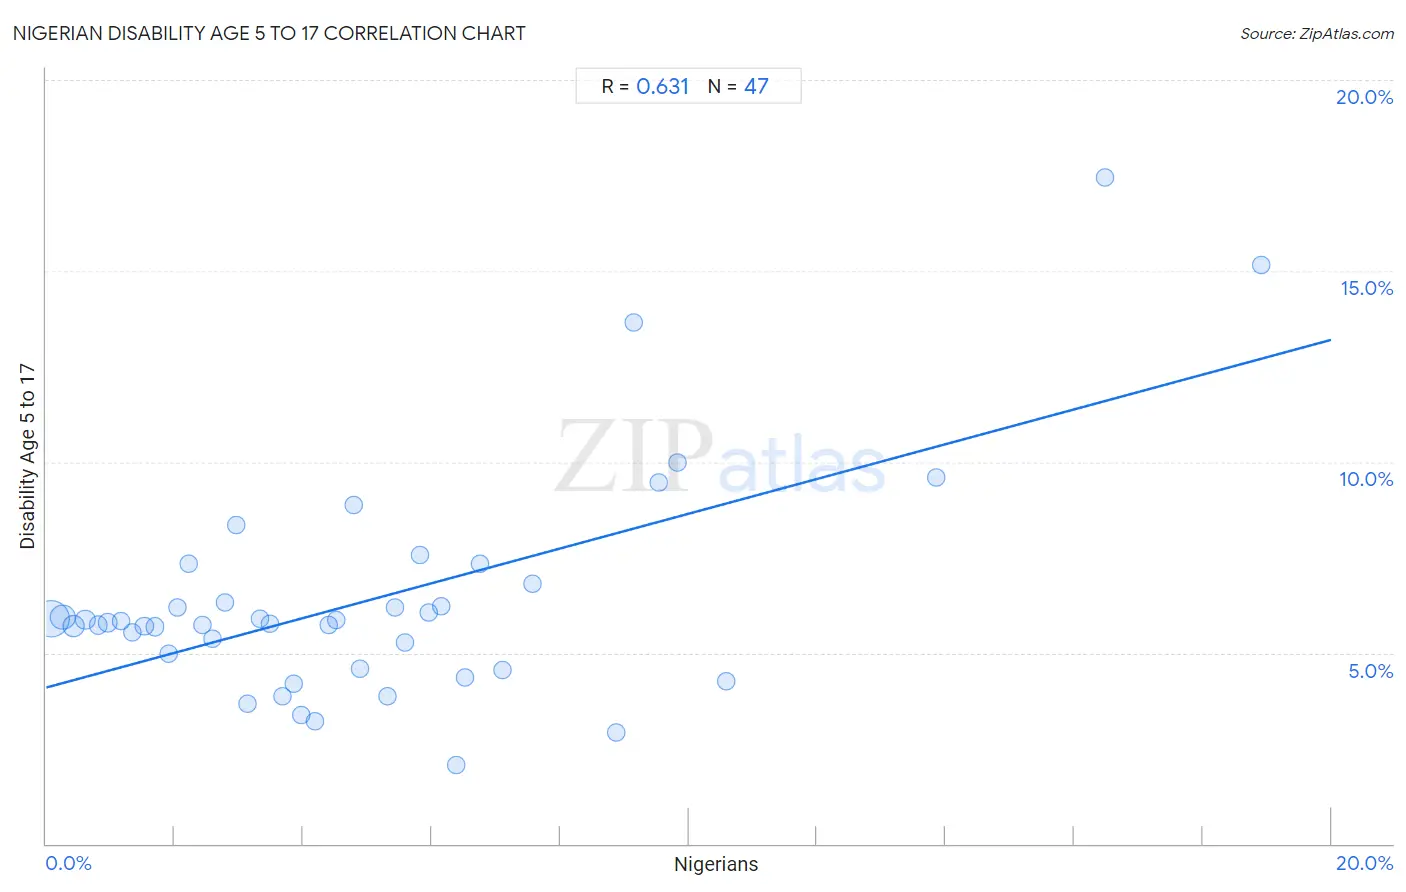
It is essential to understand that the correlation between the percentage of Nigerians and percentage of population with a disability between the ages 5 and 17 does not imply a direct cause-and-effect relationship. It remains uncertain whether the presence of Nigerians influences an upward or downward trend in the level of percentage of population with a disability between the ages 5 and 17 within an area, or if Nigerians simply ended up residing in those areas with higher or lower levels of percentage of population with a disability between the ages 5 and 17 due to other factors.

Demographics Similar to Nigerians by Disability Age 5 to 17

In terms of disability age 5 to 17, the demographic groups most similar to Nigerians are Czech (5.8%, a difference of 0.030%), Immigrants from Sierra Leone (5.8%, a difference of 0.080%), Swedish (5.8%, a difference of 0.090%), Sierra Leonean (5.8%, a difference of 0.090%), and Belgian (5.8%, a difference of 0.10%).
DemographicsRating | RankDisability Age 5 to 17
Immigrants from Uganda
9.7
/100
|
#209
Tragic
5.8%
Immigrants from Haiti
9.5
/100
|
#210
Tragic
5.8%
Yugoslavians
9.1
/100
|
#211
Tragic
5.8%
Immigrants from Panama
8.7
/100
|
#212
Tragic
5.8%
Immigrants from Cameroon
8.3
/100
|
#213
Tragic
5.8%
Immigrants from Morocco
8.3
/100
|
#214
Tragic
5.8%
Swedes
8.1
/100
|
#215
Tragic
5.8%
Nigerians
7.5
/100
|
#216
Tragic
5.8%
Czechs
7.4
/100
|
#217
Tragic
5.8%
Immigrants from Sierra Leone
7.1
/100
|
#218
Tragic
5.8%
Sierra Leoneans
7.0
/100
|
#219
Tragic
5.8%
Belgians
6.9
/100
|
#220
Tragic
5.8%
Lithuanians
6.7
/100
|
#221
Tragic
5.8%
Immigrants from Sudan
6.7
/100
|
#222
Tragic
5.8%
Alsatians
6.0
/100
|
#223
Tragic
5.8%

Nigerian Disability Age 5 to 17 Correlation Summary

MeasurementNigerian DataDisability Age 5 to 17 Data
Minimum0.080%2.1%
Maximum18.9%17.5%
Range18.8%15.4%
Mean5.0%6.4%
Median4.2%5.8%
Interquartile 25% (IQ1)2.0%4.6%
Interquartile 75% (IQ3)6.5%6.8%
Interquartile Range (IQR)4.5%2.2%
Standard Deviation (Sample)4.1%2.9%
Standard Deviation (Population)4.0%2.9%

Correlation Details

Nigerian PercentileSample SizeDisability Age 5 to 17
[
0.0%
-
0.5%
]
0.080%
177,536,3495.9%
[
0.0%
-
0.5%
]
0.25%
65,384,9615.9%
[
0.0%
-
0.5%
]
0.42%
38,581,0585.7%
[
0.5%
-
1.0%
]
0.61%
17,082,2135.9%
[
0.5%
-
1.0%
]
0.81%
9,116,3035.7%
[
0.5%
-
1.0%
]
0.96%
7,706,2865.8%
[
1.0%
-
1.5%
]
1.17%
3,783,4285.8%
[
1.0%
-
1.5%
]
1.34%
2,871,5085.5%
[
1.5%
-
2.0%
]
1.53%
1,283,1225.7%
[
1.5%
-
2.0%
]
1.69%
1,320,7985.7%
[
1.5%
-
2.0%
]
1.90%
811,5605.0%
[
2.0%
-
2.5%
]
2.04%
795,5486.2%
[
2.0%
-
2.5%
]
2.22%
790,0117.3%
[
2.0%
-
2.5%
]
2.43%
584,6445.7%
[
2.5%
-
3.0%
]
2.59%
324,1465.4%
[
2.5%
-
3.0%
]
2.79%
201,0116.3%
[
2.5%
-
3.0%
]
2.95%
289,6598.4%
[
3.0%
-
3.5%
]
3.14%
217,9563.7%
[
3.0%
-
3.5%
]
3.32%
194,1735.9%
[
3.0%
-
3.5%
]
3.49%
202,8245.7%
[
3.5%
-
4.0%
]
3.68%
139,3873.9%
[
3.5%
-
4.0%
]
3.86%
78,3004.2%
[
3.5%
-
4.0%
]
3.98%
184,3873.4%
[
4.0%
-
4.5%
]
4.18%
205,7863.2%
[
4.0%
-
4.5%
]
4.41%
63,8165.7%
[
4.5%
-
5.0%
]
4.50%
92,0985.9%
[
4.5%
-
5.0%
]
4.79%
92,1248.9%
[
4.5%
-
5.0%
]
4.88%
181,3294.6%
[
5.0%
-
5.5%
]
5.31%
42,7673.8%
[
5.0%
-
5.5%
]
5.44%
83,2066.2%
[
5.5%
-
6.0%
]
5.59%
102,4465.3%
[
5.5%
-
6.0%
]
5.82%
69,7317.6%
[
5.5%
-
6.0%
]
5.95%
70,1976.1%
[
6.0%
-
6.5%
]
6.15%
26,1416.2%
[
6.0%
-
6.5%
]
6.37%
8,2052.1%
[
6.5%
-
7.0%
]
6.51%
123,1354.3%
[
6.5%
-
7.0%
]
6.75%
46,9577.3%
[
7.0%
-
7.5%
]
7.10%
3104.5%
[
7.5%
-
8.0%
]
7.56%
55,8766.8%
[
8.5%
-
9.0%
]
8.88%
116,3042.9%
[
9.0%
-
9.5%
]
9.15%
2,35113.6%
[
9.5%
-
10.0%
]
9.54%
12,0489.5%
[
9.5%
-
10.0%
]
9.83%
2,29910.0%
[
10.5%
-
11.0%
]
10.58%
4,3754.2%
[
13.5%
-
14.0%
]
13.85%
13,1929.6%
[
16.0%
-
16.5%
]
16.48%
18217.5%
[
18.5%
-
19.0%
]
18.91%
5,33115.2%