Israeli Disability Age 5 to 17

COMPARE

Israeli
Race
Ancestry
AfghanAfricanAlaska NativeAlaskan AthabascanAlbanianAleutAlsatianAmericanApacheArabArapahoArgentineanArmenianAssyrian/Chaldean/SyriacAustralianAustrianBahamianBangladeshiBarbadianBasqueBelgianBelizeanBermudanBhutaneseBlackfeetBolivianBrazilianBritishBritish West IndianBulgarianBurmeseCajunCambodianCanadianCape VerdeanCarpatho RusynCelticCentral AmericanCentral American IndianCherokeeCheyenneChickasawChileanChineseChippewaChoctawColombianColvilleComancheCosta RicanCreeCreekCroatianCrowCubanCypriotCzechCzechoslovakianDanishDelawareDominicanDutchDutch West IndianEastern EuropeanEcuadorianEgyptianEnglishEstonianEthiopianEuropeanFijianFilipinoFinnishFrenchFrench American IndianFrench CanadianGermanGerman RussianGhanaianGreekGuamanian/ChamorroGuatemalanGuyaneseHaitianHmongHonduranHopiHoumaHungarianIcelanderIndian (Asian)IndonesianInupiatIranianIraqiIrishIroquoisIsraeliItalianJamaicanJapaneseJordanianKenyanKiowaKoreanLaotianLatvianLebaneseLiberianLithuanianLumbeeLuxembourgerMacedonianMalaysianMalteseMarshalleseMenomineeMexicanMexican American IndianMongolianMoroccanNative HawaiianNavajoNepaleseNew ZealanderNicaraguanNigerianNorthern EuropeanNorwegianOkinawanOsageOttawaPaiutePakistaniPalestinianPanamanianParaguayanPennsylvania GermanPeruvianPimaPolishPortuguesePotawatomiPuebloPuerto RicanPuget Sound SalishRomanianRussianSalvadoranSamoanScandinavianScotch-IrishScottishSeminoleSenegaleseSerbianShoshoneSierra LeoneanSiouxSlavicSlovakSloveneSomaliSouth AfricanSouth AmericanSouth American IndianSoviet UnionSpaniardSpanishSpanish AmericanSpanish American IndianSri LankanSubsaharan AfricanSudaneseSwedishSwissSyrianTaiwaneseThaiTlingit-HaidaTohono O'OdhamTonganTrinidadian and TobagonianTsimshianTurkishU.S. Virgin IslanderUgandanUkrainianUruguayanUteVenezuelanVietnameseWelshWest IndianYakamaYaquiYugoslavianYumanYup'ikZimbabwean
Immigration
NonimmigrantsImmigrantsAfghanistanAfricaAlbaniaArgentinaArmeniaAsiaAustraliaAustriaBahamasBangladeshBarbadosBelarusBelgiumBelizeBoliviaBosnia and HerzegovinaBrazilBulgariaBurma/MyanmarCabo VerdeCambodiaCameroonCanadaCaribbeanCentral AmericaChileChinaColombiaCongoCosta RicaCroatiaCubaCzechoslovakiaDenmarkDominicaDominican RepublicEastern AfricaEastern AsiaEastern EuropeEcuadorEgyptEl SalvadorEnglandEritreaEthiopiaEuropeFijiFranceGermanyGhanaGreeceGrenadaGuatemalaGuyanaHaitiHondurasHong KongHungaryIndiaIndonesiaIranIraqIrelandIsraelItalyJamaicaJapanJordanKazakhstanKenyaKoreaKuwaitLaosLatin AmericaLatviaLebanonLiberiaLithuaniaMalaysiaMexicoMicronesiaMiddle AfricaMoldovaMoroccoNepalNetherlandsNicaraguaNigeriaNorth AmericaNorth MacedoniaNorthern AfricaNorthern EuropeNorwayOceaniaPakistanPanamaPeruPhilippinesPolandPortugalRomaniaRussiaSaudi ArabiaScotlandSenegalSerbiaSierra LeoneSingaporeSomaliaSouth AfricaSouth AmericaSouth Central AsiaSouth Eastern AsiaSouthern EuropeSpainSri LankaSt. Vincent and the GrenadinesSudanSwedenSwitzerlandSyriaTaiwanThailandTrinidad and TobagoTurkeyUgandaUkraineUruguayUzbekistanVenezuelaVietnamWest IndiesWestern AfricaWestern AsiaWestern EuropeYemenZaireZimbabweAzores
Select to Compare
Race
Ancestry
AfghanAfricanAlaska NativeAlaskan AthabascanAlbanianAleutAlsatianAmericanApacheArabArapahoArgentineanArmenianAssyrian/Chaldean/SyriacAustralianAustrianBahamianBangladeshiBarbadianBasqueBelgianBelizeanBermudanBhutaneseBlackfeetBolivianBrazilianBritishBritish West IndianBulgarianBurmeseCajunCambodianCanadianCape VerdeanCarpatho RusynCelticCentral AmericanCentral American IndianCherokeeCheyenneChickasawChileanChineseChippewaChoctawColombianColvilleComancheCosta RicanCreeCreekCroatianCrowCubanCypriotCzechCzechoslovakianDanishDelawareDominicanDutchDutch West IndianEastern EuropeanEcuadorianEgyptianEnglishEstonianEthiopianEuropeanFijianFilipinoFinnishFrenchFrench American IndianFrench CanadianGermanGerman RussianGhanaianGreekGuamanian/ChamorroGuatemalanGuyaneseHaitianHmongHonduranHopiHoumaHungarianIcelanderIndian (Asian)IndonesianInupiatIranianIraqiIrishIroquoisItalianJamaicanJapaneseJordanianKenyanKiowaKoreanLaotianLatvianLebaneseLiberianLithuanianLumbeeLuxembourgerMacedonianMalaysianMalteseMarshalleseMenomineeMexicanMexican American IndianMongolianMoroccanNative HawaiianNavajoNepaleseNew ZealanderNicaraguanNigerianNorthern EuropeanNorwegianOkinawanOsageOttawaPaiutePakistaniPalestinianPanamanianParaguayanPennsylvania GermanPeruvianPimaPolishPortuguesePotawatomiPuebloPuerto RicanPuget Sound SalishRomanianRussianSalvadoranSamoanScandinavianScotch-IrishScottishSeminoleSenegaleseSerbianShoshoneSierra LeoneanSiouxSlavicSlovakSloveneSomaliSouth AfricanSouth AmericanSouth American IndianSoviet UnionSpaniardSpanishSpanish AmericanSpanish American IndianSri LankanSubsaharan AfricanSudaneseSwedishSwissSyrianTaiwaneseThaiTlingit-HaidaTohono O'OdhamTonganTrinidadian and TobagonianTsimshianTurkishU.S. Virgin IslanderUgandanUkrainianUruguayanUteVenezuelanVietnameseWelshWest IndianYakamaYaquiYugoslavianYumanYup'ikZimbabwean
Immigration
NonimmigrantsImmigrantsAfghanistanAfricaAlbaniaArgentinaArmeniaAsiaAustraliaAustriaBahamasBangladeshBarbadosBelarusBelgiumBelizeBoliviaBosnia and HerzegovinaBrazilBulgariaBurma/MyanmarCabo VerdeCambodiaCameroonCanadaCaribbeanCentral AmericaChileChinaColombiaCongoCosta RicaCroatiaCubaCzechoslovakiaDenmarkDominicaDominican RepublicEastern AfricaEastern AsiaEastern EuropeEcuadorEgyptEl SalvadorEnglandEritreaEthiopiaEuropeFijiFranceGermanyGhanaGreeceGrenadaGuatemalaGuyanaHaitiHondurasHong KongHungaryIndiaIndonesiaIranIraqIrelandIsraelItalyJamaicaJapanJordanKazakhstanKenyaKoreaKuwaitLaosLatin AmericaLatviaLebanonLiberiaLithuaniaMalaysiaMexicoMicronesiaMiddle AfricaMoldovaMoroccoNepalNetherlandsNicaraguaNigeriaNorth AmericaNorth MacedoniaNorthern AfricaNorthern EuropeNorwayOceaniaPakistanPanamaPeruPhilippinesPolandPortugalRomaniaRussiaSaudi ArabiaScotlandSenegalSerbiaSierra LeoneSingaporeSomaliaSouth AfricaSouth AmericaSouth Central AsiaSouth Eastern AsiaSouthern EuropeSpainSri LankaSt. Vincent and the GrenadinesSudanSwedenSwitzerlandSyriaTaiwanThailandTrinidad and TobagoTurkeyUgandaUkraineUruguayUzbekistanVenezuelaVietnamWest IndiesWestern AfricaWestern AsiaWestern EuropeYemenZaireZimbabweAzores
Disability Age 5 to 17
Income
Poverty
Unemployment
Labor Participation
Family Structure
Vehicle Availability
Education Level
Disability

Israeli Disability Age 5 to 17
Exceptional

5.0%
DISABILITY | AGE 5 TO 17
100.0/ 100
METRIC RATING
34th/ 347
METRIC RANK

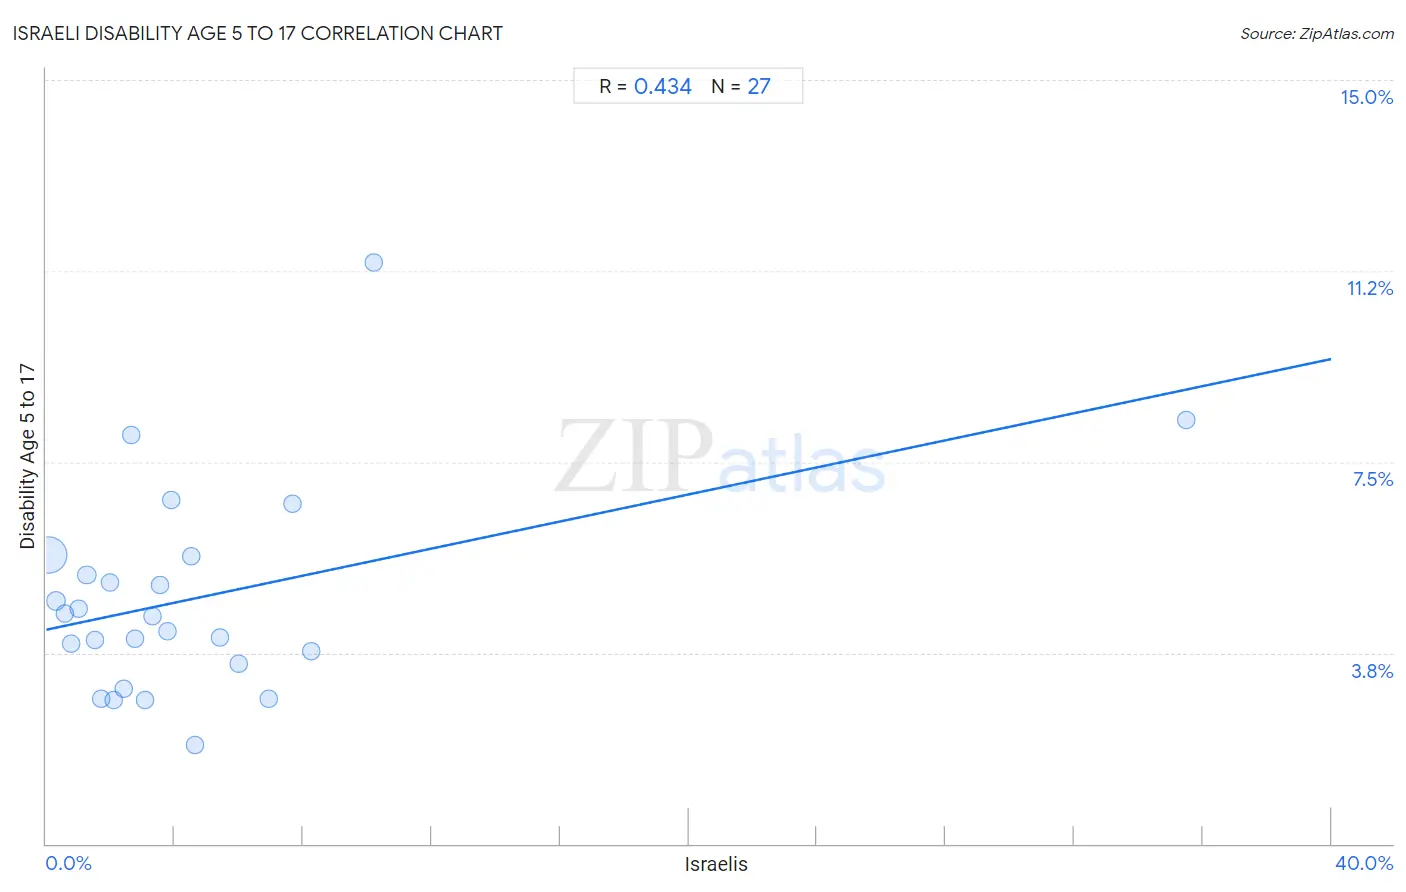
Israeli Disability Age 5 to 17 Correlation Chart

The statistical analysis conducted on geographies consisting of 209,817,716 people shows a moderate positive correlation between the proportion of Israelis and percentage of population with a disability between the ages 5 and 17 in the United States with a correlation coefficient (R) of 0.434 and weighted average of 5.0%. On average, for every 1% (one percent) increase in Israelis within a typical geography, there is an increase of 0.13% in percentage of population with a disability between the ages 5 and 17.
Israeli Disability Age 5 to 17
It is essential to understand that the correlation between the percentage of Israelis and percentage of population with a disability between the ages 5 and 17 does not imply a direct cause-and-effect relationship. It remains uncertain whether the presence of Israelis influences an upward or downward trend in the level of percentage of population with a disability between the ages 5 and 17 within an area, or if Israelis simply ended up residing in those areas with higher or lower levels of percentage of population with a disability between the ages 5 and 17 due to other factors.

Demographics Similar to Israelis by Disability Age 5 to 17

In terms of disability age 5 to 17, the demographic groups most similar to Israelis are Immigrants from Indonesia (5.0%, a difference of 0.12%), Bolivian (5.0%, a difference of 0.19%), Immigrants from Egypt (5.0%, a difference of 0.23%), Immigrants from Belarus (5.0%, a difference of 0.26%), and Immigrants from Philippines (5.0%, a difference of 0.30%).
DemographicsRating | RankDisability Age 5 to 17
Taiwanese
100.0
/100
|
#27
Exceptional
4.9%
Immigrants from Japan
100.0
/100
|
#28
Exceptional
4.9%
Immigrants from Serbia
100.0
/100
|
#29
Exceptional
4.9%
Immigrants from Malaysia
100.0
/100
|
#30
Exceptional
5.0%
Immigrants from Pakistan
100.0
/100
|
#31
Exceptional
5.0%
Soviet Union
100.0
/100
|
#32
Exceptional
5.0%
Immigrants from Indonesia
100.0
/100
|
#33
Exceptional
5.0%
Israelis
100.0
/100
|
#34
Exceptional
5.0%
Bolivians
100.0
/100
|
#35
Exceptional
5.0%
Immigrants from Egypt
100.0
/100
|
#36
Exceptional
5.0%
Immigrants from Belarus
100.0
/100
|
#37
Exceptional
5.0%
Immigrants from Philippines
100.0
/100
|
#38
Exceptional
5.0%
Immigrants from Argentina
100.0
/100
|
#39
Exceptional
5.0%
Okinawans
100.0
/100
|
#40
Exceptional
5.0%
Immigrants from Australia
100.0
/100
|
#41
Exceptional
5.0%

Israeli Disability Age 5 to 17 Correlation Summary

MeasurementIsraeli DataDisability Age 5 to 17 Data
Minimum0.066%2.0%
Maximum35.5%11.4%
Range35.4%9.5%
Mean4.7%4.8%
Median3.1%4.5%
Interquartile 25% (IQ1)1.5%3.5%
Interquartile 75% (IQ3)5.4%5.7%
Interquartile Range (IQR)3.9%2.1%
Standard Deviation (Sample)6.7%2.0%
Standard Deviation (Population)6.6%2.0%

Correlation Details

Israeli PercentileSample SizeDisability Age 5 to 17
[
0.0%
-
0.5%
]
0.066%
182,009,3325.7%
[
0.0%
-
0.5%
]
0.31%
18,154,1384.8%
[
0.5%
-
1.0%
]
0.57%
4,158,7254.5%
[
0.5%
-
1.0%
]
0.78%
1,945,1833.9%
[
1.0%
-
1.5%
]
1.02%
1,367,8934.6%
[
1.0%
-
1.5%
]
1.26%
605,6565.3%
[
1.5%
-
2.0%
]
1.50%
227,7514.0%
[
1.5%
-
2.0%
]
1.71%
365,4852.8%
[
1.5%
-
2.0%
]
1.99%
223,4575.1%
[
2.0%
-
2.5%
]
2.12%
237,0412.8%
[
2.0%
-
2.5%
]
2.40%
123,7173.0%
[
2.5%
-
3.0%
]
2.63%
63,7268.0%
[
2.5%
-
3.0%
]
2.76%
56,0654.0%
[
3.0%
-
3.5%
]
3.06%
68,9362.8%
[
3.0%
-
3.5%
]
3.30%
68,5284.5%
[
3.5%
-
4.0%
]
3.52%
61,3295.1%
[
3.5%
-
4.0%
]
3.79%
32,7244.2%
[
3.5%
-
4.0%
]
3.87%
4,3366.8%
[
4.5%
-
5.0%
]
4.52%
5985.7%
[
4.5%
-
5.0%
]
4.61%
18,2102.0%
[
5.0%
-
5.5%
]
5.40%
5,3934.0%
[
5.5%
-
6.0%
]
5.98%
8,8513.5%
[
6.5%
-
7.0%
]
6.91%
7,3072.8%
[
7.5%
-
8.0%
]
7.65%
8106.7%
[
8.0%
-
8.5%
]
8.26%
1,0663.8%
[
10.0%
-
10.5%
]
10.18%
1,36611.4%
[
35.0%
-
35.5%
]
35.48%
938.3%