Osage Disability Age 5 to 17
COMPARE
Osage
Select to Compare
Disability Age 5 to 17
Osage Disability Age 5 to 17
6.5%
DISABILITY | AGE 5 TO 17
0.0/ 100
METRIC RATING
323rd/ 347
METRIC RANK
Osage Disability Age 5 to 17 Correlation Chart
The statistical analysis conducted on geographies consisting of 91,613,344 people shows a substantial positive correlation between the proportion of Osage and percentage of population with a disability between the ages 5 and 17 in the United States with a correlation coefficient (R) of 0.545 and weighted average of 6.5%. On average, for every 1% (one percent) increase in Osage within a typical geography, there is an increase of 0.43% in percentage of population with a disability between the ages 5 and 17.
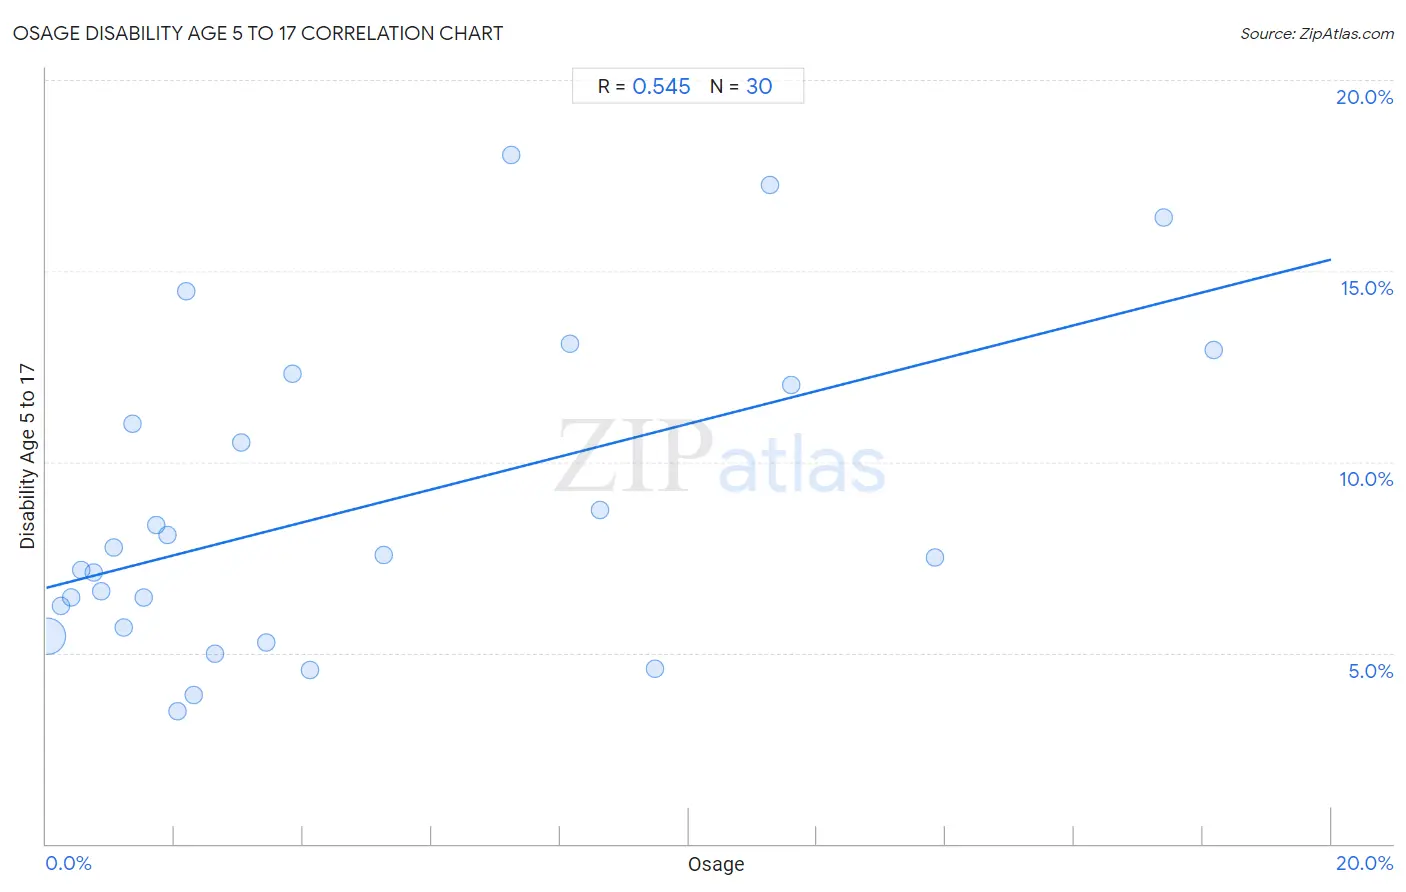
It is essential to understand that the correlation between the percentage of Osage and percentage of population with a disability between the ages 5 and 17 does not imply a direct cause-and-effect relationship. It remains uncertain whether the presence of Osage influences an upward or downward trend in the level of percentage of population with a disability between the ages 5 and 17 within an area, or if Osage simply ended up residing in those areas with higher or lower levels of percentage of population with a disability between the ages 5 and 17 due to other factors.
Demographics Similar to Osage by Disability Age 5 to 17
In terms of disability age 5 to 17, the demographic groups most similar to Osage are Slovak (6.5%, a difference of 0.040%), Tohono O'odham (6.5%, a difference of 0.060%), Dominican (6.5%, a difference of 0.080%), American (6.5%, a difference of 0.14%), and Potawatomi (6.5%, a difference of 0.27%).
| Demographics | Rating | Rank | Disability Age 5 to 17 |
| Immigrants from Dominican Republic | 0.0 /100 | #316 | Tragic 6.4% |
| Kiowa | 0.0 /100 | #317 | Tragic 6.4% |
| Comanche | 0.0 /100 | #318 | Tragic 6.4% |
| Delaware | 0.0 /100 | #319 | Tragic 6.5% |
| Africans | 0.0 /100 | #320 | Tragic 6.5% |
| Tohono O'odham | 0.0 /100 | #321 | Tragic 6.5% |
| Slovaks | 0.0 /100 | #322 | Tragic 6.5% |
| Osage | 0.0 /100 | #323 | Tragic 6.5% |
| Dominicans | 0.0 /100 | #324 | Tragic 6.5% |
| Americans | 0.0 /100 | #325 | Tragic 6.5% |
| Potawatomi | 0.0 /100 | #326 | Tragic 6.5% |
| French American Indians | 0.0 /100 | #327 | Tragic 6.6% |
| Pennsylvania Germans | 0.0 /100 | #328 | Tragic 6.6% |
| Blackfeet | 0.0 /100 | #329 | Tragic 6.6% |
| Dutch West Indians | 0.0 /100 | #330 | Tragic 6.7% |
Osage Disability Age 5 to 17 Correlation Summary
| Measurement | Osage Data | Disability Age 5 to 17 Data |
| Minimum | 0.021% | 3.5% |
| Maximum | 18.2% | 18.0% |
| Range | 18.2% | 14.5% |
| Mean | 4.9% | 8.8% |
| Median | 2.5% | 7.5% |
| Interquartile 25% (IQ1) | 1.2% | 5.7% |
| Interquartile 75% (IQ3) | 8.1% | 12.0% |
| Interquartile Range (IQR) | 6.9% | 6.4% |
| Standard Deviation (Sample) | 5.2% | 4.1% |
| Standard Deviation (Population) | 5.1% | 4.0% |
Correlation Details
| Osage Percentile | Sample Size | Disability Age 5 to 17 |
[ 0.0% - 0.5% ] 0.021% | 86,795,607 | 5.4% |
[ 0.0% - 0.5% ] 0.23% | 3,032,932 | 6.2% |
[ 0.0% - 0.5% ] 0.39% | 813,098 | 6.4% |
[ 0.5% - 1.0% ] 0.55% | 245,935 | 7.2% |
[ 0.5% - 1.0% ] 0.73% | 170,536 | 7.1% |
[ 0.5% - 1.0% ] 0.86% | 125,408 | 6.6% |
[ 1.0% - 1.5% ] 1.04% | 147,986 | 7.7% |
[ 1.0% - 1.5% ] 1.21% | 54,421 | 5.7% |
[ 1.0% - 1.5% ] 1.34% | 38,513 | 11.0% |
[ 1.5% - 2.0% ] 1.51% | 25,830 | 6.5% |
[ 1.5% - 2.0% ] 1.71% | 59,738 | 8.4% |
[ 1.5% - 2.0% ] 1.88% | 5,053 | 8.1% |
[ 2.0% - 2.5% ] 2.04% | 20,374 | 3.5% |
[ 2.0% - 2.5% ] 2.18% | 8,612 | 14.5% |
[ 2.0% - 2.5% ] 2.30% | 2,083 | 3.9% |
[ 2.5% - 3.0% ] 2.63% | 4,758 | 5.0% |
[ 3.0% - 3.5% ] 3.03% | 6,171 | 10.5% |
[ 3.0% - 3.5% ] 3.42% | 14,990 | 5.3% |
[ 3.5% - 4.0% ] 3.83% | 1,200 | 12.3% |
[ 4.0% - 4.5% ] 4.10% | 6,316 | 4.5% |
[ 5.0% - 5.5% ] 5.26% | 11,832 | 7.6% |
[ 7.0% - 7.5% ] 7.23% | 318 | 18.0% |
[ 8.0% - 8.5% ] 8.15% | 3,327 | 13.1% |
[ 8.5% - 9.0% ] 8.62% | 4,140 | 8.7% |
[ 9.0% - 9.5% ] 9.48% | 1,920 | 4.6% |
[ 11.0% - 11.5% ] 11.27% | 3,009 | 17.2% |
[ 11.5% - 12.0% ] 11.60% | 4,905 | 12.0% |
[ 13.5% - 14.0% ] 13.84% | 1,568 | 7.5% |
[ 17.0% - 17.5% ] 17.40% | 1,592 | 16.4% |
[ 18.0% - 18.5% ] 18.17% | 1,172 | 12.9% |