Inupiat Disability Age 5 to 17
COMPARE
Inupiat
Select to Compare
Disability Age 5 to 17
Inupiat Disability Age 5 to 17
5.7%
DISABILITY | AGE 5 TO 17
23.3/ 100
METRIC RATING
196th/ 347
METRIC RANK
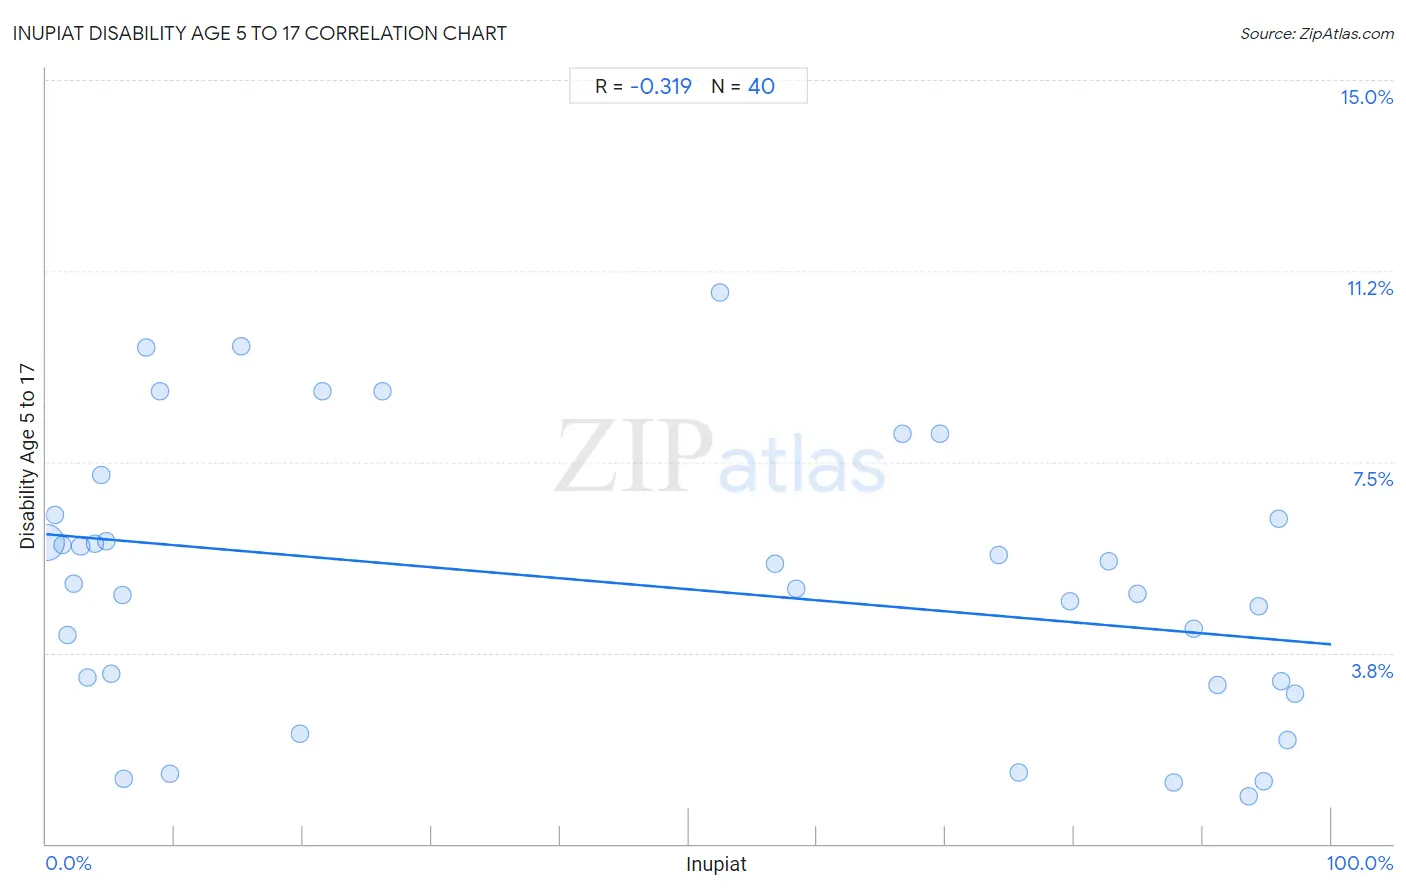
Inupiat Disability Age 5 to 17 Correlation Chart
The statistical analysis conducted on geographies consisting of 96,104,809 people shows a mild negative correlation between the proportion of Inupiat and percentage of population with a disability between the ages 5 and 17 in the United States with a correlation coefficient (R) of -0.319 and weighted average of 5.7%. On average, for every 1% (one percent) increase in Inupiat within a typical geography, there is a decrease of 0.022% in percentage of population with a disability between the ages 5 and 17.
It is essential to understand that the correlation between the percentage of Inupiat and percentage of population with a disability between the ages 5 and 17 does not imply a direct cause-and-effect relationship. It remains uncertain whether the presence of Inupiat influences an upward or downward trend in the level of percentage of population with a disability between the ages 5 and 17 within an area, or if Inupiat simply ended up residing in those areas with higher or lower levels of percentage of population with a disability between the ages 5 and 17 due to other factors.
Demographics Similar to Inupiat by Disability Age 5 to 17
In terms of disability age 5 to 17, the demographic groups most similar to Inupiat are Immigrants from Nigeria (5.7%, a difference of 0.010%), Immigrants from North America (5.7%, a difference of 0.010%), Croatian (5.7%, a difference of 0.020%), Norwegian (5.7%, a difference of 0.17%), and Immigrants from Canada (5.7%, a difference of 0.18%).
| Demographics | Rating | Rank | Disability Age 5 to 17 |
| Pueblo | 27.5 /100 | #189 | Fair 5.7% |
| Immigrants from Eastern Africa | 27.3 /100 | #190 | Fair 5.7% |
| Danes | 26.5 /100 | #191 | Fair 5.7% |
| Immigrants from Bosnia and Herzegovina | 26.3 /100 | #192 | Fair 5.7% |
| Immigrants from Canada | 26.1 /100 | #193 | Fair 5.7% |
| Croatians | 23.6 /100 | #194 | Fair 5.7% |
| Immigrants from Nigeria | 23.4 /100 | #195 | Fair 5.7% |
| Inupiat | 23.3 /100 | #196 | Fair 5.7% |
| Immigrants from North America | 23.1 /100 | #197 | Fair 5.7% |
| Norwegians | 20.9 /100 | #198 | Fair 5.7% |
| Northern Europeans | 15.2 /100 | #199 | Poor 5.7% |
| Icelanders | 14.6 /100 | #200 | Poor 5.7% |
| Basques | 13.7 /100 | #201 | Poor 5.7% |
| Austrians | 13.2 /100 | #202 | Poor 5.7% |
| Spanish American Indians | 12.8 /100 | #203 | Poor 5.7% |
Inupiat Disability Age 5 to 17 Correlation Summary
| Measurement | Inupiat Data | Disability Age 5 to 17 Data |
| Minimum | 0.028% | 0.93% |
| Maximum | 97.2% | 10.8% |
| Range | 97.2% | 9.9% |
| Mean | 44.7% | 5.1% |
| Median | 39.3% | 5.1% |
| Interquartile 25% (IQ1) | 4.9% | 3.2% |
| Interquartile 75% (IQ3) | 86.3% | 6.4% |
| Interquartile Range (IQR) | 81.5% | 3.3% |
| Standard Deviation (Sample) | 39.3% | 2.7% |
| Standard Deviation (Population) | 38.9% | 2.6% |
Correlation Details
| Inupiat Percentile | Sample Size | Disability Age 5 to 17 |
[ 0.0% - 0.5% ] 0.028% | 94,517,770 | 5.9% |
[ 0.5% - 1.0% ] 0.70% | 409,545 | 6.5% |
[ 1.0% - 1.5% ] 1.25% | 313,715 | 5.9% |
[ 1.5% - 2.0% ] 1.63% | 88,706 | 4.1% |
[ 2.0% - 2.5% ] 2.17% | 448,915 | 5.1% |
[ 2.5% - 3.0% ] 2.68% | 162,723 | 5.8% |
[ 3.0% - 3.5% ] 3.18% | 31,917 | 3.3% |
[ 3.5% - 4.0% ] 3.76% | 64,111 | 5.9% |
[ 4.0% - 4.5% ] 4.26% | 8,590 | 7.2% |
[ 4.5% - 5.0% ] 4.63% | 2,159 | 5.9% |
[ 5.0% - 5.5% ] 5.07% | 5,287 | 3.3% |
[ 5.5% - 6.0% ] 5.93% | 843 | 4.9% |
[ 6.0% - 6.5% ] 6.05% | 1,654 | 1.3% |
[ 7.5% - 8.0% ] 7.81% | 679 | 9.7% |
[ 8.5% - 9.0% ] 8.85% | 452 | 8.9% |
[ 9.5% - 10.0% ] 9.60% | 4,179 | 1.4% |
[ 15.0% - 15.5% ] 15.20% | 329 | 9.8% |
[ 19.5% - 20.0% ] 19.76% | 1,640 | 2.2% |
[ 21.0% - 21.5% ] 21.47% | 843 | 8.9% |
[ 26.0% - 26.5% ] 26.16% | 692 | 8.9% |
[ 52.0% - 52.5% ] 52.38% | 9,755 | 10.8% |
[ 56.5% - 57.0% ] 56.71% | 3,710 | 5.5% |
[ 58.0% - 58.5% ] 58.36% | 4,150 | 5.0% |
[ 66.5% - 67.0% ] 66.61% | 3,255 | 8.0% |
[ 69.5% - 70.0% ] 69.59% | 3,088 | 8.0% |
[ 74.0% - 74.5% ] 74.11% | 1,128 | 5.7% |
[ 75.5% - 76.0% ] 75.68% | 1,242 | 1.4% |
[ 79.5% - 80.0% ] 79.68% | 630 | 4.8% |
[ 82.5% - 83.0% ] 82.67% | 554 | 5.6% |
[ 84.5% - 85.0% ] 84.88% | 344 | 4.9% |
[ 87.5% - 88.0% ] 87.79% | 1,114 | 1.2% |
[ 89.0% - 89.5% ] 89.30% | 1,308 | 4.2% |
[ 91.0% - 91.5% ] 91.10% | 1,686 | 3.1% |
[ 93.5% - 94.0% ] 93.59% | 624 | 0.93% |
[ 94.0% - 94.5% ] 94.40% | 1,250 | 4.7% |
[ 94.5% - 95.0% ] 94.72% | 1,136 | 1.2% |
[ 95.5% - 96.0% ] 95.96% | 1,288 | 6.4% |
[ 96.0% - 96.5% ] 96.08% | 1,072 | 3.2% |
[ 96.5% - 97.0% ] 96.60% | 588 | 2.0% |
[ 97.0% - 97.5% ] 97.19% | 2,138 | 2.9% |