Creek Disability Age 5 to 17
COMPARE
Creek
Select to Compare
Disability Age 5 to 17
Creek Disability Age 5 to 17
6.9%
DISABILITY | AGE 5 TO 17
0.0/ 100
METRIC RATING
337th/ 347
METRIC RANK
Creek Disability Age 5 to 17 Correlation Chart
The statistical analysis conducted on geographies consisting of 177,779,638 people shows a poor positive correlation between the proportion of Creek and percentage of population with a disability between the ages 5 and 17 in the United States with a correlation coefficient (R) of 0.110 and weighted average of 6.9%. On average, for every 1% (one percent) increase in Creek within a typical geography, there is an increase of 0.045% in percentage of population with a disability between the ages 5 and 17.
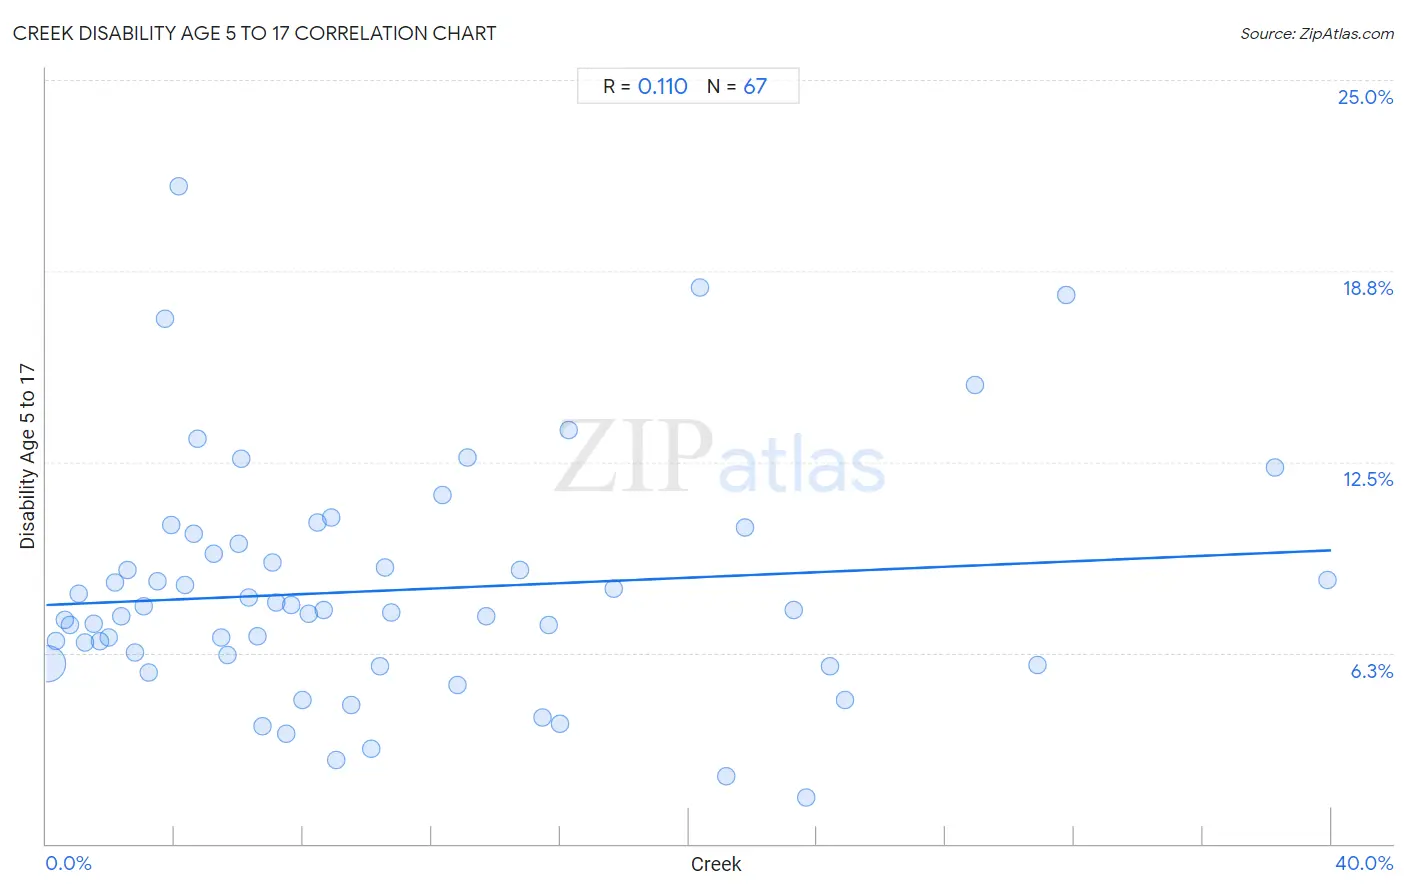
It is essential to understand that the correlation between the percentage of Creek and percentage of population with a disability between the ages 5 and 17 does not imply a direct cause-and-effect relationship. It remains uncertain whether the presence of Creek influences an upward or downward trend in the level of percentage of population with a disability between the ages 5 and 17 within an area, or if Creek simply ended up residing in those areas with higher or lower levels of percentage of population with a disability between the ages 5 and 17 due to other factors.
Demographics Similar to Creek by Disability Age 5 to 17
In terms of disability age 5 to 17, the demographic groups most similar to Creek are Iroquois (6.9%, a difference of 0.24%), Chickasaw (6.8%, a difference of 0.43%), Choctaw (6.9%, a difference of 0.57%), Cherokee (6.9%, a difference of 0.83%), and Ottawa (6.8%, a difference of 0.93%).
| Demographics | Rating | Rank | Disability Age 5 to 17 |
| Dutch West Indians | 0.0 /100 | #330 | Tragic 6.7% |
| French Canadians | 0.0 /100 | #331 | Tragic 6.7% |
| Immigrants from the Azores | 0.0 /100 | #332 | Tragic 6.7% |
| Blacks/African Americans | 0.0 /100 | #333 | Tragic 6.8% |
| Seminole | 0.0 /100 | #334 | Tragic 6.8% |
| Ottawa | 0.0 /100 | #335 | Tragic 6.8% |
| Chickasaw | 0.0 /100 | #336 | Tragic 6.8% |
| Creek | 0.0 /100 | #337 | Tragic 6.9% |
| Iroquois | 0.0 /100 | #338 | Tragic 6.9% |
| Choctaw | 0.0 /100 | #339 | Tragic 6.9% |
| Cherokee | 0.0 /100 | #340 | Tragic 6.9% |
| Cape Verdeans | 0.0 /100 | #341 | Tragic 7.0% |
| Chippewa | 0.0 /100 | #342 | Tragic 7.1% |
| Immigrants from Cabo Verde | 0.0 /100 | #343 | Tragic 7.1% |
| Cajuns | 0.0 /100 | #344 | Tragic 7.2% |
Creek Disability Age 5 to 17 Correlation Summary
| Measurement | Creek Data | Disability Age 5 to 17 Data |
| Minimum | 0.037% | 1.5% |
| Maximum | 39.9% | 21.5% |
| Range | 39.9% | 20.0% |
| Mean | 10.6% | 8.3% |
| Median | 7.6% | 7.6% |
| Interquartile 25% (IQ1) | 3.7% | 5.9% |
| Interquartile 75% (IQ3) | 15.5% | 9.8% |
| Interquartile Range (IQR) | 11.8% | 4.0% |
| Standard Deviation (Sample) | 9.4% | 3.8% |
| Standard Deviation (Population) | 9.3% | 3.8% |
Correlation Details
| Creek Percentile | Sample Size | Disability Age 5 to 17 |
[ 0.0% - 0.5% ] 0.037% | 165,332,633 | 5.9% |
[ 0.0% - 0.5% ] 0.30% | 5,315,023 | 6.6% |
[ 0.5% - 1.0% ] 0.57% | 2,535,427 | 7.3% |
[ 0.5% - 1.0% ] 0.75% | 1,101,709 | 7.2% |
[ 0.5% - 1.0% ] 1.00% | 528,823 | 8.2% |
[ 1.0% - 1.5% ] 1.21% | 546,058 | 6.6% |
[ 1.0% - 1.5% ] 1.48% | 408,346 | 7.2% |
[ 1.5% - 2.0% ] 1.69% | 535,648 | 6.6% |
[ 1.5% - 2.0% ] 1.93% | 427,936 | 6.8% |
[ 2.0% - 2.5% ] 2.14% | 85,187 | 8.5% |
[ 2.0% - 2.5% ] 2.33% | 126,054 | 7.4% |
[ 2.5% - 3.0% ] 2.55% | 102,002 | 9.0% |
[ 2.5% - 3.0% ] 2.76% | 146,480 | 6.3% |
[ 3.0% - 3.5% ] 3.02% | 23,044 | 7.8% |
[ 3.0% - 3.5% ] 3.19% | 63,343 | 5.6% |
[ 3.0% - 3.5% ] 3.44% | 47,615 | 8.6% |
[ 3.5% - 4.0% ] 3.70% | 22,091 | 17.2% |
[ 3.5% - 4.0% ] 3.88% | 60,834 | 10.4% |
[ 4.0% - 4.5% ] 4.12% | 8,826 | 21.5% |
[ 4.0% - 4.5% ] 4.32% | 30,173 | 8.5% |
[ 4.5% - 5.0% ] 4.59% | 34,437 | 10.2% |
[ 4.5% - 5.0% ] 4.71% | 24,478 | 13.2% |
[ 5.0% - 5.5% ] 5.23% | 7,864 | 9.5% |
[ 5.0% - 5.5% ] 5.44% | 23,269 | 6.7% |
[ 5.5% - 6.0% ] 5.64% | 2,890 | 6.2% |
[ 5.5% - 6.0% ] 6.00% | 467 | 9.8% |
[ 6.0% - 6.5% ] 6.07% | 956 | 12.6% |
[ 6.0% - 6.5% ] 6.31% | 793 | 8.1% |
[ 6.5% - 7.0% ] 6.59% | 42,642 | 6.8% |
[ 6.5% - 7.0% ] 6.74% | 20,573 | 3.9% |
[ 7.0% - 7.5% ] 7.03% | 20,232 | 9.2% |
[ 7.0% - 7.5% ] 7.17% | 17,879 | 7.9% |
[ 7.0% - 7.5% ] 7.48% | 15,187 | 3.6% |
[ 7.5% - 8.0% ] 7.64% | 7,093 | 7.8% |
[ 7.5% - 8.0% ] 7.96% | 15,457 | 4.7% |
[ 8.0% - 8.5% ] 8.17% | 4,529 | 7.5% |
[ 8.0% - 8.5% ] 8.43% | 356 | 10.5% |
[ 8.5% - 9.0% ] 8.62% | 2,934 | 7.6% |
[ 8.5% - 9.0% ] 8.89% | 3,105 | 10.7% |
[ 9.0% - 9.5% ] 9.02% | 1,286 | 2.7% |
[ 9.0% - 9.5% ] 9.49% | 2,572 | 4.5% |
[ 10.0% - 10.5% ] 10.13% | 9,131 | 3.1% |
[ 10.0% - 10.5% ] 10.41% | 3,181 | 5.8% |
[ 10.5% - 11.0% ] 10.53% | 247 | 9.0% |
[ 10.5% - 11.0% ] 10.73% | 5,639 | 7.6% |
[ 12.0% - 12.5% ] 12.33% | 15,212 | 11.4% |
[ 12.5% - 13.0% ] 12.80% | 1,086 | 5.2% |
[ 13.0% - 13.5% ] 13.11% | 11,366 | 12.6% |
[ 13.5% - 14.0% ] 13.70% | 9,280 | 7.5% |
[ 14.5% - 15.0% ] 14.75% | 373 | 9.0% |
[ 15.0% - 15.5% ] 15.46% | 2,419 | 4.1% |
[ 15.5% - 16.0% ] 15.65% | 3,048 | 7.2% |
[ 15.5% - 16.0% ] 15.98% | 2,828 | 3.9% |
[ 16.0% - 16.5% ] 16.27% | 375 | 13.6% |
[ 17.5% - 18.0% ] 17.65% | 119 | 8.3% |
[ 20.0% - 20.5% ] 20.36% | 894 | 18.2% |
[ 21.0% - 21.5% ] 21.15% | 6,000 | 2.2% |
[ 21.5% - 22.0% ] 21.76% | 763 | 10.3% |
[ 23.0% - 23.5% ] 23.27% | 739 | 7.6% |
[ 23.5% - 24.0% ] 23.65% | 3,078 | 1.5% |
[ 24.0% - 24.5% ] 24.40% | 1,615 | 5.8% |
[ 24.5% - 25.0% ] 24.86% | 1,070 | 4.7% |
[ 28.5% - 29.0% ] 28.91% | 128 | 15.0% |
[ 30.5% - 31.0% ] 30.85% | 2,480 | 5.9% |
[ 31.5% - 32.0% ] 31.77% | 447 | 17.9% |
[ 38.0% - 38.5% ] 38.25% | 1,498 | 12.3% |
[ 39.5% - 40.0% ] 39.89% | 371 | 8.6% |