Swedish Disability Age 5 to 17
COMPARE
Swedish
Select to Compare
Disability Age 5 to 17
Swedish Disability Age 5 to 17
5.8%
DISABILITY | AGE 5 TO 17
8.1/ 100
METRIC RATING
215th/ 347
METRIC RANK
Swedish Disability Age 5 to 17 Correlation Chart
The statistical analysis conducted on geographies consisting of 528,112,319 people shows a substantial positive correlation between the proportion of Swedes and percentage of population with a disability between the ages 5 and 17 in the United States with a correlation coefficient (R) of 0.520 and weighted average of 5.8%. On average, for every 1% (one percent) increase in Swedes within a typical geography, there is an increase of 0.40% in percentage of population with a disability between the ages 5 and 17.
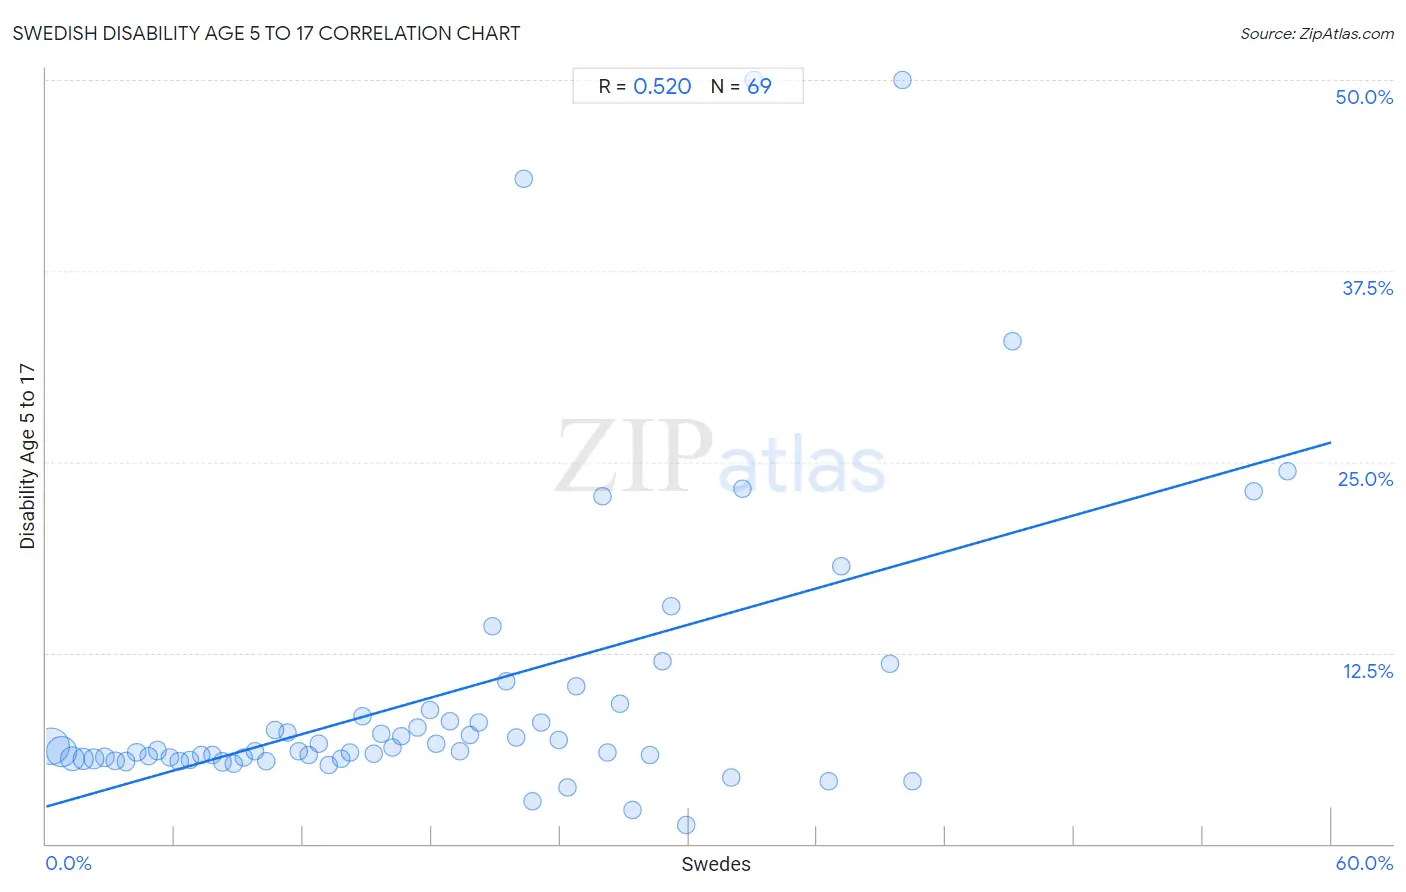
It is essential to understand that the correlation between the percentage of Swedes and percentage of population with a disability between the ages 5 and 17 does not imply a direct cause-and-effect relationship. It remains uncertain whether the presence of Swedes influences an upward or downward trend in the level of percentage of population with a disability between the ages 5 and 17 within an area, or if Swedes simply ended up residing in those areas with higher or lower levels of percentage of population with a disability between the ages 5 and 17 due to other factors.
Demographics Similar to Swedes by Disability Age 5 to 17
In terms of disability age 5 to 17, the demographic groups most similar to Swedes are Immigrants from Cameroon (5.8%, a difference of 0.040%), Immigrants from Morocco (5.8%, a difference of 0.040%), Immigrants from Panama (5.8%, a difference of 0.090%), Nigerian (5.8%, a difference of 0.090%), and Czech (5.8%, a difference of 0.12%).
| Demographics | Rating | Rank | Disability Age 5 to 17 |
| Kenyans | 10.0 /100 | #208 | Poor 5.8% |
| Immigrants from Uganda | 9.7 /100 | #209 | Tragic 5.8% |
| Immigrants from Haiti | 9.5 /100 | #210 | Tragic 5.8% |
| Yugoslavians | 9.1 /100 | #211 | Tragic 5.8% |
| Immigrants from Panama | 8.7 /100 | #212 | Tragic 5.8% |
| Immigrants from Cameroon | 8.3 /100 | #213 | Tragic 5.8% |
| Immigrants from Morocco | 8.3 /100 | #214 | Tragic 5.8% |
| Swedes | 8.1 /100 | #215 | Tragic 5.8% |
| Nigerians | 7.5 /100 | #216 | Tragic 5.8% |
| Czechs | 7.4 /100 | #217 | Tragic 5.8% |
| Immigrants from Sierra Leone | 7.1 /100 | #218 | Tragic 5.8% |
| Sierra Leoneans | 7.0 /100 | #219 | Tragic 5.8% |
| Belgians | 6.9 /100 | #220 | Tragic 5.8% |
| Lithuanians | 6.7 /100 | #221 | Tragic 5.8% |
| Immigrants from Sudan | 6.7 /100 | #222 | Tragic 5.8% |
Swedish Disability Age 5 to 17 Correlation Summary
| Measurement | Swedish Data | Disability Age 5 to 17 Data |
| Minimum | 0.26% | 1.3% |
| Maximum | 58.0% | 50.0% |
| Range | 57.7% | 48.7% |
| Mean | 18.8% | 9.9% |
| Median | 17.3% | 6.1% |
| Interquartile 25% (IQ1) | 8.5% | 5.6% |
| Interquartile 75% (IQ3) | 26.5% | 8.5% |
| Interquartile Range (IQR) | 18.0% | 3.0% |
| Standard Deviation (Sample) | 13.0% | 9.9% |
| Standard Deviation (Population) | 12.9% | 9.8% |
Correlation Details
| Swedish Percentile | Sample Size | Disability Age 5 to 17 |
[ 0.0% - 0.5% ] 0.26% | 209,178,952 | 6.4% |
[ 0.5% - 1.0% ] 0.73% | 132,204,412 | 6.0% |
[ 1.0% - 1.5% ] 1.22% | 69,804,639 | 5.6% |
[ 1.5% - 2.0% ] 1.73% | 38,660,777 | 5.5% |
[ 2.0% - 2.5% ] 2.23% | 25,396,409 | 5.6% |
[ 2.5% - 3.0% ] 2.72% | 17,436,593 | 5.7% |
[ 3.0% - 3.5% ] 3.23% | 10,241,095 | 5.4% |
[ 3.5% - 4.0% ] 3.72% | 6,854,035 | 5.4% |
[ 4.0% - 4.5% ] 4.22% | 3,386,367 | 6.0% |
[ 4.5% - 5.0% ] 4.76% | 2,323,675 | 5.8% |
[ 5.0% - 5.5% ] 5.20% | 2,112,450 | 6.1% |
[ 5.5% - 6.0% ] 5.77% | 1,602,387 | 5.6% |
[ 6.0% - 6.5% ] 6.21% | 1,953,258 | 5.4% |
[ 6.5% - 7.0% ] 6.71% | 1,148,685 | 5.5% |
[ 7.0% - 7.5% ] 7.24% | 860,185 | 5.8% |
[ 7.5% - 8.0% ] 7.77% | 1,074,297 | 5.8% |
[ 8.0% - 8.5% ] 8.22% | 695,335 | 5.4% |
[ 8.5% - 9.0% ] 8.74% | 587,321 | 5.2% |
[ 9.0% - 9.5% ] 9.23% | 517,207 | 5.7% |
[ 9.5% - 10.0% ] 9.72% | 501,304 | 6.0% |
[ 10.0% - 10.5% ] 10.28% | 273,972 | 5.4% |
[ 10.5% - 11.0% ] 10.71% | 147,699 | 7.5% |
[ 11.0% - 11.5% ] 11.24% | 206,420 | 7.3% |
[ 11.5% - 12.0% ] 11.78% | 89,647 | 6.1% |
[ 12.0% - 12.5% ] 12.25% | 124,077 | 5.8% |
[ 12.5% - 13.0% ] 12.74% | 143,194 | 6.5% |
[ 13.0% - 13.5% ] 13.21% | 133,327 | 5.2% |
[ 13.5% - 14.0% ] 13.77% | 76,680 | 5.6% |
[ 14.0% - 14.5% ] 14.18% | 46,932 | 6.0% |
[ 14.5% - 15.0% ] 14.78% | 50,169 | 8.3% |
[ 15.0% - 15.5% ] 15.27% | 51,447 | 5.9% |
[ 15.5% - 16.0% ] 15.67% | 20,286 | 7.2% |
[ 16.0% - 16.5% ] 16.17% | 34,713 | 6.3% |
[ 16.5% - 17.0% ] 16.59% | 41,452 | 7.0% |
[ 17.0% - 17.5% ] 17.32% | 15,704 | 7.6% |
[ 17.5% - 18.0% ] 17.89% | 22,204 | 8.8% |
[ 18.0% - 18.5% ] 18.21% | 8,019 | 6.5% |
[ 18.5% - 19.0% ] 18.84% | 3,238 | 8.0% |
[ 19.0% - 19.5% ] 19.30% | 14,280 | 6.1% |
[ 19.5% - 20.0% ] 19.80% | 10,996 | 7.1% |
[ 20.0% - 20.5% ] 20.17% | 15,177 | 8.0% |
[ 20.5% - 21.0% ] 20.83% | 2,559 | 14.3% |
[ 21.0% - 21.5% ] 21.46% | 480 | 10.7% |
[ 21.5% - 22.0% ] 21.97% | 3,114 | 6.9% |
[ 22.0% - 22.5% ] 22.29% | 516 | 43.6% |
[ 22.5% - 23.0% ] 22.73% | 2,261 | 2.8% |
[ 23.0% - 23.5% ] 23.12% | 5,090 | 7.9% |
[ 23.5% - 24.0% ] 23.92% | 1,041 | 6.8% |
[ 24.0% - 24.5% ] 24.32% | 3,561 | 3.7% |
[ 24.5% - 25.0% ] 24.75% | 3,838 | 10.3% |
[ 25.5% - 26.0% ] 25.95% | 3,542 | 22.8% |
[ 26.0% - 26.5% ] 26.19% | 1,661 | 6.0% |
[ 26.5% - 27.0% ] 26.79% | 1,620 | 9.2% |
[ 27.0% - 27.5% ] 27.35% | 2,494 | 2.2% |
[ 28.0% - 28.5% ] 28.17% | 1,665 | 5.8% |
[ 28.5% - 29.0% ] 28.75% | 1,979 | 12.0% |
[ 29.0% - 29.5% ] 29.20% | 411 | 15.5% |
[ 29.5% - 30.0% ] 29.88% | 2,503 | 1.3% |
[ 31.5% - 32.0% ] 31.99% | 569 | 4.3% |
[ 32.5% - 33.0% ] 32.52% | 1,891 | 23.2% |
[ 33.0% - 33.5% ] 33.01% | 103 | 50.0% |
[ 36.5% - 37.0% ] 36.54% | 353 | 4.1% |
[ 37.0% - 37.5% ] 37.11% | 741 | 18.2% |
[ 39.0% - 39.5% ] 39.37% | 127 | 11.8% |
[ 40.0% - 40.5% ] 40.00% | 85 | 50.0% |
[ 40.0% - 40.5% ] 40.46% | 393 | 4.1% |
[ 45.0% - 45.5% ] 45.12% | 297 | 32.9% |
[ 56.0% - 56.5% ] 56.39% | 133 | 23.1% |
[ 57.5% - 58.0% ] 57.97% | 276 | 24.4% |