Immigrants from Thailand Disability Age 5 to 17

COMPARE

Immigrants from Thailand
Race
Ancestry
AfghanAfricanAlaska NativeAlaskan AthabascanAlbanianAleutAlsatianAmericanApacheArabArapahoArgentineanArmenianAssyrian/Chaldean/SyriacAustralianAustrianBahamianBangladeshiBarbadianBasqueBelgianBelizeanBermudanBhutaneseBlackfeetBolivianBrazilianBritishBritish West IndianBulgarianBurmeseCajunCambodianCanadianCape VerdeanCarpatho RusynCelticCentral AmericanCentral American IndianCherokeeCheyenneChickasawChileanChineseChippewaChoctawColombianColvilleComancheCosta RicanCreeCreekCroatianCrowCubanCypriotCzechCzechoslovakianDanishDelawareDominicanDutchDutch West IndianEastern EuropeanEcuadorianEgyptianEnglishEstonianEthiopianEuropeanFijianFilipinoFinnishFrenchFrench American IndianFrench CanadianGermanGerman RussianGhanaianGreekGuamanian/ChamorroGuatemalanGuyaneseHaitianHmongHonduranHopiHoumaHungarianIcelanderIndian (Asian)IndonesianInupiatIranianIraqiIrishIroquoisIsraeliItalianJamaicanJapaneseJordanianKenyanKiowaKoreanLaotianLatvianLebaneseLiberianLithuanianLumbeeLuxembourgerMacedonianMalaysianMalteseMarshalleseMenomineeMexicanMexican American IndianMongolianMoroccanNative HawaiianNavajoNepaleseNew ZealanderNicaraguanNigerianNorthern EuropeanNorwegianOkinawanOsageOttawaPaiutePakistaniPalestinianPanamanianParaguayanPennsylvania GermanPeruvianPimaPolishPortuguesePotawatomiPuebloPuerto RicanPuget Sound SalishRomanianRussianSalvadoranSamoanScandinavianScotch-IrishScottishSeminoleSenegaleseSerbianShoshoneSierra LeoneanSiouxSlavicSlovakSloveneSomaliSouth AfricanSouth AmericanSouth American IndianSoviet UnionSpaniardSpanishSpanish AmericanSpanish American IndianSri LankanSubsaharan AfricanSudaneseSwedishSwissSyrianTaiwaneseThaiTlingit-HaidaTohono O'OdhamTonganTrinidadian and TobagonianTsimshianTurkishU.S. Virgin IslanderUgandanUkrainianUruguayanUteVenezuelanVietnameseWelshWest IndianYakamaYaquiYugoslavianYumanYup'ikZimbabwean
Immigration
NonimmigrantsImmigrantsAfghanistanAfricaAlbaniaArgentinaArmeniaAsiaAustraliaAustriaBahamasBangladeshBarbadosBelarusBelgiumBelizeBoliviaBosnia and HerzegovinaBrazilBulgariaBurma/MyanmarCabo VerdeCambodiaCameroonCanadaCaribbeanCentral AmericaChileChinaColombiaCongoCosta RicaCroatiaCubaCzechoslovakiaDenmarkDominicaDominican RepublicEastern AfricaEastern AsiaEastern EuropeEcuadorEgyptEl SalvadorEnglandEritreaEthiopiaEuropeFijiFranceGermanyGhanaGreeceGrenadaGuatemalaGuyanaHaitiHondurasHong KongHungaryIndiaIndonesiaIranIraqIrelandIsraelItalyJamaicaJapanJordanKazakhstanKenyaKoreaKuwaitLaosLatin AmericaLatviaLebanonLiberiaLithuaniaMalaysiaMexicoMicronesiaMiddle AfricaMoldovaMoroccoNepalNetherlandsNicaraguaNigeriaNorth AmericaNorth MacedoniaNorthern AfricaNorthern EuropeNorwayOceaniaPakistanPanamaPeruPhilippinesPolandPortugalRomaniaRussiaSaudi ArabiaScotlandSenegalSerbiaSierra LeoneSingaporeSomaliaSouth AfricaSouth AmericaSouth Central AsiaSouth Eastern AsiaSouthern EuropeSpainSri LankaSt. Vincent and the GrenadinesSudanSwedenSwitzerlandSyriaTaiwanThailandTrinidad and TobagoTurkeyUgandaUkraineUruguayUzbekistanVenezuelaVietnamWest IndiesWestern AfricaWestern AsiaWestern EuropeYemenZaireZimbabweAzores
Select to Compare
Race
Ancestry
AfghanAfricanAlaska NativeAlaskan AthabascanAlbanianAleutAlsatianAmericanApacheArabArapahoArgentineanArmenianAssyrian/Chaldean/SyriacAustralianAustrianBahamianBangladeshiBarbadianBasqueBelgianBelizeanBermudanBhutaneseBlackfeetBolivianBrazilianBritishBritish West IndianBulgarianBurmeseCajunCambodianCanadianCape VerdeanCarpatho RusynCelticCentral AmericanCentral American IndianCherokeeCheyenneChickasawChileanChineseChippewaChoctawColombianColvilleComancheCosta RicanCreeCreekCroatianCrowCubanCypriotCzechCzechoslovakianDanishDelawareDominicanDutchDutch West IndianEastern EuropeanEcuadorianEgyptianEnglishEstonianEthiopianEuropeanFijianFilipinoFinnishFrenchFrench American IndianFrench CanadianGermanGerman RussianGhanaianGreekGuamanian/ChamorroGuatemalanGuyaneseHaitianHmongHonduranHopiHoumaHungarianIcelanderIndian (Asian)IndonesianInupiatIranianIraqiIrishIroquoisIsraeliItalianJamaicanJapaneseJordanianKenyanKiowaKoreanLaotianLatvianLebaneseLiberianLithuanianLumbeeLuxembourgerMacedonianMalaysianMalteseMarshalleseMenomineeMexicanMexican American IndianMongolianMoroccanNative HawaiianNavajoNepaleseNew ZealanderNicaraguanNigerianNorthern EuropeanNorwegianOkinawanOsageOttawaPaiutePakistaniPalestinianPanamanianParaguayanPennsylvania GermanPeruvianPimaPolishPortuguesePotawatomiPuebloPuerto RicanPuget Sound SalishRomanianRussianSalvadoranSamoanScandinavianScotch-IrishScottishSeminoleSenegaleseSerbianShoshoneSierra LeoneanSiouxSlavicSlovakSloveneSomaliSouth AfricanSouth AmericanSouth American IndianSoviet UnionSpaniardSpanishSpanish AmericanSpanish American IndianSri LankanSubsaharan AfricanSudaneseSwedishSwissSyrianTaiwaneseThaiTlingit-HaidaTohono O'OdhamTonganTrinidadian and TobagonianTsimshianTurkishU.S. Virgin IslanderUgandanUkrainianUruguayanUteVenezuelanVietnameseWelshWest IndianYakamaYaquiYugoslavianYumanYup'ikZimbabwean
Immigration
NonimmigrantsImmigrantsAfghanistanAfricaAlbaniaArgentinaArmeniaAsiaAustraliaAustriaBahamasBangladeshBarbadosBelarusBelgiumBelizeBoliviaBosnia and HerzegovinaBrazilBulgariaBurma/MyanmarCabo VerdeCambodiaCameroonCanadaCaribbeanCentral AmericaChileChinaColombiaCongoCosta RicaCroatiaCubaCzechoslovakiaDenmarkDominicaDominican RepublicEastern AfricaEastern AsiaEastern EuropeEcuadorEgyptEl SalvadorEnglandEritreaEthiopiaEuropeFijiFranceGermanyGhanaGreeceGrenadaGuatemalaGuyanaHaitiHondurasHong KongHungaryIndiaIndonesiaIranIraqIrelandIsraelItalyJamaicaJapanJordanKazakhstanKenyaKoreaKuwaitLaosLatin AmericaLatviaLebanonLiberiaLithuaniaMalaysiaMexicoMicronesiaMiddle AfricaMoldovaMoroccoNepalNetherlandsNicaraguaNigeriaNorth AmericaNorth MacedoniaNorthern AfricaNorthern EuropeNorwayOceaniaPakistanPanamaPeruPhilippinesPolandPortugalRomaniaRussiaSaudi ArabiaScotlandSenegalSerbiaSierra LeoneSingaporeSomaliaSouth AfricaSouth AmericaSouth Central AsiaSouth Eastern AsiaSouthern EuropeSpainSri LankaSt. Vincent and the GrenadinesSudanSwedenSwitzerlandSyriaTaiwanTrinidad and TobagoTurkeyUgandaUkraineUruguayUzbekistanVenezuelaVietnamWest IndiesWestern AfricaWestern AsiaWestern EuropeYemenZaireZimbabweAzores
Disability Age 5 to 17
Income
Poverty
Unemployment
Labor Participation
Family Structure
Vehicle Availability
Education Level
Disability

Immigrants from Thailand Disability Age 5 to 17
Fair

5.7%
DISABILITY | AGE 5 TO 17
30.2/ 100
METRIC RATING
187th/ 347
METRIC RANK

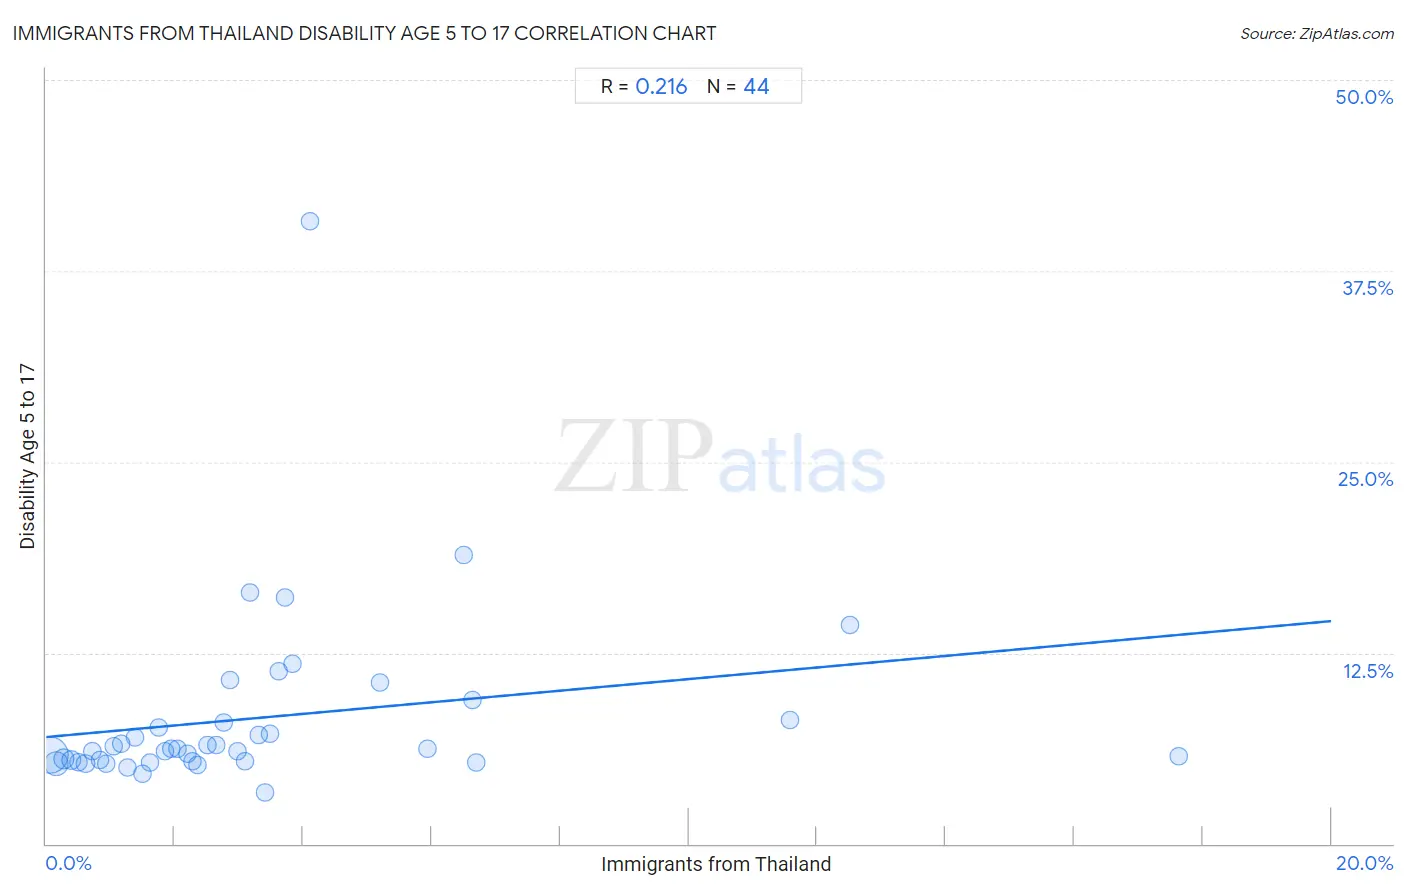
Immigrants from Thailand Disability Age 5 to 17 Correlation Chart

The statistical analysis conducted on geographies consisting of 315,092,447 people shows a weak positive correlation between the proportion of Immigrants from Thailand and percentage of population with a disability between the ages 5 and 17 in the United States with a correlation coefficient (R) of 0.216 and weighted average of 5.7%. On average, for every 1% (one percent) increase in Immigrants from Thailand within a typical geography, there is an increase of 0.38% in percentage of population with a disability between the ages 5 and 17.
Immigrants from Thailand Disability Age 5 to 17
It is essential to understand that the correlation between the percentage of Immigrants from Thailand and percentage of population with a disability between the ages 5 and 17 does not imply a direct cause-and-effect relationship. It remains uncertain whether the presence of Immigrants from Thailand influences an upward or downward trend in the level of percentage of population with a disability between the ages 5 and 17 within an area, or if Immigrants from Thailand simply ended up residing in those areas with higher or lower levels of percentage of population with a disability between the ages 5 and 17 due to other factors.

Demographics Similar to Immigrants from Thailand by Disability Age 5 to 17

In terms of disability age 5 to 17, the demographic groups most similar to Immigrants from Thailand are Fijian (5.7%, a difference of 0.090%), Marshallese (5.7%, a difference of 0.12%), Pueblo (5.7%, a difference of 0.16%), Immigrants from Eastern Africa (5.7%, a difference of 0.17%), and Syrian (5.6%, a difference of 0.20%).
DemographicsRating | RankDisability Age 5 to 17
Immigrants from Uruguay
37.7
/100
|
#180
Fair
5.6%
Immigrants from England
36.4
/100
|
#181
Fair
5.6%
Mexican American Indians
35.2
/100
|
#182
Fair
5.6%
Immigrants from Latin America
34.3
/100
|
#183
Fair
5.6%
Syrians
33.8
/100
|
#184
Fair
5.6%
Immigrants from Mexico
33.7
/100
|
#185
Fair
5.6%
Fijians
31.7
/100
|
#186
Fair
5.7%
Immigrants from Thailand
30.2
/100
|
#187
Fair
5.7%
Marshallese
28.1
/100
|
#188
Fair
5.7%
Pueblo
27.5
/100
|
#189
Fair
5.7%
Immigrants from Eastern Africa
27.3
/100
|
#190
Fair
5.7%
Danes
26.5
/100
|
#191
Fair
5.7%
Immigrants from Bosnia and Herzegovina
26.3
/100
|
#192
Fair
5.7%
Immigrants from Canada
26.1
/100
|
#193
Fair
5.7%
Croatians
23.6
/100
|
#194
Fair
5.7%

Immigrants from Thailand Disability Age 5 to 17 Correlation Summary

MeasurementImmigrants from Thailand DataDisability Age 5 to 17 Data
Minimum0.054%3.4%
Maximum17.6%40.7%
Range17.6%37.4%
Mean3.3%8.2%
Median2.4%6.2%
Interquartile 25% (IQ1)1.2%5.4%
Interquartile 75% (IQ3)3.7%8.0%
Interquartile Range (IQR)2.4%2.6%
Standard Deviation (Sample)3.4%6.1%
Standard Deviation (Population)3.4%6.0%

Correlation Details

Immigrants from Thailand PercentileSample SizeDisability Age 5 to 17
[
0.0%
-
0.5%
]
0.054%
196,306,9355.8%
[
0.0%
-
0.5%
]
0.16%
66,148,5615.2%
[
0.0%
-
0.5%
]
0.27%
23,435,8285.5%
[
0.0%
-
0.5%
]
0.38%
11,781,9905.5%
[
0.0%
-
0.5%
]
0.50%
5,995,7805.3%
[
0.5%
-
1.0%
]
0.61%
3,014,1185.2%
[
0.5%
-
1.0%
]
0.72%
2,316,8486.1%
[
0.5%
-
1.0%
]
0.83%
1,116,8205.5%
[
0.5%
-
1.0%
]
0.94%
671,8365.3%
[
1.0%
-
1.5%
]
1.06%
813,0066.4%
[
1.0%
-
1.5%
]
1.16%
469,9716.6%
[
1.0%
-
1.5%
]
1.27%
341,1325.0%
[
1.0%
-
1.5%
]
1.39%
504,4326.9%
[
1.5%
-
2.0%
]
1.51%
434,8544.6%
[
1.5%
-
2.0%
]
1.61%
187,3105.3%
[
1.5%
-
2.0%
]
1.76%
245,1617.6%
[
1.5%
-
2.0%
]
1.84%
102,2746.0%
[
1.5%
-
2.0%
]
1.95%
76,7546.2%
[
2.0%
-
2.5%
]
2.04%
164,0816.2%
[
2.0%
-
2.5%
]
2.19%
124,1375.9%
[
2.0%
-
2.5%
]
2.27%
87,0785.4%
[
2.0%
-
2.5%
]
2.35%
18,7355.2%
[
2.5%
-
3.0%
]
2.51%
13,6716.4%
[
2.5%
-
3.0%
]
2.65%
317,5016.4%
[
2.5%
-
3.0%
]
2.75%
23,5028.0%
[
2.5%
-
3.0%
]
2.85%
46,29810.7%
[
2.5%
-
3.0%
]
2.97%
60,4426.0%
[
3.0%
-
3.5%
]
3.09%
42,8805.4%
[
3.0%
-
3.5%
]
3.16%
66416.5%
[
3.0%
-
3.5%
]
3.30%
15,9897.1%
[
3.0%
-
3.5%
]
3.40%
1,1173.4%
[
3.0%
-
3.5%
]
3.49%
84,9857.2%
[
3.5%
-
4.0%
]
3.63%
17,00811.3%
[
3.5%
-
4.0%
]
3.71%
6,06516.1%
[
3.5%
-
4.0%
]
3.83%
3,49611.8%
[
4.0%
-
4.5%
]
4.10%
36640.7%
[
5.0%
-
5.5%
]
5.19%
28910.5%
[
5.5%
-
6.0%
]
5.93%
58,8076.2%
[
6.5%
-
7.0%
]
6.51%
1,04518.9%
[
6.5%
-
7.0%
]
6.63%
19,6139.4%
[
6.5%
-
7.0%
]
6.70%
19,5015.3%
[
11.5%
-
12.0%
]
11.57%
1,1328.1%
[
12.0%
-
12.5%
]
12.50%
3214.3%
[
17.5%
-
18.0%
]
17.62%
4035.7%