Korean Disability Age 5 to 17
COMPARE
Korean
Select to Compare
Disability Age 5 to 17
Korean Disability Age 5 to 17
5.1%
DISABILITY | AGE 5 TO 17
100.0/ 100
METRIC RATING
48th/ 347
METRIC RANK
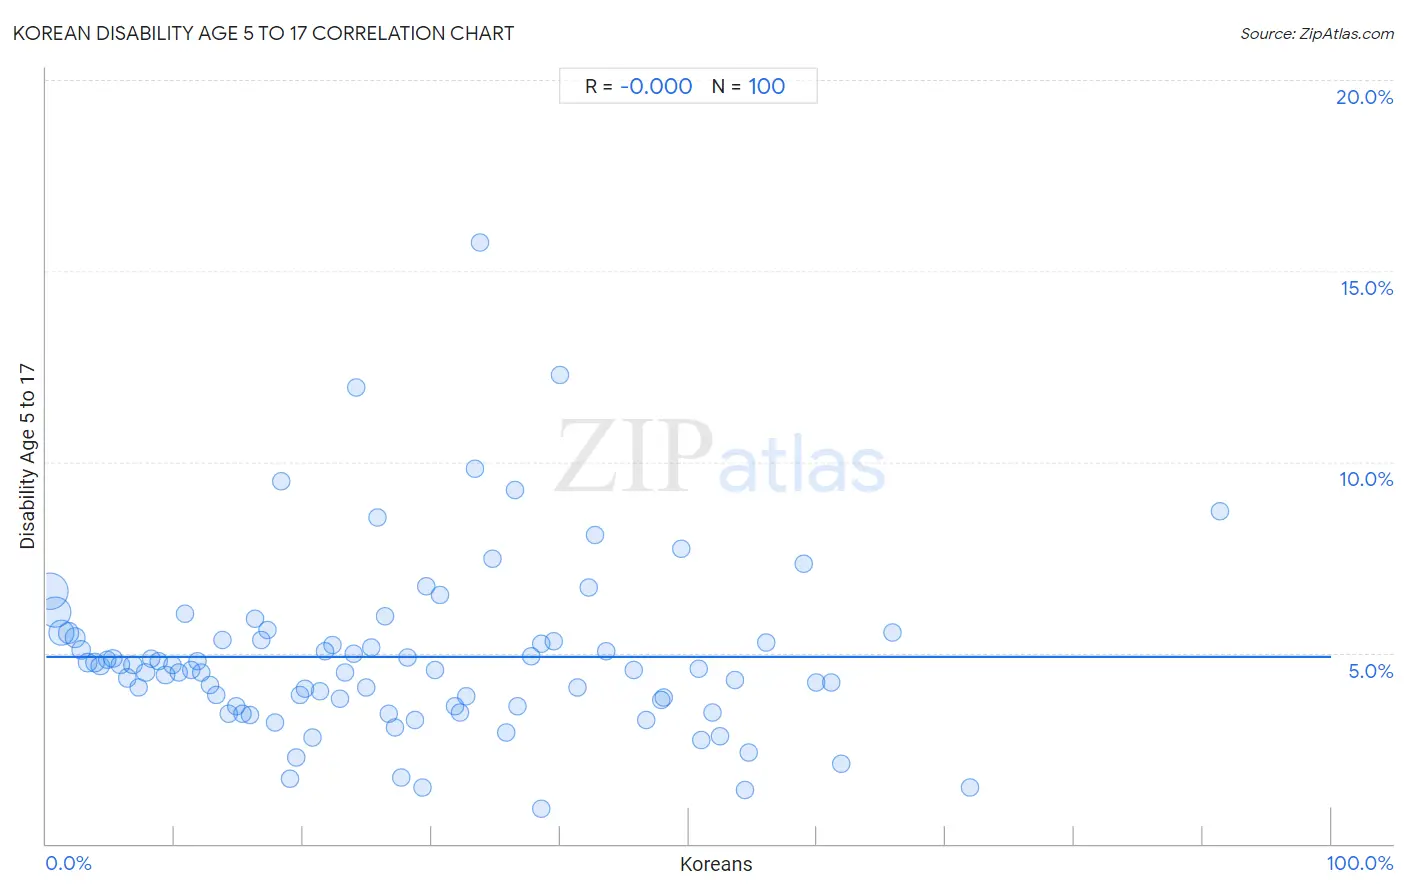
Korean Disability Age 5 to 17 Correlation Chart
The statistical analysis conducted on geographies consisting of 504,185,597 people shows no correlation between the proportion of Koreans and percentage of population with a disability between the ages 5 and 17 in the United States with a correlation coefficient (R) of -0.000 and weighted average of 5.1%. On average, for every 1% (one percent) increase in Koreans within a typical geography, there is a decrease of 0.00000% in percentage of population with a disability between the ages 5 and 17.
It is essential to understand that the correlation between the percentage of Koreans and percentage of population with a disability between the ages 5 and 17 does not imply a direct cause-and-effect relationship. It remains uncertain whether the presence of Koreans influences an upward or downward trend in the level of percentage of population with a disability between the ages 5 and 17 within an area, or if Koreans simply ended up residing in those areas with higher or lower levels of percentage of population with a disability between the ages 5 and 17 due to other factors.
Demographics Similar to Koreans by Disability Age 5 to 17
In terms of disability age 5 to 17, the demographic groups most similar to Koreans are Immigrants from Western Asia (5.1%, a difference of 0.080%), Vietnamese (5.1%, a difference of 0.18%), Assyrian/Chaldean/Syriac (5.0%, a difference of 0.31%), Tongan (5.0%, a difference of 0.38%), and Egyptian (5.0%, a difference of 0.45%).
| Demographics | Rating | Rank | Disability Age 5 to 17 |
| Immigrants from Australia | 100.0 /100 | #41 | Exceptional 5.0% |
| Immigrants from Sri Lanka | 100.0 /100 | #42 | Exceptional 5.0% |
| Immigrants from Russia | 100.0 /100 | #43 | Exceptional 5.0% |
| Egyptians | 100.0 /100 | #44 | Exceptional 5.0% |
| Tongans | 100.0 /100 | #45 | Exceptional 5.0% |
| Assyrians/Chaldeans/Syriacs | 100.0 /100 | #46 | Exceptional 5.0% |
| Vietnamese | 100.0 /100 | #47 | Exceptional 5.1% |
| Koreans | 100.0 /100 | #48 | Exceptional 5.1% |
| Immigrants from Western Asia | 100.0 /100 | #49 | Exceptional 5.1% |
| Argentineans | 99.9 /100 | #50 | Exceptional 5.1% |
| Turks | 99.9 /100 | #51 | Exceptional 5.1% |
| Immigrants from Fiji | 99.9 /100 | #52 | Exceptional 5.1% |
| Immigrants from Lithuania | 99.9 /100 | #53 | Exceptional 5.1% |
| Paraguayans | 99.9 /100 | #54 | Exceptional 5.1% |
| Laotians | 99.9 /100 | #55 | Exceptional 5.1% |
Korean Disability Age 5 to 17 Correlation Summary
| Measurement | Korean Data | Disability Age 5 to 17 Data |
| Minimum | 0.26% | 0.91% |
| Maximum | 91.3% | 15.7% |
| Range | 91.1% | 14.8% |
| Mean | 27.7% | 4.9% |
| Median | 25.1% | 4.6% |
| Interquartile 25% (IQ1) | 12.4% | 3.6% |
| Interquartile 75% (IQ3) | 39.7% | 5.4% |
| Interquartile Range (IQR) | 27.3% | 1.8% |
| Standard Deviation (Sample) | 18.8% | 2.3% |
| Standard Deviation (Population) | 18.7% | 2.3% |
Correlation Details
| Korean Percentile | Sample Size | Disability Age 5 to 17 |
[ 0.0% - 0.5% ] 0.26% | 180,024,288 | 6.6% |
[ 0.5% - 1.0% ] 0.71% | 127,190,749 | 6.1% |
[ 1.0% - 1.5% ] 1.21% | 68,596,461 | 5.5% |
[ 1.5% - 2.0% ] 1.72% | 26,773,221 | 5.5% |
[ 2.0% - 2.5% ] 2.25% | 21,004,848 | 5.4% |
[ 2.5% - 3.0% ] 2.73% | 13,746,618 | 5.1% |
[ 3.0% - 3.5% ] 3.23% | 9,789,118 | 4.7% |
[ 3.5% - 4.0% ] 3.78% | 11,532,701 | 4.7% |
[ 4.0% - 4.5% ] 4.21% | 6,631,860 | 4.7% |
[ 4.5% - 5.0% ] 4.74% | 4,804,459 | 4.8% |
[ 5.0% - 5.5% ] 5.19% | 5,198,512 | 4.8% |
[ 5.5% - 6.0% ] 5.76% | 4,701,758 | 4.7% |
[ 6.0% - 6.5% ] 6.28% | 3,671,067 | 4.3% |
[ 6.5% - 7.0% ] 6.74% | 3,902,807 | 4.7% |
[ 7.0% - 7.5% ] 7.23% | 1,643,242 | 4.1% |
[ 7.5% - 8.0% ] 7.73% | 1,017,642 | 4.5% |
[ 8.0% - 8.5% ] 8.18% | 2,039,129 | 4.8% |
[ 8.5% - 9.0% ] 8.72% | 1,390,232 | 4.8% |
[ 9.0% - 9.5% ] 9.29% | 1,258,715 | 4.4% |
[ 9.5% - 10.0% ] 9.79% | 713,772 | 4.7% |
[ 10.0% - 10.5% ] 10.34% | 497,157 | 4.5% |
[ 10.5% - 11.0% ] 10.77% | 450,760 | 6.0% |
[ 11.0% - 11.5% ] 11.25% | 612,565 | 4.6% |
[ 11.5% - 12.0% ] 11.80% | 551,096 | 4.8% |
[ 12.0% - 12.5% ] 12.08% | 190,209 | 4.5% |
[ 12.5% - 13.0% ] 12.77% | 333,627 | 4.1% |
[ 13.0% - 13.5% ] 13.22% | 175,378 | 3.9% |
[ 13.5% - 14.0% ] 13.68% | 436,686 | 5.3% |
[ 14.0% - 14.5% ] 14.18% | 569,963 | 3.4% |
[ 14.5% - 15.0% ] 14.78% | 117,039 | 3.6% |
[ 15.0% - 15.5% ] 15.29% | 372,130 | 3.4% |
[ 15.5% - 16.0% ] 15.81% | 185,200 | 3.4% |
[ 16.0% - 16.5% ] 16.23% | 122,336 | 5.9% |
[ 16.5% - 17.0% ] 16.69% | 70,214 | 5.4% |
[ 17.0% - 17.5% ] 17.25% | 240,460 | 5.6% |
[ 17.5% - 18.0% ] 17.76% | 147,666 | 3.2% |
[ 18.0% - 18.5% ] 18.25% | 38,682 | 9.5% |
[ 18.5% - 19.0% ] 18.95% | 59,697 | 1.7% |
[ 19.0% - 19.5% ] 19.41% | 10,307 | 2.2% |
[ 19.5% - 20.0% ] 19.72% | 546,156 | 3.9% |
[ 20.0% - 20.5% ] 20.09% | 137,937 | 4.1% |
[ 20.5% - 21.0% ] 20.70% | 52,935 | 2.8% |
[ 21.0% - 21.5% ] 21.34% | 179,148 | 4.0% |
[ 21.5% - 22.0% ] 21.73% | 180,711 | 5.0% |
[ 22.0% - 22.5% ] 22.29% | 171,335 | 5.2% |
[ 22.5% - 23.0% ] 22.84% | 245,194 | 3.8% |
[ 23.0% - 23.5% ] 23.22% | 146,930 | 4.5% |
[ 23.5% - 24.0% ] 23.97% | 4,397 | 5.0% |
[ 24.0% - 24.5% ] 24.11% | 7,930 | 12.0% |
[ 24.5% - 25.0% ] 24.87% | 104,256 | 4.1% |
[ 25.0% - 25.5% ] 25.32% | 69,337 | 5.2% |
[ 25.5% - 26.0% ] 25.78% | 57,639 | 8.6% |
[ 26.0% - 26.5% ] 26.35% | 28,564 | 5.9% |
[ 26.5% - 27.0% ] 26.69% | 19,744 | 3.4% |
[ 27.0% - 27.5% ] 27.14% | 56,225 | 3.0% |
[ 27.5% - 28.0% ] 27.62% | 45,724 | 1.7% |
[ 28.0% - 28.5% ] 28.12% | 79,785 | 4.9% |
[ 28.5% - 29.0% ] 28.71% | 54,847 | 3.2% |
[ 29.0% - 29.5% ] 29.29% | 17,819 | 1.5% |
[ 29.5% - 30.0% ] 29.54% | 60,936 | 6.8% |
[ 30.0% - 30.5% ] 30.25% | 64,561 | 4.5% |
[ 30.5% - 31.0% ] 30.67% | 45,388 | 6.5% |
[ 31.5% - 32.0% ] 31.79% | 114,846 | 3.6% |
[ 32.0% - 32.5% ] 32.22% | 149,182 | 3.4% |
[ 32.5% - 33.0% ] 32.72% | 162,383 | 3.9% |
[ 33.0% - 33.5% ] 33.36% | 7,363 | 9.8% |
[ 33.5% - 34.0% ] 33.74% | 4,721 | 15.7% |
[ 34.5% - 35.0% ] 34.74% | 2,896 | 7.5% |
[ 35.5% - 36.0% ] 35.84% | 24,950 | 2.9% |
[ 36.0% - 36.5% ] 36.46% | 1,629 | 9.3% |
[ 36.5% - 37.0% ] 36.63% | 24,982 | 3.6% |
[ 37.5% - 38.0% ] 37.77% | 26,169 | 4.9% |
[ 38.0% - 38.5% ] 38.49% | 12,906 | 0.91% |
[ 38.5% - 39.0% ] 38.53% | 6,419 | 5.2% |
[ 39.0% - 39.5% ] 39.49% | 1,023 | 5.3% |
[ 39.5% - 40.0% ] 39.96% | 548 | 12.3% |
[ 41.0% - 41.5% ] 41.37% | 17,400 | 4.1% |
[ 42.0% - 42.5% ] 42.22% | 5,393 | 6.7% |
[ 42.5% - 43.0% ] 42.74% | 3,053 | 8.1% |
[ 43.5% - 44.0% ] 43.57% | 3,576 | 5.0% |
[ 45.5% - 46.0% ] 45.69% | 4,342 | 4.6% |
[ 46.5% - 47.0% ] 46.69% | 59,008 | 3.2% |
[ 47.5% - 48.0% ] 47.85% | 82,504 | 3.8% |
[ 48.0% - 48.5% ] 48.05% | 17,604 | 3.8% |
[ 49.0% - 49.5% ] 49.39% | 2,290 | 7.7% |
[ 50.5% - 51.0% ] 50.78% | 27,198 | 4.6% |
[ 51.0% - 51.5% ] 51.00% | 27,972 | 2.7% |
[ 51.5% - 52.0% ] 51.88% | 6,469 | 3.4% |
[ 52.0% - 52.5% ] 52.44% | 25,902 | 2.8% |
[ 53.5% - 54.0% ] 53.63% | 17,137 | 4.3% |
[ 54.0% - 54.5% ] 54.42% | 5,026 | 1.4% |
[ 54.5% - 55.0% ] 54.63% | 3,174 | 2.4% |
[ 56.0% - 56.5% ] 56.07% | 72,605 | 5.3% |
[ 58.5% - 59.0% ] 58.91% | 1,290 | 7.3% |
[ 59.5% - 60.0% ] 59.90% | 2,299 | 4.2% |
[ 61.0% - 61.5% ] 61.06% | 2,255 | 4.2% |
[ 61.5% - 62.0% ] 61.89% | 19,795 | 2.1% |
[ 65.5% - 66.0% ] 65.90% | 39,873 | 5.5% |
[ 71.5% - 72.0% ] 71.88% | 6,550 | 1.5% |
[ 91.0% - 91.5% ] 91.32% | 2,996 | 8.7% |