Syrian Disability Age 5 to 17

COMPARE

Syrian
Race
Ancestry
AfghanAfricanAlaska NativeAlaskan AthabascanAlbanianAleutAlsatianAmericanApacheArabArapahoArgentineanArmenianAssyrian/Chaldean/SyriacAustralianAustrianBahamianBangladeshiBarbadianBasqueBelgianBelizeanBermudanBhutaneseBlackfeetBolivianBrazilianBritishBritish West IndianBulgarianBurmeseCajunCambodianCanadianCape VerdeanCarpatho RusynCelticCentral AmericanCentral American IndianCherokeeCheyenneChickasawChileanChineseChippewaChoctawColombianColvilleComancheCosta RicanCreeCreekCroatianCrowCubanCypriotCzechCzechoslovakianDanishDelawareDominicanDutchDutch West IndianEastern EuropeanEcuadorianEgyptianEnglishEstonianEthiopianEuropeanFijianFilipinoFinnishFrenchFrench American IndianFrench CanadianGermanGerman RussianGhanaianGreekGuamanian/ChamorroGuatemalanGuyaneseHaitianHmongHonduranHopiHoumaHungarianIcelanderIndian (Asian)IndonesianInupiatIranianIraqiIrishIroquoisIsraeliItalianJamaicanJapaneseJordanianKenyanKiowaKoreanLaotianLatvianLebaneseLiberianLithuanianLumbeeLuxembourgerMacedonianMalaysianMalteseMarshalleseMenomineeMexicanMexican American IndianMongolianMoroccanNative HawaiianNavajoNepaleseNew ZealanderNicaraguanNigerianNorthern EuropeanNorwegianOkinawanOsageOttawaPaiutePakistaniPalestinianPanamanianParaguayanPennsylvania GermanPeruvianPimaPolishPortuguesePotawatomiPuebloPuerto RicanPuget Sound SalishRomanianRussianSalvadoranSamoanScandinavianScotch-IrishScottishSeminoleSenegaleseSerbianShoshoneSierra LeoneanSiouxSlavicSlovakSloveneSomaliSouth AfricanSouth AmericanSouth American IndianSoviet UnionSpaniardSpanishSpanish AmericanSpanish American IndianSri LankanSubsaharan AfricanSudaneseSwedishSwissSyrianTaiwaneseThaiTlingit-HaidaTohono O'OdhamTonganTrinidadian and TobagonianTsimshianTurkishU.S. Virgin IslanderUgandanUkrainianUruguayanUteVenezuelanVietnameseWelshWest IndianYakamaYaquiYugoslavianYumanYup'ikZimbabwean
Immigration
NonimmigrantsImmigrantsAfghanistanAfricaAlbaniaArgentinaArmeniaAsiaAustraliaAustriaBahamasBangladeshBarbadosBelarusBelgiumBelizeBoliviaBosnia and HerzegovinaBrazilBulgariaBurma/MyanmarCabo VerdeCambodiaCameroonCanadaCaribbeanCentral AmericaChileChinaColombiaCongoCosta RicaCroatiaCubaCzechoslovakiaDenmarkDominicaDominican RepublicEastern AfricaEastern AsiaEastern EuropeEcuadorEgyptEl SalvadorEnglandEritreaEthiopiaEuropeFijiFranceGermanyGhanaGreeceGrenadaGuatemalaGuyanaHaitiHondurasHong KongHungaryIndiaIndonesiaIranIraqIrelandIsraelItalyJamaicaJapanJordanKazakhstanKenyaKoreaKuwaitLaosLatin AmericaLatviaLebanonLiberiaLithuaniaMalaysiaMexicoMicronesiaMiddle AfricaMoldovaMoroccoNepalNetherlandsNicaraguaNigeriaNorth AmericaNorth MacedoniaNorthern AfricaNorthern EuropeNorwayOceaniaPakistanPanamaPeruPhilippinesPolandPortugalRomaniaRussiaSaudi ArabiaScotlandSenegalSerbiaSierra LeoneSingaporeSomaliaSouth AfricaSouth AmericaSouth Central AsiaSouth Eastern AsiaSouthern EuropeSpainSri LankaSt. Vincent and the GrenadinesSudanSwedenSwitzerlandSyriaTaiwanThailandTrinidad and TobagoTurkeyUgandaUkraineUruguayUzbekistanVenezuelaVietnamWest IndiesWestern AfricaWestern AsiaWestern EuropeYemenZaireZimbabweAzores
Select to Compare
Race
Ancestry
AfghanAfricanAlaska NativeAlaskan AthabascanAlbanianAleutAlsatianAmericanApacheArabArapahoArgentineanArmenianAssyrian/Chaldean/SyriacAustralianAustrianBahamianBangladeshiBarbadianBasqueBelgianBelizeanBermudanBhutaneseBlackfeetBolivianBrazilianBritishBritish West IndianBulgarianBurmeseCajunCambodianCanadianCape VerdeanCarpatho RusynCelticCentral AmericanCentral American IndianCherokeeCheyenneChickasawChileanChineseChippewaChoctawColombianColvilleComancheCosta RicanCreeCreekCroatianCrowCubanCypriotCzechCzechoslovakianDanishDelawareDominicanDutchDutch West IndianEastern EuropeanEcuadorianEgyptianEnglishEstonianEthiopianEuropeanFijianFilipinoFinnishFrenchFrench American IndianFrench CanadianGermanGerman RussianGhanaianGreekGuamanian/ChamorroGuatemalanGuyaneseHaitianHmongHonduranHopiHoumaHungarianIcelanderIndian (Asian)IndonesianInupiatIranianIraqiIrishIroquoisIsraeliItalianJamaicanJapaneseJordanianKenyanKiowaKoreanLaotianLatvianLebaneseLiberianLithuanianLumbeeLuxembourgerMacedonianMalaysianMalteseMarshalleseMenomineeMexicanMexican American IndianMongolianMoroccanNative HawaiianNavajoNepaleseNew ZealanderNicaraguanNigerianNorthern EuropeanNorwegianOkinawanOsageOttawaPaiutePakistaniPalestinianPanamanianParaguayanPennsylvania GermanPeruvianPimaPolishPortuguesePotawatomiPuebloPuerto RicanPuget Sound SalishRomanianRussianSalvadoranSamoanScandinavianScotch-IrishScottishSeminoleSenegaleseSerbianShoshoneSierra LeoneanSiouxSlavicSlovakSloveneSomaliSouth AfricanSouth AmericanSouth American IndianSoviet UnionSpaniardSpanishSpanish AmericanSpanish American IndianSri LankanSubsaharan AfricanSudaneseSwedishSwissTaiwaneseThaiTlingit-HaidaTohono O'OdhamTonganTrinidadian and TobagonianTsimshianTurkishU.S. Virgin IslanderUgandanUkrainianUruguayanUteVenezuelanVietnameseWelshWest IndianYakamaYaquiYugoslavianYumanYup'ikZimbabwean
Immigration
NonimmigrantsImmigrantsAfghanistanAfricaAlbaniaArgentinaArmeniaAsiaAustraliaAustriaBahamasBangladeshBarbadosBelarusBelgiumBelizeBoliviaBosnia and HerzegovinaBrazilBulgariaBurma/MyanmarCabo VerdeCambodiaCameroonCanadaCaribbeanCentral AmericaChileChinaColombiaCongoCosta RicaCroatiaCubaCzechoslovakiaDenmarkDominicaDominican RepublicEastern AfricaEastern AsiaEastern EuropeEcuadorEgyptEl SalvadorEnglandEritreaEthiopiaEuropeFijiFranceGermanyGhanaGreeceGrenadaGuatemalaGuyanaHaitiHondurasHong KongHungaryIndiaIndonesiaIranIraqIrelandIsraelItalyJamaicaJapanJordanKazakhstanKenyaKoreaKuwaitLaosLatin AmericaLatviaLebanonLiberiaLithuaniaMalaysiaMexicoMicronesiaMiddle AfricaMoldovaMoroccoNepalNetherlandsNicaraguaNigeriaNorth AmericaNorth MacedoniaNorthern AfricaNorthern EuropeNorwayOceaniaPakistanPanamaPeruPhilippinesPolandPortugalRomaniaRussiaSaudi ArabiaScotlandSenegalSerbiaSierra LeoneSingaporeSomaliaSouth AfricaSouth AmericaSouth Central AsiaSouth Eastern AsiaSouthern EuropeSpainSri LankaSt. Vincent and the GrenadinesSudanSwedenSwitzerlandSyriaTaiwanThailandTrinidad and TobagoTurkeyUgandaUkraineUruguayUzbekistanVenezuelaVietnamWest IndiesWestern AfricaWestern AsiaWestern EuropeYemenZaireZimbabweAzores
Disability Age 5 to 17
Income
Poverty
Unemployment
Labor Participation
Family Structure
Vehicle Availability
Education Level
Disability

Syrian Disability Age 5 to 17
Fair

5.6%
DISABILITY | AGE 5 TO 17
33.8/ 100
METRIC RATING
184th/ 347
METRIC RANK

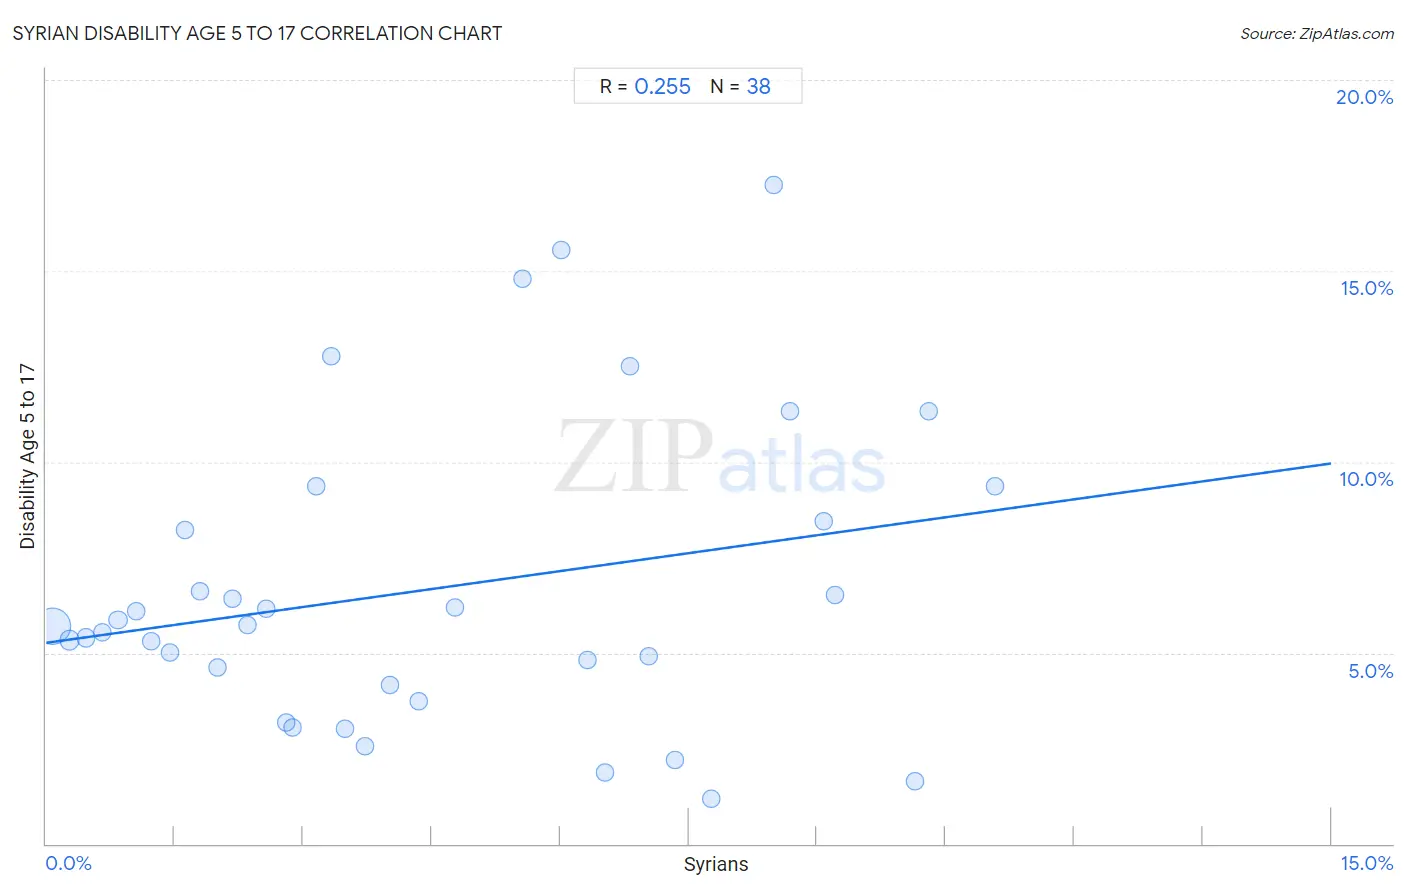
Syrian Disability Age 5 to 17 Correlation Chart

The statistical analysis conducted on geographies consisting of 264,557,507 people shows a weak positive correlation between the proportion of Syrians and percentage of population with a disability between the ages 5 and 17 in the United States with a correlation coefficient (R) of 0.255 and weighted average of 5.6%. On average, for every 1% (one percent) increase in Syrians within a typical geography, there is an increase of 0.31% in percentage of population with a disability between the ages 5 and 17.
Syrian Disability Age 5 to 17
It is essential to understand that the correlation between the percentage of Syrians and percentage of population with a disability between the ages 5 and 17 does not imply a direct cause-and-effect relationship. It remains uncertain whether the presence of Syrians influences an upward or downward trend in the level of percentage of population with a disability between the ages 5 and 17 within an area, or if Syrians simply ended up residing in those areas with higher or lower levels of percentage of population with a disability between the ages 5 and 17 due to other factors.

Demographics Similar to Syrians by Disability Age 5 to 17

In terms of disability age 5 to 17, the demographic groups most similar to Syrians are Immigrants from Mexico (5.6%, a difference of 0.010%), Immigrants from Latin America (5.6%, a difference of 0.020%), Mexican American Indian (5.6%, a difference of 0.080%), Fijian (5.7%, a difference of 0.12%), and Immigrants from England (5.6%, a difference of 0.14%).
DemographicsRating | RankDisability Age 5 to 17
Immigrants from Western Europe
47.8
/100
|
#177
Average
5.6%
Immigrants from Trinidad and Tobago
47.6
/100
|
#178
Average
5.6%
Immigrants from Barbados
40.5
/100
|
#179
Average
5.6%
Immigrants from Uruguay
37.7
/100
|
#180
Fair
5.6%
Immigrants from England
36.4
/100
|
#181
Fair
5.6%
Mexican American Indians
35.2
/100
|
#182
Fair
5.6%
Immigrants from Latin America
34.3
/100
|
#183
Fair
5.6%
Syrians
33.8
/100
|
#184
Fair
5.6%
Immigrants from Mexico
33.7
/100
|
#185
Fair
5.6%
Fijians
31.7
/100
|
#186
Fair
5.7%
Immigrants from Thailand
30.2
/100
|
#187
Fair
5.7%
Marshallese
28.1
/100
|
#188
Fair
5.7%
Pueblo
27.5
/100
|
#189
Fair
5.7%
Immigrants from Eastern Africa
27.3
/100
|
#190
Fair
5.7%
Danes
26.5
/100
|
#191
Fair
5.7%

Syrian Disability Age 5 to 17 Correlation Summary

MeasurementSyrian DataDisability Age 5 to 17 Data
Minimum0.066%1.2%
Maximum11.1%17.2%
Range11.0%16.1%
Mean4.5%6.7%
Median3.6%5.7%
Interquartile 25% (IQ1)1.8%4.2%
Interquartile 75% (IQ3)7.0%8.4%
Interquartile Range (IQR)5.2%4.3%
Standard Deviation (Sample)3.2%4.0%
Standard Deviation (Population)3.2%3.9%

Correlation Details

Syrian PercentileSample SizeDisability Age 5 to 17
[
0.0%
-
0.5%
]
0.066%
222,695,9345.7%
[
0.0%
-
0.5%
]
0.27%
25,816,8135.3%
[
0.0%
-
0.5%
]
0.46%
7,332,8065.4%
[
0.5%
-
1.0%
]
0.65%
3,523,3465.5%
[
0.5%
-
1.0%
]
0.84%
1,659,9145.9%
[
1.0%
-
1.5%
]
1.05%
1,463,2046.1%
[
1.0%
-
1.5%
]
1.22%
622,0465.3%
[
1.0%
-
1.5%
]
1.44%
393,3975.0%
[
1.5%
-
2.0%
]
1.62%
220,0938.2%
[
1.5%
-
2.0%
]
1.79%
133,5386.6%
[
1.5%
-
2.0%
]
2.00%
125,4834.6%
[
2.0%
-
2.5%
]
2.17%
95,8466.4%
[
2.0%
-
2.5%
]
2.35%
51,6275.7%
[
2.5%
-
3.0%
]
2.57%
171,5606.2%
[
2.5%
-
3.0%
]
2.81%
11,3243.2%
[
2.5%
-
3.0%
]
2.87%
28,3623.0%
[
3.0%
-
3.5%
]
3.15%
5,2769.4%
[
3.0%
-
3.5%
]
3.33%
23,74312.8%
[
3.0%
-
3.5%
]
3.49%
18,6403.0%
[
3.5%
-
4.0%
]
3.73%
6,4152.6%
[
4.0%
-
4.5%
]
4.01%
16,0714.2%
[
4.0%
-
4.5%
]
4.34%
11,3723.7%
[
4.5%
-
5.0%
]
4.77%
43,6076.2%
[
5.5%
-
6.0%
]
5.56%
5,41614.8%
[
6.0%
-
6.5%
]
6.01%
5,00715.5%
[
6.0%
-
6.5%
]
6.32%
1,5514.8%
[
6.5%
-
7.0%
]
6.52%
1,8111.9%
[
6.5%
-
7.0%
]
6.82%
4412.5%
[
7.0%
-
7.5%
]
7.03%
17,0944.9%
[
7.0%
-
7.5%
]
7.34%
2,3422.2%
[
7.5%
-
8.0%
]
7.76%
4381.2%
[
8.0%
-
8.5%
]
8.50%
41217.2%
[
8.5%
-
9.0%
]
8.68%
64511.3%
[
9.0%
-
9.5%
]
9.08%
16,3588.4%
[
9.0%
-
9.5%
]
9.21%
29,2866.5%
[
10.0%
-
10.5%
]
10.14%
2,9981.6%
[
10.0%
-
10.5%
]
10.30%
72811.3%
[
11.0%
-
11.5%
]
11.08%
2,9609.4%