Tongan Disability Age 5 to 17

COMPARE

Tongan
Race
Ancestry
AfghanAfricanAlaska NativeAlaskan AthabascanAlbanianAleutAlsatianAmericanApacheArabArapahoArgentineanArmenianAssyrian/Chaldean/SyriacAustralianAustrianBahamianBangladeshiBarbadianBasqueBelgianBelizeanBermudanBhutaneseBlackfeetBolivianBrazilianBritishBritish West IndianBulgarianBurmeseCajunCambodianCanadianCape VerdeanCarpatho RusynCelticCentral AmericanCentral American IndianCherokeeCheyenneChickasawChileanChineseChippewaChoctawColombianColvilleComancheCosta RicanCreeCreekCroatianCrowCubanCypriotCzechCzechoslovakianDanishDelawareDominicanDutchDutch West IndianEastern EuropeanEcuadorianEgyptianEnglishEstonianEthiopianEuropeanFijianFilipinoFinnishFrenchFrench American IndianFrench CanadianGermanGerman RussianGhanaianGreekGuamanian/ChamorroGuatemalanGuyaneseHaitianHmongHonduranHopiHoumaHungarianIcelanderIndian (Asian)IndonesianInupiatIranianIraqiIrishIroquoisIsraeliItalianJamaicanJapaneseJordanianKenyanKiowaKoreanLaotianLatvianLebaneseLiberianLithuanianLumbeeLuxembourgerMacedonianMalaysianMalteseMarshalleseMenomineeMexicanMexican American IndianMongolianMoroccanNative HawaiianNavajoNepaleseNew ZealanderNicaraguanNigerianNorthern EuropeanNorwegianOkinawanOsageOttawaPaiutePakistaniPalestinianPanamanianParaguayanPennsylvania GermanPeruvianPimaPolishPortuguesePotawatomiPuebloPuerto RicanPuget Sound SalishRomanianRussianSalvadoranSamoanScandinavianScotch-IrishScottishSeminoleSenegaleseSerbianShoshoneSierra LeoneanSiouxSlavicSlovakSloveneSomaliSouth AfricanSouth AmericanSouth American IndianSoviet UnionSpaniardSpanishSpanish AmericanSpanish American IndianSri LankanSubsaharan AfricanSudaneseSwedishSwissSyrianTaiwaneseThaiTlingit-HaidaTohono O'OdhamTonganTrinidadian and TobagonianTsimshianTurkishU.S. Virgin IslanderUgandanUkrainianUruguayanUteVenezuelanVietnameseWelshWest IndianYakamaYaquiYugoslavianYumanYup'ikZimbabwean
Immigration
NonimmigrantsImmigrantsAfghanistanAfricaAlbaniaArgentinaArmeniaAsiaAustraliaAustriaBahamasBangladeshBarbadosBelarusBelgiumBelizeBoliviaBosnia and HerzegovinaBrazilBulgariaBurma/MyanmarCabo VerdeCambodiaCameroonCanadaCaribbeanCentral AmericaChileChinaColombiaCongoCosta RicaCroatiaCubaCzechoslovakiaDenmarkDominicaDominican RepublicEastern AfricaEastern AsiaEastern EuropeEcuadorEgyptEl SalvadorEnglandEritreaEthiopiaEuropeFijiFranceGermanyGhanaGreeceGrenadaGuatemalaGuyanaHaitiHondurasHong KongHungaryIndiaIndonesiaIranIraqIrelandIsraelItalyJamaicaJapanJordanKazakhstanKenyaKoreaKuwaitLaosLatin AmericaLatviaLebanonLiberiaLithuaniaMalaysiaMexicoMicronesiaMiddle AfricaMoldovaMoroccoNepalNetherlandsNicaraguaNigeriaNorth AmericaNorth MacedoniaNorthern AfricaNorthern EuropeNorwayOceaniaPakistanPanamaPeruPhilippinesPolandPortugalRomaniaRussiaSaudi ArabiaScotlandSenegalSerbiaSierra LeoneSingaporeSomaliaSouth AfricaSouth AmericaSouth Central AsiaSouth Eastern AsiaSouthern EuropeSpainSri LankaSt. Vincent and the GrenadinesSudanSwedenSwitzerlandSyriaTaiwanThailandTrinidad and TobagoTurkeyUgandaUkraineUruguayUzbekistanVenezuelaVietnamWest IndiesWestern AfricaWestern AsiaWestern EuropeYemenZaireZimbabweAzores
Select to Compare
Race
Ancestry
AfghanAfricanAlaska NativeAlaskan AthabascanAlbanianAleutAlsatianAmericanApacheArabArapahoArgentineanArmenianAssyrian/Chaldean/SyriacAustralianAustrianBahamianBangladeshiBarbadianBasqueBelgianBelizeanBermudanBhutaneseBlackfeetBolivianBrazilianBritishBritish West IndianBulgarianBurmeseCajunCambodianCanadianCape VerdeanCarpatho RusynCelticCentral AmericanCentral American IndianCherokeeCheyenneChickasawChileanChineseChippewaChoctawColombianColvilleComancheCosta RicanCreeCreekCroatianCrowCubanCypriotCzechCzechoslovakianDanishDelawareDominicanDutchDutch West IndianEastern EuropeanEcuadorianEgyptianEnglishEstonianEthiopianEuropeanFijianFilipinoFinnishFrenchFrench American IndianFrench CanadianGermanGerman RussianGhanaianGreekGuamanian/ChamorroGuatemalanGuyaneseHaitianHmongHonduranHopiHoumaHungarianIcelanderIndian (Asian)IndonesianInupiatIranianIraqiIrishIroquoisIsraeliItalianJamaicanJapaneseJordanianKenyanKiowaKoreanLaotianLatvianLebaneseLiberianLithuanianLumbeeLuxembourgerMacedonianMalaysianMalteseMarshalleseMenomineeMexicanMexican American IndianMongolianMoroccanNative HawaiianNavajoNepaleseNew ZealanderNicaraguanNigerianNorthern EuropeanNorwegianOkinawanOsageOttawaPaiutePakistaniPalestinianPanamanianParaguayanPennsylvania GermanPeruvianPimaPolishPortuguesePotawatomiPuebloPuerto RicanPuget Sound SalishRomanianRussianSalvadoranSamoanScandinavianScotch-IrishScottishSeminoleSenegaleseSerbianShoshoneSierra LeoneanSiouxSlavicSlovakSloveneSomaliSouth AfricanSouth AmericanSouth American IndianSoviet UnionSpaniardSpanishSpanish AmericanSpanish American IndianSri LankanSubsaharan AfricanSudaneseSwedishSwissSyrianTaiwaneseThaiTlingit-HaidaTohono O'OdhamTrinidadian and TobagonianTsimshianTurkishU.S. Virgin IslanderUgandanUkrainianUruguayanUteVenezuelanVietnameseWelshWest IndianYakamaYaquiYugoslavianYumanYup'ikZimbabwean
Immigration
NonimmigrantsImmigrantsAfghanistanAfricaAlbaniaArgentinaArmeniaAsiaAustraliaAustriaBahamasBangladeshBarbadosBelarusBelgiumBelizeBoliviaBosnia and HerzegovinaBrazilBulgariaBurma/MyanmarCabo VerdeCambodiaCameroonCanadaCaribbeanCentral AmericaChileChinaColombiaCongoCosta RicaCroatiaCubaCzechoslovakiaDenmarkDominicaDominican RepublicEastern AfricaEastern AsiaEastern EuropeEcuadorEgyptEl SalvadorEnglandEritreaEthiopiaEuropeFijiFranceGermanyGhanaGreeceGrenadaGuatemalaGuyanaHaitiHondurasHong KongHungaryIndiaIndonesiaIranIraqIrelandIsraelItalyJamaicaJapanJordanKazakhstanKenyaKoreaKuwaitLaosLatin AmericaLatviaLebanonLiberiaLithuaniaMalaysiaMexicoMicronesiaMiddle AfricaMoldovaMoroccoNepalNetherlandsNicaraguaNigeriaNorth AmericaNorth MacedoniaNorthern AfricaNorthern EuropeNorwayOceaniaPakistanPanamaPeruPhilippinesPolandPortugalRomaniaRussiaSaudi ArabiaScotlandSenegalSerbiaSierra LeoneSingaporeSomaliaSouth AfricaSouth AmericaSouth Central AsiaSouth Eastern AsiaSouthern EuropeSpainSri LankaSt. Vincent and the GrenadinesSudanSwedenSwitzerlandSyriaTaiwanThailandTrinidad and TobagoTurkeyUgandaUkraineUruguayUzbekistanVenezuelaVietnamWest IndiesWestern AfricaWestern AsiaWestern EuropeYemenZaireZimbabweAzores
Disability Age 5 to 17
Income
Poverty
Unemployment
Labor Participation
Family Structure
Vehicle Availability
Education Level
Disability

Tongan Disability Age 5 to 17
Exceptional

5.0%
DISABILITY | AGE 5 TO 17
100.0/ 100
METRIC RATING
45th/ 347
METRIC RANK

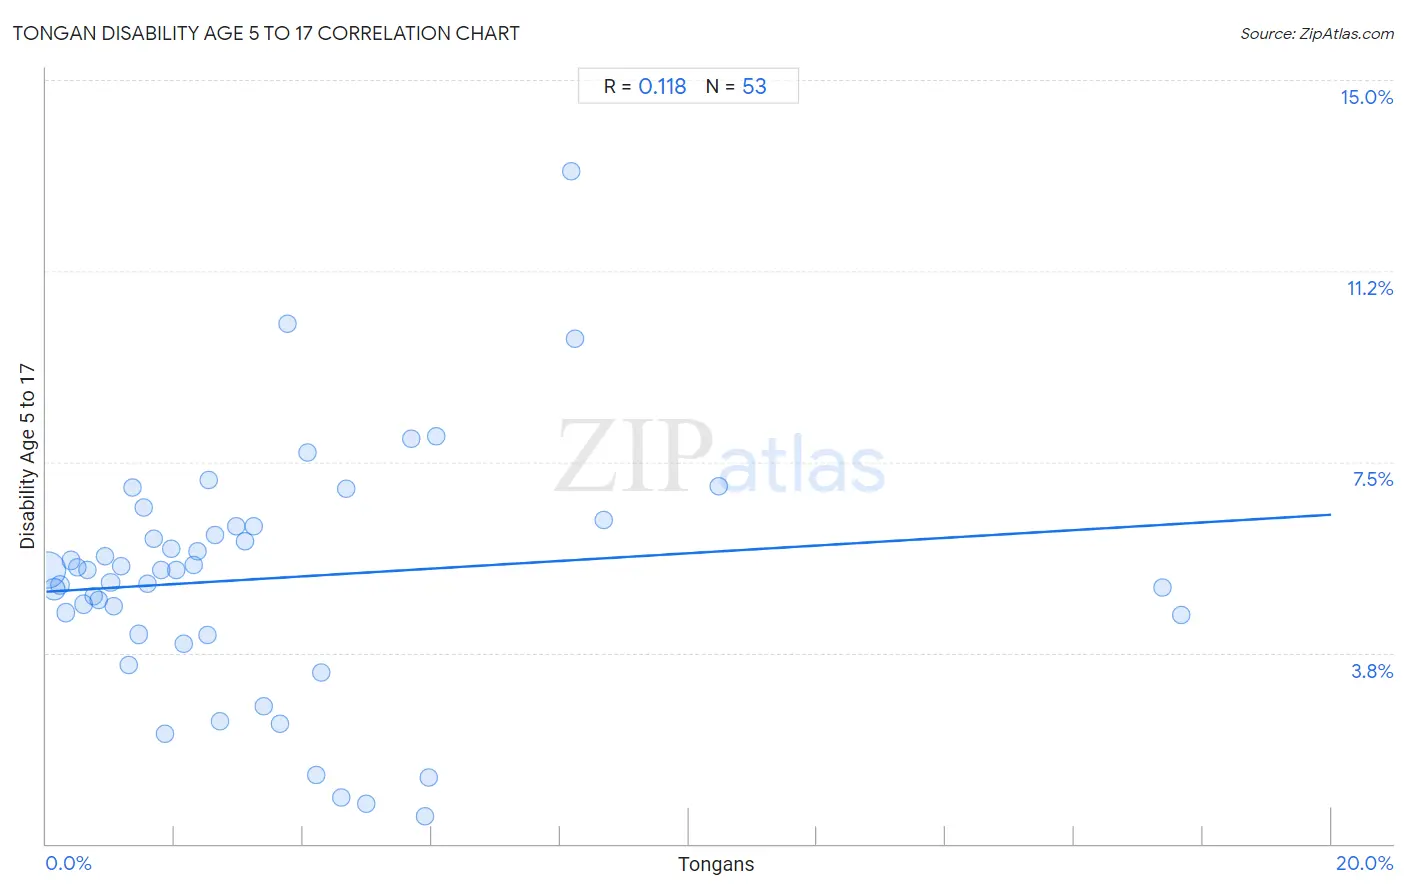
Tongan Disability Age 5 to 17 Correlation Chart

The statistical analysis conducted on geographies consisting of 102,679,280 people shows a poor positive correlation between the proportion of Tongans and percentage of population with a disability between the ages 5 and 17 in the United States with a correlation coefficient (R) of 0.118 and weighted average of 5.0%. On average, for every 1% (one percent) increase in Tongans within a typical geography, there is an increase of 0.076% in percentage of population with a disability between the ages 5 and 17.
Tongan Disability Age 5 to 17
It is essential to understand that the correlation between the percentage of Tongans and percentage of population with a disability between the ages 5 and 17 does not imply a direct cause-and-effect relationship. It remains uncertain whether the presence of Tongans influences an upward or downward trend in the level of percentage of population with a disability between the ages 5 and 17 within an area, or if Tongans simply ended up residing in those areas with higher or lower levels of percentage of population with a disability between the ages 5 and 17 due to other factors.

Demographics Similar to Tongans by Disability Age 5 to 17

In terms of disability age 5 to 17, the demographic groups most similar to Tongans are Egyptian (5.0%, a difference of 0.070%), Assyrian/Chaldean/Syriac (5.0%, a difference of 0.070%), Immigrants from Russia (5.0%, a difference of 0.11%), Vietnamese (5.1%, a difference of 0.19%), and Korean (5.1%, a difference of 0.38%).
DemographicsRating | RankDisability Age 5 to 17
Immigrants from Philippines
100.0
/100
|
#38
Exceptional
5.0%
Immigrants from Argentina
100.0
/100
|
#39
Exceptional
5.0%
Okinawans
100.0
/100
|
#40
Exceptional
5.0%
Immigrants from Australia
100.0
/100
|
#41
Exceptional
5.0%
Immigrants from Sri Lanka
100.0
/100
|
#42
Exceptional
5.0%
Immigrants from Russia
100.0
/100
|
#43
Exceptional
5.0%
Egyptians
100.0
/100
|
#44
Exceptional
5.0%
Tongans
100.0
/100
|
#45
Exceptional
5.0%
Assyrians/Chaldeans/Syriacs
100.0
/100
|
#46
Exceptional
5.0%
Vietnamese
100.0
/100
|
#47
Exceptional
5.1%
Koreans
100.0
/100
|
#48
Exceptional
5.1%
Immigrants from Western Asia
100.0
/100
|
#49
Exceptional
5.1%
Argentineans
99.9
/100
|
#50
Exceptional
5.1%
Turks
99.9
/100
|
#51
Exceptional
5.1%
Immigrants from Fiji
99.9
/100
|
#52
Exceptional
5.1%

Tongan Disability Age 5 to 17 Correlation Summary

MeasurementTongan DataDisability Age 5 to 17 Data
Minimum0.023%0.54%
Maximum17.7%13.2%
Range17.6%12.7%
Mean3.5%5.2%
Median2.4%5.4%
Interquartile 25% (IQ1)1.1%4.1%
Interquartile 75% (IQ3)4.4%6.2%
Interquartile Range (IQR)3.3%2.1%
Standard Deviation (Sample)3.7%2.4%
Standard Deviation (Population)3.6%2.3%

Correlation Details

Tongan PercentileSample SizeDisability Age 5 to 17
[
0.0%
-
0.5%
]
0.023%
74,384,5775.4%
[
0.0%
-
0.5%
]
0.13%
10,572,1315.0%
[
0.0%
-
0.5%
]
0.22%
5,182,9555.1%
[
0.0%
-
0.5%
]
0.31%
3,566,4944.5%
[
0.0%
-
0.5%
]
0.39%
1,845,2565.6%
[
0.0%
-
0.5%
]
0.48%
1,286,6075.4%
[
0.5%
-
1.0%
]
0.58%
1,265,3924.7%
[
0.5%
-
1.0%
]
0.64%
669,6875.4%
[
0.5%
-
1.0%
]
0.74%
611,9904.9%
[
0.5%
-
1.0%
]
0.82%
304,5744.8%
[
0.5%
-
1.0%
]
0.91%
233,0845.7%
[
1.0%
-
1.5%
]
1.00%
225,2765.1%
[
1.0%
-
1.5%
]
1.05%
430,1564.7%
[
1.0%
-
1.5%
]
1.16%
586,5375.5%
[
1.0%
-
1.5%
]
1.27%
86,4473.5%
[
1.0%
-
1.5%
]
1.34%
70,4167.0%
[
1.0%
-
1.5%
]
1.43%
230,5404.1%
[
1.5%
-
2.0%
]
1.53%
70,2196.6%
[
1.5%
-
2.0%
]
1.58%
99,7295.1%
[
1.5%
-
2.0%
]
1.68%
62,0196.0%
[
1.5%
-
2.0%
]
1.79%
100,7305.4%
[
1.5%
-
2.0%
]
1.84%
11,7312.2%
[
1.5%
-
2.0%
]
1.94%
18,7895.8%
[
2.0%
-
2.5%
]
2.02%
74,2505.4%
[
2.0%
-
2.5%
]
2.13%
100,9923.9%
[
2.0%
-
2.5%
]
2.29%
179,9625.5%
[
2.0%
-
2.5%
]
2.36%
48,6925.7%
[
2.5%
-
3.0%
]
2.51%
17,4004.1%
[
2.5%
-
3.0%
]
2.52%
35,3927.1%
[
2.5%
-
3.0%
]
2.62%
3,3976.1%
[
2.5%
-
3.0%
]
2.70%
56,7092.4%
[
2.5%
-
3.0%
]
2.97%
13,2816.2%
[
3.0%
-
3.5%
]
3.09%
26,9545.9%
[
3.0%
-
3.5%
]
3.24%
92,1606.2%
[
3.0%
-
3.5%
]
3.39%
2952.7%
[
3.5%
-
4.0%
]
3.63%
3,7462.4%
[
3.5%
-
4.0%
]
3.75%
85310.2%
[
4.0%
-
4.5%
]
4.07%
6,7247.7%
[
4.0%
-
4.5%
]
4.21%
4,7081.4%
[
4.0%
-
4.5%
]
4.29%
30,9833.4%
[
4.5%
-
5.0%
]
4.59%
12,9060.91%
[
4.5%
-
5.0%
]
4.68%
4,5557.0%
[
4.5%
-
5.0%
]
4.97%
23,2140.78%
[
5.5%
-
6.0%
]
5.68%
3,5937.9%
[
5.5%
-
6.0%
]
5.89%
1,6480.54%
[
5.5%
-
6.0%
]
5.95%
3,7341.3%
[
6.0%
-
6.5%
]
6.06%
6938.0%
[
8.0%
-
8.5%
]
8.16%
39213.2%
[
8.0%
-
8.5%
]
8.24%
5109.9%
[
8.5%
-
9.0%
]
8.68%
2,7426.4%
[
10.0%
-
10.5%
]
10.47%
2,2747.0%
[
17.0%
-
17.5%
]
17.37%
5,4115.0%
[
17.5%
-
18.0%
]
17.67%
5,7744.5%