Immigrants from the Azores Disability Age 5 to 17

COMPARE

Immigrants from the Azores
Race
Ancestry
AfghanAfricanAlaska NativeAlaskan AthabascanAlbanianAleutAlsatianAmericanApacheArabArapahoArgentineanArmenianAssyrian/Chaldean/SyriacAustralianAustrianBahamianBangladeshiBarbadianBasqueBelgianBelizeanBermudanBhutaneseBlackfeetBolivianBrazilianBritishBritish West IndianBulgarianBurmeseCajunCambodianCanadianCape VerdeanCarpatho RusynCelticCentral AmericanCentral American IndianCherokeeCheyenneChickasawChileanChineseChippewaChoctawColombianColvilleComancheCosta RicanCreeCreekCroatianCrowCubanCypriotCzechCzechoslovakianDanishDelawareDominicanDutchDutch West IndianEastern EuropeanEcuadorianEgyptianEnglishEstonianEthiopianEuropeanFijianFilipinoFinnishFrenchFrench American IndianFrench CanadianGermanGerman RussianGhanaianGreekGuamanian/ChamorroGuatemalanGuyaneseHaitianHmongHonduranHopiHoumaHungarianIcelanderIndian (Asian)IndonesianInupiatIranianIraqiIrishIroquoisIsraeliItalianJamaicanJapaneseJordanianKenyanKiowaKoreanLaotianLatvianLebaneseLiberianLithuanianLumbeeLuxembourgerMacedonianMalaysianMalteseMarshalleseMenomineeMexicanMexican American IndianMongolianMoroccanNative HawaiianNavajoNepaleseNew ZealanderNicaraguanNigerianNorthern EuropeanNorwegianOkinawanOsageOttawaPaiutePakistaniPalestinianPanamanianParaguayanPennsylvania GermanPeruvianPimaPolishPortuguesePotawatomiPuebloPuerto RicanPuget Sound SalishRomanianRussianSalvadoranSamoanScandinavianScotch-IrishScottishSeminoleSenegaleseSerbianShoshoneSierra LeoneanSiouxSlavicSlovakSloveneSomaliSouth AfricanSouth AmericanSouth American IndianSoviet UnionSpaniardSpanishSpanish AmericanSpanish American IndianSri LankanSubsaharan AfricanSudaneseSwedishSwissSyrianTaiwaneseThaiTlingit-HaidaTohono O'OdhamTonganTrinidadian and TobagonianTsimshianTurkishU.S. Virgin IslanderUgandanUkrainianUruguayanUteVenezuelanVietnameseWelshWest IndianYakamaYaquiYugoslavianYumanYup'ikZimbabwean
Immigration
NonimmigrantsImmigrantsAfghanistanAfricaAlbaniaArgentinaArmeniaAsiaAustraliaAustriaBahamasBangladeshBarbadosBelarusBelgiumBelizeBoliviaBosnia and HerzegovinaBrazilBulgariaBurma/MyanmarCabo VerdeCambodiaCameroonCanadaCaribbeanCentral AmericaChileChinaColombiaCongoCosta RicaCroatiaCubaCzechoslovakiaDenmarkDominicaDominican RepublicEastern AfricaEastern AsiaEastern EuropeEcuadorEgyptEl SalvadorEnglandEritreaEthiopiaEuropeFijiFranceGermanyGhanaGreeceGrenadaGuatemalaGuyanaHaitiHondurasHong KongHungaryIndiaIndonesiaIranIraqIrelandIsraelItalyJamaicaJapanJordanKazakhstanKenyaKoreaKuwaitLaosLatin AmericaLatviaLebanonLiberiaLithuaniaMalaysiaMexicoMicronesiaMiddle AfricaMoldovaMoroccoNepalNetherlandsNicaraguaNigeriaNorth AmericaNorth MacedoniaNorthern AfricaNorthern EuropeNorwayOceaniaPakistanPanamaPeruPhilippinesPolandPortugalRomaniaRussiaSaudi ArabiaScotlandSenegalSerbiaSierra LeoneSingaporeSomaliaSouth AfricaSouth AmericaSouth Central AsiaSouth Eastern AsiaSouthern EuropeSpainSri LankaSt. Vincent and the GrenadinesSudanSwedenSwitzerlandSyriaTaiwanThailandTrinidad and TobagoTurkeyUgandaUkraineUruguayUzbekistanVenezuelaVietnamWest IndiesWestern AfricaWestern AsiaWestern EuropeYemenZaireZimbabweAzores
Select to Compare
Race
Ancestry
AfghanAfricanAlaska NativeAlaskan AthabascanAlbanianAleutAlsatianAmericanApacheArabArapahoArgentineanArmenianAssyrian/Chaldean/SyriacAustralianAustrianBahamianBangladeshiBarbadianBasqueBelgianBelizeanBermudanBhutaneseBlackfeetBolivianBrazilianBritishBritish West IndianBulgarianBurmeseCajunCambodianCanadianCape VerdeanCarpatho RusynCelticCentral AmericanCentral American IndianCherokeeCheyenneChickasawChileanChineseChippewaChoctawColombianColvilleComancheCosta RicanCreeCreekCroatianCrowCubanCypriotCzechCzechoslovakianDanishDelawareDominicanDutchDutch West IndianEastern EuropeanEcuadorianEgyptianEnglishEstonianEthiopianEuropeanFijianFilipinoFinnishFrenchFrench American IndianFrench CanadianGermanGerman RussianGhanaianGreekGuamanian/ChamorroGuatemalanGuyaneseHaitianHmongHonduranHopiHoumaHungarianIcelanderIndian (Asian)IndonesianInupiatIranianIraqiIrishIroquoisIsraeliItalianJamaicanJapaneseJordanianKenyanKiowaKoreanLaotianLatvianLebaneseLiberianLithuanianLumbeeLuxembourgerMacedonianMalaysianMalteseMarshalleseMenomineeMexicanMexican American IndianMongolianMoroccanNative HawaiianNavajoNepaleseNew ZealanderNicaraguanNigerianNorthern EuropeanNorwegianOkinawanOsageOttawaPaiutePakistaniPalestinianPanamanianParaguayanPennsylvania GermanPeruvianPimaPolishPortuguesePotawatomiPuebloPuerto RicanPuget Sound SalishRomanianRussianSalvadoranSamoanScandinavianScotch-IrishScottishSeminoleSenegaleseSerbianShoshoneSierra LeoneanSiouxSlavicSlovakSloveneSomaliSouth AfricanSouth AmericanSouth American IndianSoviet UnionSpaniardSpanishSpanish AmericanSpanish American IndianSri LankanSubsaharan AfricanSudaneseSwedishSwissSyrianTaiwaneseThaiTlingit-HaidaTohono O'OdhamTonganTrinidadian and TobagonianTsimshianTurkishU.S. Virgin IslanderUgandanUkrainianUruguayanUteVenezuelanVietnameseWelshWest IndianYakamaYaquiYugoslavianYumanYup'ikZimbabwean
Immigration
NonimmigrantsImmigrantsAfghanistanAfricaAlbaniaArgentinaArmeniaAsiaAustraliaAustriaBahamasBangladeshBarbadosBelarusBelgiumBelizeBoliviaBosnia and HerzegovinaBrazilBulgariaBurma/MyanmarCabo VerdeCambodiaCameroonCanadaCaribbeanCentral AmericaChileChinaColombiaCongoCosta RicaCroatiaCubaCzechoslovakiaDenmarkDominicaDominican RepublicEastern AfricaEastern AsiaEastern EuropeEcuadorEgyptEl SalvadorEnglandEritreaEthiopiaEuropeFijiFranceGermanyGhanaGreeceGrenadaGuatemalaGuyanaHaitiHondurasHong KongHungaryIndiaIndonesiaIranIraqIrelandIsraelItalyJamaicaJapanJordanKazakhstanKenyaKoreaKuwaitLaosLatin AmericaLatviaLebanonLiberiaLithuaniaMalaysiaMexicoMicronesiaMiddle AfricaMoldovaMoroccoNepalNetherlandsNicaraguaNigeriaNorth AmericaNorth MacedoniaNorthern AfricaNorthern EuropeNorwayOceaniaPakistanPanamaPeruPhilippinesPolandPortugalRomaniaRussiaSaudi ArabiaScotlandSenegalSerbiaSierra LeoneSingaporeSomaliaSouth AfricaSouth AmericaSouth Central AsiaSouth Eastern AsiaSouthern EuropeSpainSri LankaSt. Vincent and the GrenadinesSudanSwedenSwitzerlandSyriaTaiwanThailandTrinidad and TobagoTurkeyUgandaUkraineUruguayUzbekistanVenezuelaVietnamWest IndiesWestern AfricaWestern AsiaWestern EuropeYemenZaireZimbabwe
Disability Age 5 to 17
Income
Poverty
Unemployment
Labor Participation
Family Structure
Vehicle Availability
Education Level
Disability

Immigrants from the Azores Disability Age 5 to 17
Tragic

6.7%
DISABILITY | AGE 5 TO 17
0.0/ 100
METRIC RATING
332nd/ 347
METRIC RANK

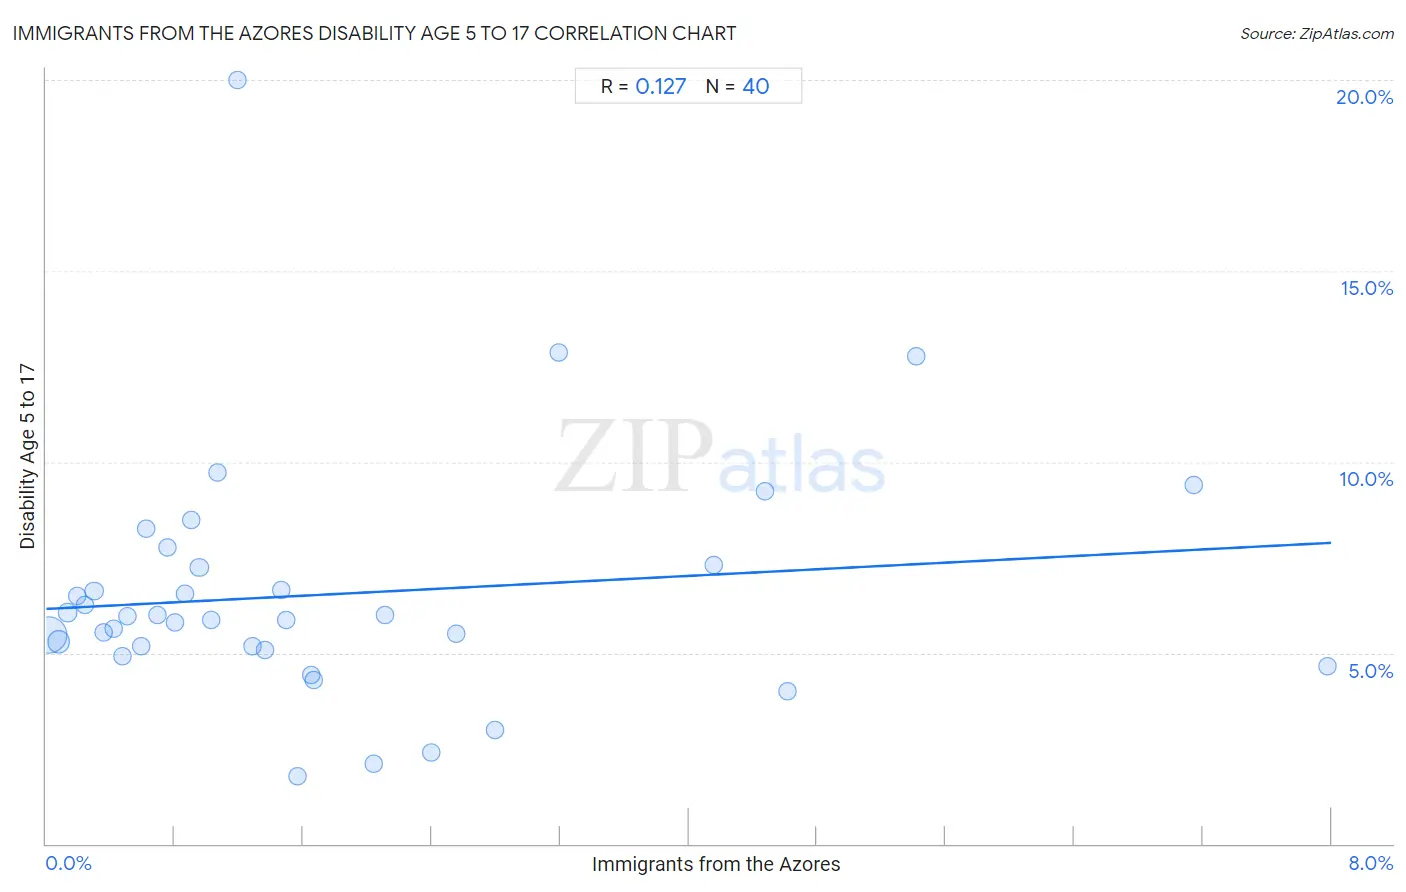
Immigrants from the Azores Disability Age 5 to 17 Correlation Chart

The statistical analysis conducted on geographies consisting of 46,157,711 people shows a poor positive correlation between the proportion of Immigrants from the Azores and percentage of population with a disability between the ages 5 and 17 in the United States with a correlation coefficient (R) of 0.127 and weighted average of 6.7%. On average, for every 1% (one percent) increase in Immigrants from the Azores within a typical geography, there is an increase of 0.22% in percentage of population with a disability between the ages 5 and 17.
Immigrants from the Azores Disability Age 5 to 17
It is essential to understand that the correlation between the percentage of Immigrants from the Azores and percentage of population with a disability between the ages 5 and 17 does not imply a direct cause-and-effect relationship. It remains uncertain whether the presence of Immigrants from the Azores influences an upward or downward trend in the level of percentage of population with a disability between the ages 5 and 17 within an area, or if Immigrants from the Azores simply ended up residing in those areas with higher or lower levels of percentage of population with a disability between the ages 5 and 17 due to other factors.

Demographics Similar to Immigrants from the Azores by Disability Age 5 to 17

In terms of disability age 5 to 17, the demographic groups most similar to Immigrants from the Azores are French Canadian (6.7%, a difference of 0.020%), Dutch West Indian (6.7%, a difference of 0.10%), Black/African American (6.8%, a difference of 0.59%), Seminole (6.8%, a difference of 0.64%), and Ottawa (6.8%, a difference of 1.3%).
DemographicsRating | RankDisability Age 5 to 17
Americans
0.0
/100
|
#325
Tragic
6.5%
Potawatomi
0.0
/100
|
#326
Tragic
6.5%
French American Indians
0.0
/100
|
#327
Tragic
6.6%
Pennsylvania Germans
0.0
/100
|
#328
Tragic
6.6%
Blackfeet
0.0
/100
|
#329
Tragic
6.6%
Dutch West Indians
0.0
/100
|
#330
Tragic
6.7%
French Canadians
0.0
/100
|
#331
Tragic
6.7%
Immigrants from the Azores
0.0
/100
|
#332
Tragic
6.7%
Blacks/African Americans
0.0
/100
|
#333
Tragic
6.8%
Seminole
0.0
/100
|
#334
Tragic
6.8%
Ottawa
0.0
/100
|
#335
Tragic
6.8%
Chickasaw
0.0
/100
|
#336
Tragic
6.8%
Creek
0.0
/100
|
#337
Tragic
6.9%
Iroquois
0.0
/100
|
#338
Tragic
6.9%
Choctaw
0.0
/100
|
#339
Tragic
6.9%

Immigrants from the Azores Disability Age 5 to 17 Correlation Summary

MeasurementImmigrants from the Azores DataDisability Age 5 to 17 Data
Minimum0.012%1.8%
Maximum8.0%20.0%
Range8.0%18.2%
Mean1.8%6.5%
Median1.1%5.9%
Interquartile 25% (IQ1)0.55%5.1%
Interquartile 75% (IQ3)2.3%7.3%
Interquartile Range (IQR)1.7%2.1%
Standard Deviation (Sample)1.9%3.2%
Standard Deviation (Population)1.9%3.2%

Correlation Details

Immigrants from the Azores PercentileSample SizeDisability Age 5 to 17
[
0.0%
-
0.5%
]
0.012%
32,839,0725.5%
[
0.0%
-
0.5%
]
0.077%
6,942,2155.3%
[
0.0%
-
0.5%
]
0.13%
1,781,0626.1%
[
0.0%
-
0.5%
]
0.19%
1,128,5536.5%
[
0.0%
-
0.5%
]
0.24%
270,3566.3%
[
0.0%
-
0.5%
]
0.30%
753,6906.6%
[
0.0%
-
0.5%
]
0.36%
342,9145.5%
[
0.0%
-
0.5%
]
0.42%
118,4115.6%
[
0.0%
-
0.5%
]
0.47%
110,9214.9%
[
0.5%
-
1.0%
]
0.51%
244,4805.9%
[
0.5%
-
1.0%
]
0.59%
140,2085.2%
[
0.5%
-
1.0%
]
0.62%
237,6108.2%
[
0.5%
-
1.0%
]
0.70%
93,9356.0%
[
0.5%
-
1.0%
]
0.76%
179,8407.8%
[
0.5%
-
1.0%
]
0.80%
140,8255.8%
[
0.5%
-
1.0%
]
0.87%
41,0946.5%
[
0.5%
-
1.0%
]
0.90%
31,9458.5%
[
0.5%
-
1.0%
]
0.95%
194,6057.2%
[
1.0%
-
1.5%
]
1.03%
109,0205.9%
[
1.0%
-
1.5%
]
1.07%
24,2979.7%
[
1.0%
-
1.5%
]
1.19%
33620.0%
[
1.0%
-
1.5%
]
1.28%
32,1565.2%
[
1.0%
-
1.5%
]
1.36%
11,4315.1%
[
1.0%
-
1.5%
]
1.46%
15,9076.6%
[
1.0%
-
1.5%
]
1.49%
25,8475.9%
[
1.5%
-
2.0%
]
1.57%
7,1541.8%
[
1.5%
-
2.0%
]
1.65%
2,3594.4%
[
1.5%
-
2.0%
]
1.67%
3,6624.3%
[
2.0%
-
2.5%
]
2.04%
17,1582.1%
[
2.0%
-
2.5%
]
2.11%
13,7816.0%
[
2.0%
-
2.5%
]
2.40%
22,4202.4%
[
2.5%
-
3.0%
]
2.55%
47,0125.5%
[
2.5%
-
3.0%
]
2.79%
3,6203.0%
[
3.0%
-
3.5%
]
3.19%
17,16412.9%
[
4.0%
-
4.5%
]
4.15%
18,4457.3%
[
4.0%
-
4.5%
]
4.47%
131,5629.2%
[
4.5%
-
5.0%
]
4.61%
21,7424.0%
[
5.0%
-
5.5%
]
5.41%
30,55812.8%
[
7.0%
-
7.5%
]
7.15%
1,5819.4%
[
7.5%
-
8.0%
]
7.98%
8,7634.6%