Immigrants from South Central Asia Disability Age 5 to 17
COMPARE
Immigrants from South Central Asia
Select to Compare
Disability Age 5 to 17
Immigrants from South Central Asia Disability Age 5 to 17
4.7%
DISABILITY | AGE 5 TO 17
100.0/ 100
METRIC RATING
18th/ 347
METRIC RANK
Immigrants from South Central Asia Disability Age 5 to 17 Correlation Chart
The statistical analysis conducted on geographies consisting of 467,856,625 people shows a weak negative correlation between the proportion of Immigrants from South Central Asia and percentage of population with a disability between the ages 5 and 17 in the United States with a correlation coefficient (R) of -0.241 and weighted average of 4.7%. On average, for every 1% (one percent) increase in Immigrants from South Central Asia within a typical geography, there is a decrease of 0.041% in percentage of population with a disability between the ages 5 and 17.
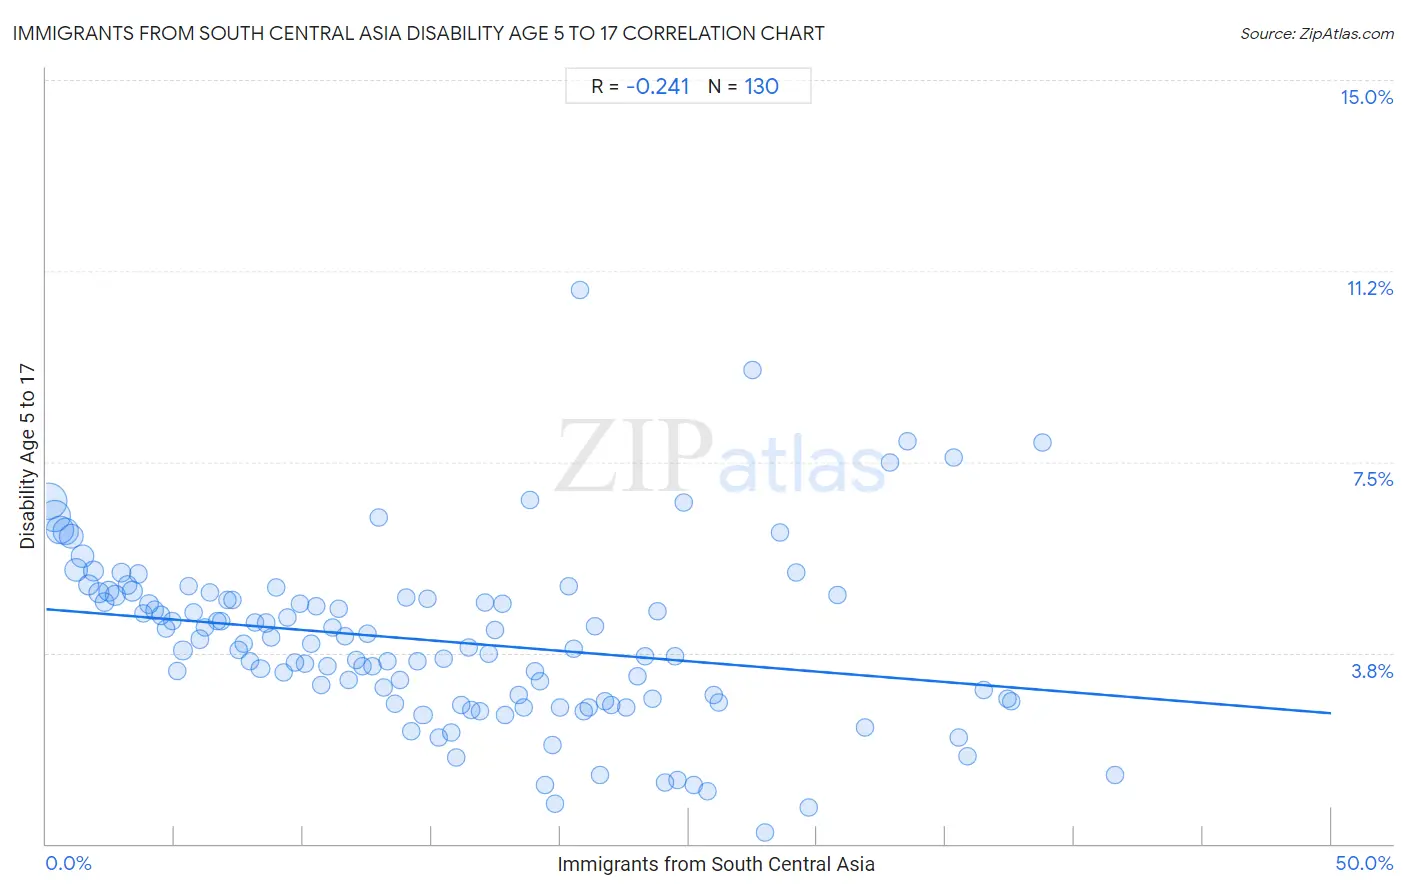
It is essential to understand that the correlation between the percentage of Immigrants from South Central Asia and percentage of population with a disability between the ages 5 and 17 does not imply a direct cause-and-effect relationship. It remains uncertain whether the presence of Immigrants from South Central Asia influences an upward or downward trend in the level of percentage of population with a disability between the ages 5 and 17 within an area, or if Immigrants from South Central Asia simply ended up residing in those areas with higher or lower levels of percentage of population with a disability between the ages 5 and 17 due to other factors.
Demographics Similar to Immigrants from South Central Asia by Disability Age 5 to 17
In terms of disability age 5 to 17, the demographic groups most similar to Immigrants from South Central Asia are Arapaho (4.7%, a difference of 0.020%), Immigrants from Singapore (4.7%, a difference of 0.48%), Immigrants from Uzbekistan (4.8%, a difference of 0.49%), Burmese (4.8%, a difference of 0.87%), and Chinese (4.7%, a difference of 0.90%).
| Demographics | Rating | Rank | Disability Age 5 to 17 |
| Armenians | 100.0 /100 | #11 | Exceptional 4.6% |
| Iranians | 100.0 /100 | #12 | Exceptional 4.6% |
| Thais | 100.0 /100 | #13 | Exceptional 4.7% |
| Immigrants from Korea | 100.0 /100 | #14 | Exceptional 4.7% |
| Chinese | 100.0 /100 | #15 | Exceptional 4.7% |
| Immigrants from Singapore | 100.0 /100 | #16 | Exceptional 4.7% |
| Arapaho | 100.0 /100 | #17 | Exceptional 4.7% |
| Immigrants from South Central Asia | 100.0 /100 | #18 | Exceptional 4.7% |
| Immigrants from Uzbekistan | 100.0 /100 | #19 | Exceptional 4.8% |
| Burmese | 100.0 /100 | #20 | Exceptional 4.8% |
| Yup'ik | 100.0 /100 | #21 | Exceptional 4.8% |
| Asians | 100.0 /100 | #22 | Exceptional 4.8% |
| Immigrants from Bolivia | 100.0 /100 | #23 | Exceptional 4.8% |
| Immigrants from Lebanon | 100.0 /100 | #24 | Exceptional 4.8% |
| Immigrants from Asia | 100.0 /100 | #25 | Exceptional 4.8% |
Immigrants from South Central Asia Disability Age 5 to 17 Correlation Summary
| Measurement | Immigrants from South Central Asia Data | Disability Age 5 to 17 Data |
| Minimum | 0.11% | 0.21% |
| Maximum | 41.6% | 10.9% |
| Range | 41.5% | 10.7% |
| Mean | 15.2% | 4.0% |
| Median | 14.1% | 3.9% |
| Interquartile 25% (IQ1) | 7.1% | 2.8% |
| Interquartile 75% (IQ3) | 21.5% | 4.8% |
| Interquartile Range (IQR) | 14.5% | 2.0% |
| Standard Deviation (Sample) | 10.0% | 1.7% |
| Standard Deviation (Population) | 10.0% | 1.7% |
Correlation Details
| Immigrants from South Central Asia Percentile | Sample Size | Disability Age 5 to 17 |
[ 0.0% - 0.5% ] 0.11% | 89,584,293 | 6.7% |
[ 0.0% - 0.5% ] 0.32% | 68,095,615 | 6.4% |
[ 0.5% - 1.0% ] 0.54% | 48,594,245 | 6.2% |
[ 0.5% - 1.0% ] 0.76% | 40,876,209 | 6.1% |
[ 0.5% - 1.0% ] 0.97% | 29,765,043 | 6.0% |
[ 1.0% - 1.5% ] 1.18% | 24,812,693 | 5.4% |
[ 1.0% - 1.5% ] 1.41% | 24,015,327 | 5.6% |
[ 1.5% - 2.0% ] 1.63% | 12,840,027 | 5.1% |
[ 1.5% - 2.0% ] 1.85% | 13,629,942 | 5.4% |
[ 2.0% - 2.5% ] 2.06% | 10,155,030 | 4.9% |
[ 2.0% - 2.5% ] 2.27% | 9,802,852 | 4.7% |
[ 2.0% - 2.5% ] 2.45% | 11,687,635 | 5.0% |
[ 2.5% - 3.0% ] 2.70% | 8,664,918 | 4.9% |
[ 2.5% - 3.0% ] 2.94% | 4,529,769 | 5.3% |
[ 3.0% - 3.5% ] 3.15% | 5,697,847 | 5.1% |
[ 3.0% - 3.5% ] 3.34% | 13,205,731 | 5.0% |
[ 3.5% - 4.0% ] 3.58% | 3,869,172 | 5.3% |
[ 3.5% - 4.0% ] 3.79% | 3,209,975 | 4.5% |
[ 4.0% - 4.5% ] 4.01% | 3,180,194 | 4.7% |
[ 4.0% - 4.5% ] 4.22% | 3,443,492 | 4.6% |
[ 4.0% - 4.5% ] 4.45% | 2,552,036 | 4.5% |
[ 4.5% - 5.0% ] 4.65% | 1,960,560 | 4.2% |
[ 4.5% - 5.0% ] 4.89% | 1,923,877 | 4.4% |
[ 5.0% - 5.5% ] 5.09% | 2,195,230 | 3.4% |
[ 5.0% - 5.5% ] 5.32% | 1,883,584 | 3.8% |
[ 5.5% - 6.0% ] 5.53% | 1,171,410 | 5.1% |
[ 5.5% - 6.0% ] 5.75% | 1,394,852 | 4.6% |
[ 5.5% - 6.0% ] 5.97% | 1,332,695 | 4.0% |
[ 6.0% - 6.5% ] 6.19% | 1,033,910 | 4.2% |
[ 6.0% - 6.5% ] 6.37% | 732,865 | 4.9% |
[ 6.5% - 7.0% ] 6.64% | 1,851,053 | 4.4% |
[ 6.5% - 7.0% ] 6.82% | 751,343 | 4.4% |
[ 7.0% - 7.5% ] 7.06% | 768,772 | 4.8% |
[ 7.0% - 7.5% ] 7.24% | 478,740 | 4.8% |
[ 7.0% - 7.5% ] 7.48% | 606,179 | 3.8% |
[ 7.5% - 8.0% ] 7.69% | 549,890 | 3.9% |
[ 7.5% - 8.0% ] 7.94% | 548,519 | 3.6% |
[ 8.0% - 8.5% ] 8.13% | 395,200 | 4.3% |
[ 8.0% - 8.5% ] 8.34% | 1,153,964 | 3.4% |
[ 8.5% - 9.0% ] 8.55% | 825,187 | 4.3% |
[ 8.5% - 9.0% ] 8.77% | 717,495 | 4.1% |
[ 8.5% - 9.0% ] 8.96% | 417,724 | 5.0% |
[ 9.0% - 9.5% ] 9.22% | 713,888 | 3.4% |
[ 9.0% - 9.5% ] 9.41% | 354,287 | 4.4% |
[ 9.5% - 10.0% ] 9.67% | 556,057 | 3.6% |
[ 9.5% - 10.0% ] 9.86% | 413,634 | 4.7% |
[ 10.0% - 10.5% ] 10.06% | 509,434 | 3.5% |
[ 10.0% - 10.5% ] 10.33% | 803,192 | 3.9% |
[ 10.5% - 11.0% ] 10.53% | 308,496 | 4.7% |
[ 10.5% - 11.0% ] 10.71% | 168,727 | 3.1% |
[ 10.5% - 11.0% ] 10.92% | 616,020 | 3.5% |
[ 11.0% - 11.5% ] 11.14% | 158,182 | 4.3% |
[ 11.0% - 11.5% ] 11.40% | 162,669 | 4.6% |
[ 11.5% - 12.0% ] 11.62% | 618,620 | 4.1% |
[ 11.5% - 12.0% ] 11.79% | 526,869 | 3.2% |
[ 12.0% - 12.5% ] 12.08% | 244,473 | 3.6% |
[ 12.0% - 12.5% ] 12.29% | 253,020 | 3.5% |
[ 12.0% - 12.5% ] 12.48% | 474,103 | 4.1% |
[ 12.5% - 13.0% ] 12.67% | 251,228 | 3.5% |
[ 12.5% - 13.0% ] 12.93% | 186,675 | 6.4% |
[ 13.0% - 13.5% ] 13.12% | 182,626 | 3.1% |
[ 13.0% - 13.5% ] 13.30% | 221,084 | 3.6% |
[ 13.5% - 14.0% ] 13.55% | 181,618 | 2.7% |
[ 13.5% - 14.0% ] 13.77% | 409,780 | 3.2% |
[ 13.5% - 14.0% ] 14.00% | 45,921 | 4.8% |
[ 14.0% - 14.5% ] 14.22% | 55,991 | 2.2% |
[ 14.0% - 14.5% ] 14.44% | 138,426 | 3.6% |
[ 14.5% - 15.0% ] 14.66% | 312,359 | 2.5% |
[ 14.5% - 15.0% ] 14.82% | 61,181 | 4.8% |
[ 15.0% - 15.5% ] 15.29% | 82,660 | 2.1% |
[ 15.0% - 15.5% ] 15.45% | 260,233 | 3.6% |
[ 15.5% - 16.0% ] 15.74% | 155,069 | 2.2% |
[ 15.5% - 16.0% ] 15.94% | 131,959 | 1.7% |
[ 16.0% - 16.5% ] 16.16% | 254,248 | 2.7% |
[ 16.0% - 16.5% ] 16.42% | 105,551 | 3.9% |
[ 16.5% - 17.0% ] 16.56% | 110,569 | 2.6% |
[ 16.5% - 17.0% ] 16.89% | 180,117 | 2.6% |
[ 17.0% - 17.5% ] 17.08% | 22,030 | 4.7% |
[ 17.0% - 17.5% ] 17.23% | 272,834 | 3.7% |
[ 17.0% - 17.5% ] 17.44% | 16,679 | 4.2% |
[ 17.5% - 18.0% ] 17.73% | 215,024 | 4.7% |
[ 17.5% - 18.0% ] 17.83% | 131,679 | 2.5% |
[ 18.0% - 18.5% ] 18.37% | 6,272 | 2.9% |
[ 18.5% - 19.0% ] 18.57% | 29,916 | 2.7% |
[ 18.5% - 19.0% ] 18.81% | 152,702 | 6.8% |
[ 19.0% - 19.5% ] 19.03% | 129,604 | 3.4% |
[ 19.0% - 19.5% ] 19.20% | 149,814 | 3.2% |
[ 19.0% - 19.5% ] 19.42% | 11,603 | 1.1% |
[ 19.5% - 20.0% ] 19.69% | 13,297 | 1.9% |
[ 19.5% - 20.0% ] 19.77% | 19,017 | 0.78% |
[ 20.0% - 20.5% ] 20.00% | 49,758 | 2.7% |
[ 20.0% - 20.5% ] 20.33% | 22,831 | 5.1% |
[ 20.5% - 21.0% ] 20.51% | 68,761 | 3.8% |
[ 20.5% - 21.0% ] 20.77% | 33,513 | 10.9% |
[ 20.5% - 21.0% ] 20.92% | 14,067 | 2.6% |
[ 21.0% - 21.5% ] 21.09% | 127,930 | 2.7% |
[ 21.0% - 21.5% ] 21.36% | 188,594 | 4.3% |
[ 21.5% - 22.0% ] 21.54% | 1,207 | 1.4% |
[ 21.5% - 22.0% ] 21.72% | 24,229 | 2.8% |
[ 21.5% - 22.0% ] 21.98% | 74,839 | 2.7% |
[ 22.5% - 23.0% ] 22.57% | 228,795 | 2.7% |
[ 22.5% - 23.0% ] 23.00% | 64,268 | 3.3% |
[ 23.0% - 23.5% ] 23.28% | 37,671 | 3.7% |
[ 23.5% - 24.0% ] 23.60% | 88,402 | 2.8% |
[ 23.5% - 24.0% ] 23.79% | 50,125 | 4.6% |
[ 24.0% - 24.5% ] 24.06% | 22,796 | 1.2% |
[ 24.0% - 24.5% ] 24.46% | 8,257 | 3.7% |
[ 24.5% - 25.0% ] 24.58% | 38,567 | 1.3% |
[ 24.5% - 25.0% ] 24.81% | 36,595 | 6.7% |
[ 25.0% - 25.5% ] 25.19% | 53,464 | 1.1% |
[ 25.5% - 26.0% ] 25.72% | 5,206 | 1.0% |
[ 25.5% - 26.0% ] 25.98% | 42,760 | 2.9% |
[ 26.0% - 26.5% ] 26.16% | 44,127 | 2.8% |
[ 27.0% - 27.5% ] 27.46% | 5,018 | 9.3% |
[ 27.5% - 28.0% ] 27.96% | 15,702 | 0.21% |
[ 28.5% - 29.0% ] 28.55% | 802 | 6.1% |
[ 29.0% - 29.5% ] 29.17% | 3,695 | 5.3% |
[ 29.5% - 30.0% ] 29.66% | 5,867 | 0.72% |
[ 30.5% - 31.0% ] 30.78% | 2,560 | 4.9% |
[ 31.5% - 32.0% ] 31.85% | 16,722 | 2.3% |
[ 32.5% - 33.0% ] 32.84% | 341 | 7.5% |
[ 33.5% - 34.0% ] 33.52% | 30,916 | 7.9% |
[ 35.0% - 35.5% ] 35.30% | 1,425 | 7.6% |
[ 35.0% - 35.5% ] 35.50% | 20,693 | 2.1% |
[ 35.5% - 36.0% ] 35.86% | 15,585 | 1.7% |
[ 36.0% - 36.5% ] 36.48% | 2,300 | 3.0% |
[ 37.0% - 37.5% ] 37.40% | 44,570 | 2.9% |
[ 37.5% - 38.0% ] 37.56% | 39,565 | 2.8% |
[ 38.5% - 39.0% ] 38.78% | 37,022 | 7.9% |
[ 41.5% - 42.0% ] 41.58% | 2,549 | 1.3% |