Immigrants from Middle Africa Disability Age 5 to 17
COMPARE
Immigrants from Middle Africa
Select to Compare
Disability Age 5 to 17
Immigrants from Middle Africa Disability Age 5 to 17
5.9%
DISABILITY | AGE 5 TO 17
0.7/ 100
METRIC RATING
261st/ 347
METRIC RANK
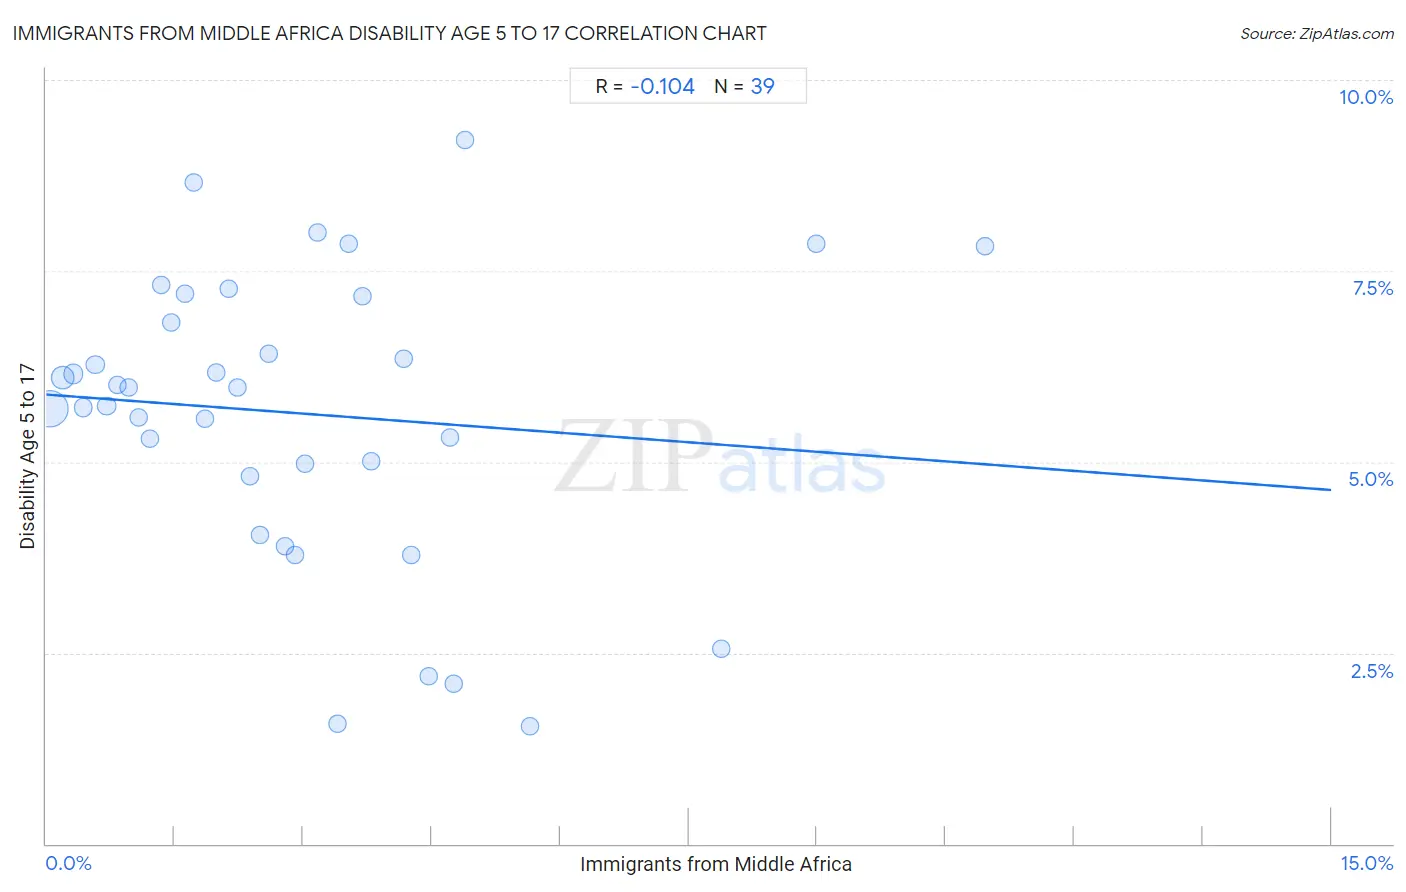
Immigrants from Middle Africa Disability Age 5 to 17 Correlation Chart
The statistical analysis conducted on geographies consisting of 202,029,943 people shows a poor negative correlation between the proportion of Immigrants from Middle Africa and percentage of population with a disability between the ages 5 and 17 in the United States with a correlation coefficient (R) of -0.104 and weighted average of 5.9%. On average, for every 1% (one percent) increase in Immigrants from Middle Africa within a typical geography, there is a decrease of 0.083% in percentage of population with a disability between the ages 5 and 17.
It is essential to understand that the correlation between the percentage of Immigrants from Middle Africa and percentage of population with a disability between the ages 5 and 17 does not imply a direct cause-and-effect relationship. It remains uncertain whether the presence of Immigrants from Middle Africa influences an upward or downward trend in the level of percentage of population with a disability between the ages 5 and 17 within an area, or if Immigrants from Middle Africa simply ended up residing in those areas with higher or lower levels of percentage of population with a disability between the ages 5 and 17 due to other factors.
Demographics Similar to Immigrants from Middle Africa by Disability Age 5 to 17
In terms of disability age 5 to 17, the demographic groups most similar to Immigrants from Middle Africa are Immigrants from Western Africa (5.9%, a difference of 0.030%), Somali (5.9%, a difference of 0.070%), Czechoslovakian (5.9%, a difference of 0.11%), Slavic (5.9%, a difference of 0.20%), and Canadian (6.0%, a difference of 0.23%).
| Demographics | Rating | Rank | Disability Age 5 to 17 |
| Barbadians | 1.3 /100 | #254 | Tragic 5.9% |
| Italians | 1.2 /100 | #255 | Tragic 5.9% |
| Hopi | 1.0 /100 | #256 | Tragic 5.9% |
| Hispanics or Latinos | 1.0 /100 | #257 | Tragic 5.9% |
| Brazilians | 0.9 /100 | #258 | Tragic 5.9% |
| Slavs | 0.9 /100 | #259 | Tragic 5.9% |
| Somalis | 0.8 /100 | #260 | Tragic 5.9% |
| Immigrants from Middle Africa | 0.7 /100 | #261 | Tragic 5.9% |
| Immigrants from Western Africa | 0.7 /100 | #262 | Tragic 5.9% |
| Czechoslovakians | 0.7 /100 | #263 | Tragic 5.9% |
| Canadians | 0.6 /100 | #264 | Tragic 6.0% |
| Panamanians | 0.6 /100 | #265 | Tragic 6.0% |
| Slovenes | 0.6 /100 | #266 | Tragic 6.0% |
| Spanish | 0.5 /100 | #267 | Tragic 6.0% |
| Sioux | 0.4 /100 | #268 | Tragic 6.0% |
Immigrants from Middle Africa Disability Age 5 to 17 Correlation Summary
| Measurement | Immigrants from Middle Africa Data | Disability Age 5 to 17 Data |
| Minimum | 0.047% | 1.5% |
| Maximum | 11.0% | 9.2% |
| Range | 10.9% | 7.7% |
| Mean | 3.0% | 5.6% |
| Median | 2.5% | 6.0% |
| Interquartile 25% (IQ1) | 1.2% | 4.8% |
| Interquartile 75% (IQ3) | 4.2% | 7.2% |
| Interquartile Range (IQR) | 3.0% | 2.4% |
| Standard Deviation (Sample) | 2.4% | 1.9% |
| Standard Deviation (Population) | 2.4% | 1.9% |
Correlation Details
| Immigrants from Middle Africa Percentile | Sample Size | Disability Age 5 to 17 |
[ 0.0% - 0.5% ] 0.047% | 131,812,061 | 5.7% |
[ 0.0% - 0.5% ] 0.19% | 33,068,198 | 6.1% |
[ 0.0% - 0.5% ] 0.32% | 15,043,233 | 6.1% |
[ 0.0% - 0.5% ] 0.43% | 7,428,630 | 5.7% |
[ 0.5% - 1.0% ] 0.57% | 4,560,302 | 6.3% |
[ 0.5% - 1.0% ] 0.70% | 2,667,757 | 5.7% |
[ 0.5% - 1.0% ] 0.83% | 1,566,660 | 6.0% |
[ 0.5% - 1.0% ] 0.96% | 956,795 | 6.0% |
[ 1.0% - 1.5% ] 1.08% | 942,408 | 5.6% |
[ 1.0% - 1.5% ] 1.21% | 871,692 | 5.3% |
[ 1.0% - 1.5% ] 1.34% | 611,397 | 7.3% |
[ 1.0% - 1.5% ] 1.45% | 277,795 | 6.8% |
[ 1.5% - 2.0% ] 1.62% | 226,667 | 7.2% |
[ 1.5% - 2.0% ] 1.73% | 283,633 | 8.7% |
[ 1.5% - 2.0% ] 1.86% | 293,891 | 5.6% |
[ 1.5% - 2.0% ] 1.98% | 163,638 | 6.2% |
[ 2.0% - 2.5% ] 2.14% | 122,311 | 7.3% |
[ 2.0% - 2.5% ] 2.23% | 150,677 | 6.0% |
[ 2.0% - 2.5% ] 2.37% | 199,553 | 4.8% |
[ 2.0% - 2.5% ] 2.50% | 124,999 | 4.0% |
[ 2.5% - 3.0% ] 2.60% | 10,536 | 6.4% |
[ 2.5% - 3.0% ] 2.78% | 7,804 | 3.9% |
[ 2.5% - 3.0% ] 2.90% | 102,991 | 3.8% |
[ 3.0% - 3.5% ] 3.02% | 49,856 | 5.0% |
[ 3.0% - 3.5% ] 3.17% | 19,369 | 8.0% |
[ 3.0% - 3.5% ] 3.40% | 43,554 | 1.6% |
[ 3.5% - 4.0% ] 3.54% | 125,905 | 7.9% |
[ 3.5% - 4.0% ] 3.69% | 2,330 | 7.2% |
[ 3.5% - 4.0% ] 3.79% | 12,128 | 5.0% |
[ 4.0% - 4.5% ] 4.17% | 69,634 | 6.4% |
[ 4.0% - 4.5% ] 4.27% | 75,988 | 3.8% |
[ 4.0% - 4.5% ] 4.46% | 28,427 | 2.2% |
[ 4.5% - 5.0% ] 4.71% | 16,426 | 5.3% |
[ 4.5% - 5.0% ] 4.75% | 27,909 | 2.1% |
[ 4.5% - 5.0% ] 4.89% | 26,684 | 9.2% |
[ 5.5% - 6.0% ] 5.64% | 16,944 | 1.5% |
[ 7.5% - 8.0% ] 7.88% | 863 | 2.6% |
[ 8.5% - 9.0% ] 8.99% | 15,489 | 7.9% |
[ 10.5% - 11.0% ] 10.96% | 4,809 | 7.8% |