Hmong Disability Age 5 to 17
COMPARE
Hmong
Select to Compare
Disability Age 5 to 17
Hmong Disability Age 5 to 17
6.3%
DISABILITY | AGE 5 TO 17
0.0/ 100
METRIC RATING
309th/ 347
METRIC RANK
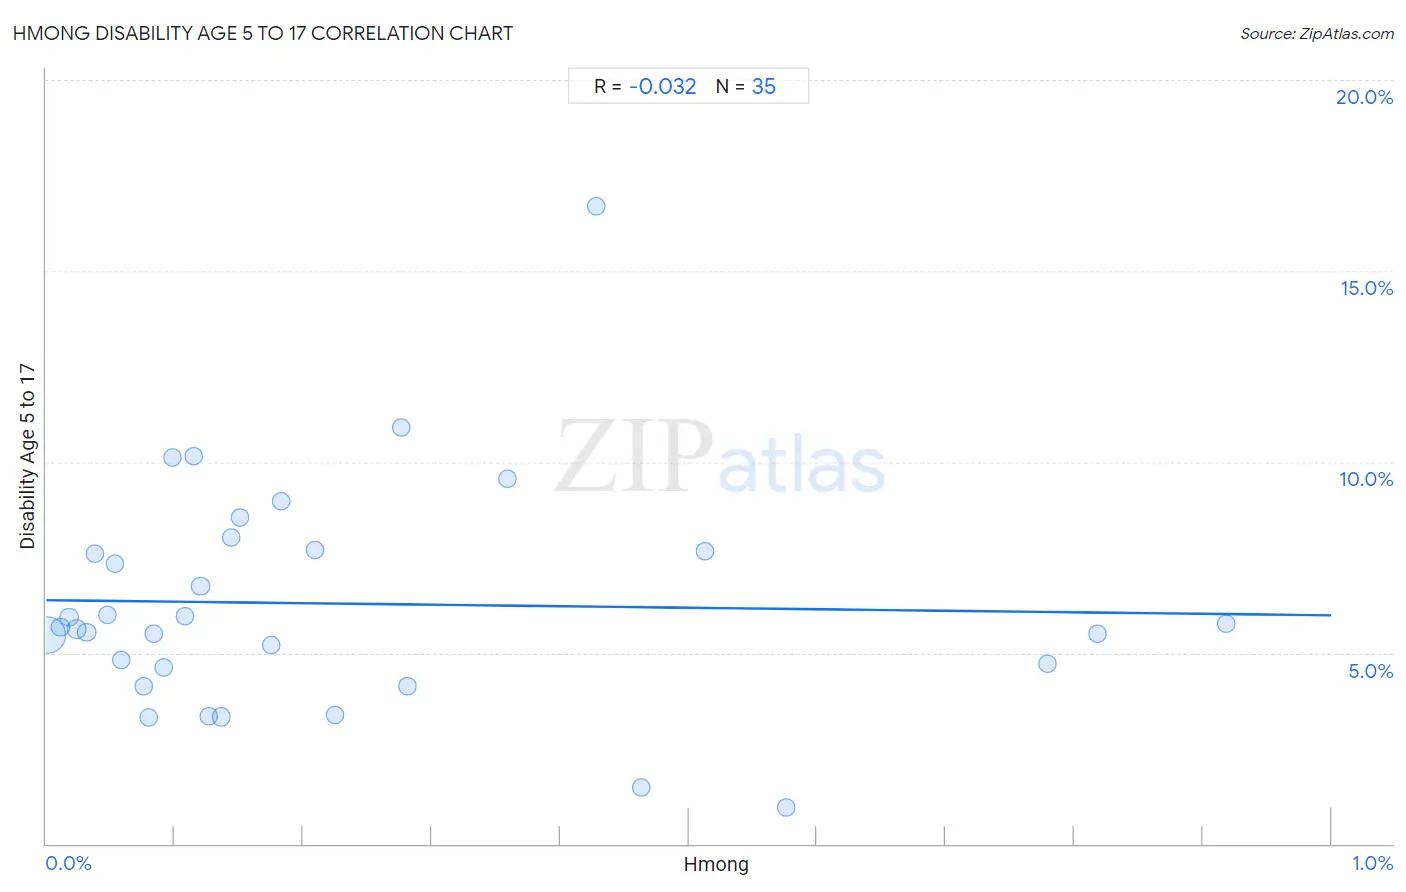
Hmong Disability Age 5 to 17 Correlation Chart
The statistical analysis conducted on geographies consisting of 24,665,493 people shows no correlation between the proportion of Hmong and percentage of population with a disability between the ages 5 and 17 in the United States with a correlation coefficient (R) of -0.032 and weighted average of 6.3%. On average, for every 1% (one percent) increase in Hmong within a typical geography, there is a decrease of 0.40% in percentage of population with a disability between the ages 5 and 17.
It is essential to understand that the correlation between the percentage of Hmong and percentage of population with a disability between the ages 5 and 17 does not imply a direct cause-and-effect relationship. It remains uncertain whether the presence of Hmong influences an upward or downward trend in the level of percentage of population with a disability between the ages 5 and 17 within an area, or if Hmong simply ended up residing in those areas with higher or lower levels of percentage of population with a disability between the ages 5 and 17 due to other factors.
Demographics Similar to Hmong by Disability Age 5 to 17
In terms of disability age 5 to 17, the demographic groups most similar to Hmong are Scotch-Irish (6.3%, a difference of 0.020%), Alaskan Athabascan (6.3%, a difference of 0.13%), Immigrants from Dominica (6.3%, a difference of 0.18%), Bahamian (6.3%, a difference of 0.26%), and Bermudan (6.4%, a difference of 0.29%).
| Demographics | Rating | Rank | Disability Age 5 to 17 |
| Celtics | 0.0 /100 | #302 | Tragic 6.3% |
| Yakama | 0.0 /100 | #303 | Tragic 6.3% |
| Senegalese | 0.0 /100 | #304 | Tragic 6.3% |
| Natives/Alaskans | 0.0 /100 | #305 | Tragic 6.3% |
| Nonimmigrants | 0.0 /100 | #306 | Tragic 6.3% |
| Bahamians | 0.0 /100 | #307 | Tragic 6.3% |
| Scotch-Irish | 0.0 /100 | #308 | Tragic 6.3% |
| Hmong | 0.0 /100 | #309 | Tragic 6.3% |
| Alaskan Athabascans | 0.0 /100 | #310 | Tragic 6.3% |
| Immigrants from Dominica | 0.0 /100 | #311 | Tragic 6.3% |
| Bermudans | 0.0 /100 | #312 | Tragic 6.4% |
| Apache | 0.0 /100 | #313 | Tragic 6.4% |
| French | 0.0 /100 | #314 | Tragic 6.4% |
| Immigrants from Portugal | 0.0 /100 | #315 | Tragic 6.4% |
| Immigrants from Dominican Republic | 0.0 /100 | #316 | Tragic 6.4% |
Hmong Disability Age 5 to 17 Correlation Summary
| Measurement | Hmong Data | Disability Age 5 to 17 Data |
| Minimum | 0.0014% | 0.96% |
| Maximum | 0.92% | 16.7% |
| Range | 0.92% | 15.7% |
| Mean | 0.22% | 6.3% |
| Median | 0.13% | 5.7% |
| Interquartile 25% (IQ1) | 0.058% | 4.6% |
| Interquartile 75% (IQ3) | 0.28% | 7.7% |
| Interquartile Range (IQR) | 0.22% | 3.1% |
| Standard Deviation (Sample) | 0.24% | 3.0% |
| Standard Deviation (Population) | 0.24% | 2.9% |
Correlation Details
| Hmong Percentile | Sample Size | Disability Age 5 to 17 |
[ 0.0% - 0.5% ] 0.0014% | 20,776,297 | 5.5% |
[ 0.0% - 0.5% ] 0.011% | 606,587 | 5.7% |
[ 0.0% - 0.5% ] 0.018% | 619,819 | 5.9% |
[ 0.0% - 0.5% ] 0.024% | 529,135 | 5.6% |
[ 0.0% - 0.5% ] 0.031% | 540,131 | 5.5% |
[ 0.0% - 0.5% ] 0.038% | 194,445 | 7.6% |
[ 0.0% - 0.5% ] 0.047% | 199,126 | 6.0% |
[ 0.0% - 0.5% ] 0.053% | 232,793 | 7.3% |
[ 0.0% - 0.5% ] 0.058% | 35,976 | 4.8% |
[ 0.0% - 0.5% ] 0.076% | 17,117 | 4.1% |
[ 0.0% - 0.5% ] 0.080% | 73,735 | 3.3% |
[ 0.0% - 0.5% ] 0.084% | 41,849 | 5.5% |
[ 0.0% - 0.5% ] 0.092% | 58,866 | 4.6% |
[ 0.0% - 0.5% ] 0.099% | 51,765 | 10.1% |
[ 0.0% - 0.5% ] 0.11% | 103,080 | 6.0% |
[ 0.0% - 0.5% ] 0.11% | 49,747 | 10.1% |
[ 0.0% - 0.5% ] 0.12% | 72,435 | 6.7% |
[ 0.0% - 0.5% ] 0.13% | 13,425 | 3.3% |
[ 0.0% - 0.5% ] 0.14% | 38,964 | 3.3% |
[ 0.0% - 0.5% ] 0.14% | 24,235 | 8.0% |
[ 0.0% - 0.5% ] 0.15% | 39,182 | 8.6% |
[ 0.0% - 0.5% ] 0.17% | 25,176 | 5.2% |
[ 0.0% - 0.5% ] 0.18% | 51,926 | 9.0% |
[ 0.0% - 0.5% ] 0.21% | 12,892 | 7.7% |
[ 0.0% - 0.5% ] 0.22% | 50,298 | 3.4% |
[ 0.0% - 0.5% ] 0.28% | 2,534 | 10.9% |
[ 0.0% - 0.5% ] 0.28% | 15,628 | 4.1% |
[ 0.0% - 0.5% ] 0.36% | 44,073 | 9.5% |
[ 0.0% - 0.5% ] 0.43% | 8,418 | 16.7% |
[ 0.0% - 0.5% ] 0.46% | 4,965 | 1.5% |
[ 0.5% - 1.0% ] 0.51% | 64,952 | 7.7% |
[ 0.5% - 1.0% ] 0.58% | 9,203 | 0.96% |
[ 0.5% - 1.0% ] 0.78% | 11,544 | 4.7% |
[ 0.5% - 1.0% ] 0.82% | 10,997 | 5.5% |
[ 0.5% - 1.0% ] 0.92% | 34,178 | 5.8% |