Georgia Map & Demographics
Georgia Map
Georgia Overview
Jan 2, 1788
INCORPORATED
59,425
TOTAL AREA [ SQ MI ]
57,501
LAND AREA [ SQ MI ]
1,924
WATER AREA [ SQ MI ]
600
ELEVATION AVG [ FT ]
4,784
ELEVATION HIGH [ FT ]
Sea Level
ELEVATION LOW [ FT ]
186.5
POP DENSITY [ PPL / SQ MI ]
$37,836
PER CAPITA INCOME
$86,169
AVG FAMILY INCOME
$71,355
AVG HOUSEHOLD INCOME
25.8%
WAGE / INCOME GAP [ % ]
74.2¢/ $1
WAGE / INCOME GAP [ $ ]
$11,259
FAMILY INCOME DEFICIT
0.48
INEQUALITY / GINI INDEX
30044
LARGEST ZIP CODE
Atlanta
LARGEST CITY
Fulton County
LARGEST COUNTY
10,722,325
TOTAL POPULATION
5,244,476
MALE POPULATION
5,477,849
FEMALE POPULATION
95.74
MALES / 100 FEMALES
104.45
FEMALES / 100 MALES
37.2
MEDIAN AGE
3.3
AVG FAMILY SIZE
2.6
AVG HOUSEHOLD SIZE
5,408,659
LABOR FORCE [ PEOPLE ]
63.6%
PERCENT IN LABOR FORCE
5.2%
UNEMPLOYMENT RATE
Income in Georgia
Income Overview in Georgia
Per Capita Income in Georgia is $37,836, while median incomes of families and households are $86,169 and $71,355 respectively.
| Characteristic | Number | Measure |
| Per Capita Income | 10,722,325 | $37,836 |
| Median Family Income | 2,628,197 | $86,169 |
| Mean Family Income | 2,628,197 | $115,812 |
| Median Household Income | 3,946,490 | $71,355 |
| Mean Household Income | 3,946,490 | $99,345 |
| Income Deficit | 2,628,197 | $11,259 |
| Wage / Income Gap (%) | 10,722,325 | 25.77% |
| Wage / Income Gap ($) | 10,722,325 | 74.23¢ per $1 |
| Gini / Inequality Index | 10,722,325 | 0.48 |
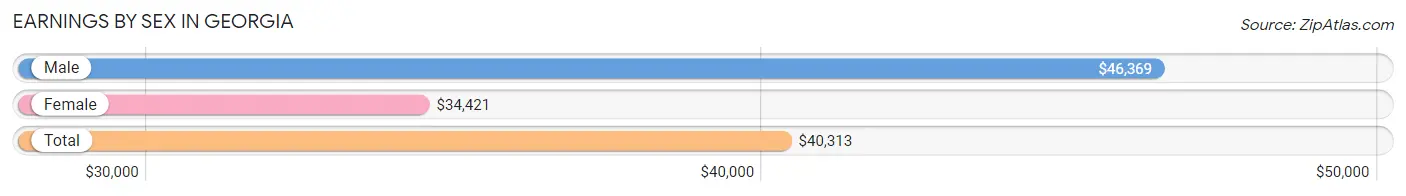
Earnings by Sex in Georgia
Average Earnings in Georgia are $40,313, $46,369 for men and $34,421 for women, a difference of 25.8%.
| Sex | Number | Average Earnings |
| Male | 2,915,633 (51.9%) | $46,369 |
| Female | 2,697,455 (48.1%) | $34,421 |
| Total | 5,613,088 (100.0%) | $40,313 |
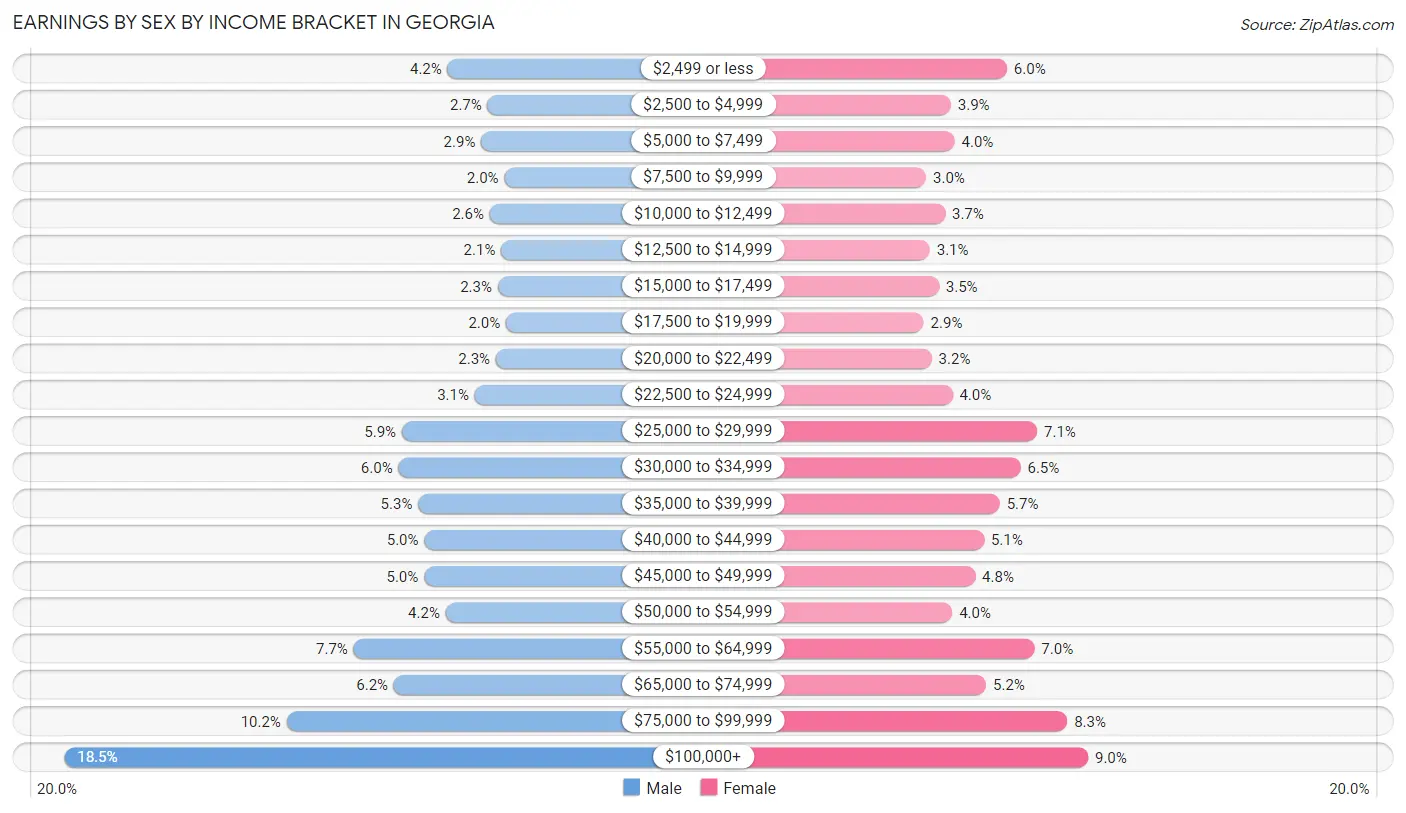
Earnings by Sex by Income Bracket in Georgia
The most common earnings brackets in Georgia are $100,000+ for men (539,618 | 18.5%) and $100,000+ for women (243,842 | 9.0%).
| Income | Male | Female |
| $2,499 or less | 120,922 (4.2%) | 161,887 (6.0%) |
| $2,500 to $4,999 | 77,171 (2.6%) | 105,286 (3.9%) |
| $5,000 to $7,499 | 84,214 (2.9%) | 108,904 (4.0%) |
| $7,500 to $9,999 | 58,971 (2.0%) | 80,223 (3.0%) |
| $10,000 to $12,499 | 74,857 (2.6%) | 99,279 (3.7%) |
| $12,500 to $14,999 | 62,402 (2.1%) | 83,957 (3.1%) |
| $15,000 to $17,499 | 66,167 (2.3%) | 93,080 (3.5%) |
| $17,500 to $19,999 | 57,218 (2.0%) | 77,597 (2.9%) |
| $20,000 to $22,499 | 68,276 (2.3%) | 85,852 (3.2%) |
| $22,500 to $24,999 | 91,313 (3.1%) | 106,780 (4.0%) |
| $25,000 to $29,999 | 170,810 (5.9%) | 192,456 (7.1%) |
| $30,000 to $34,999 | 174,720 (6.0%) | 175,731 (6.5%) |
| $35,000 to $39,999 | 152,935 (5.2%) | 154,513 (5.7%) |
| $40,000 to $44,999 | 146,276 (5.0%) | 138,567 (5.1%) |
| $45,000 to $49,999 | 146,699 (5.0%) | 129,672 (4.8%) |
| $50,000 to $54,999 | 122,927 (4.2%) | 106,507 (4.0%) |
| $55,000 to $64,999 | 223,623 (7.7%) | 189,624 (7.0%) |
| $65,000 to $74,999 | 179,707 (6.2%) | 140,849 (5.2%) |
| $75,000 to $99,999 | 296,807 (10.2%) | 222,849 (8.3%) |
| $100,000+ | 539,618 (18.5%) | 243,842 (9.0%) |
| Total | 2,915,633 (100.0%) | 2,697,455 (100.0%) |
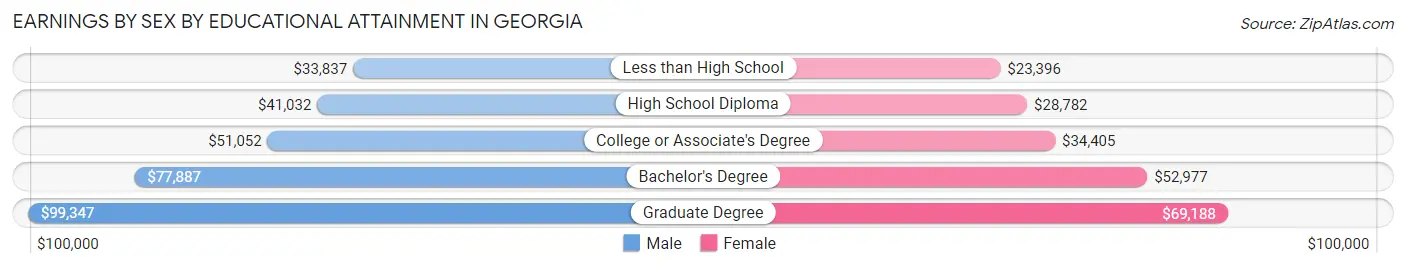
Earnings by Sex by Educational Attainment in Georgia
Average earnings in Georgia are $53,910 for men and $39,873 for women, a difference of 26.0%. Men with an educational attainment of graduate degree enjoy the highest average annual earnings of $99,347, while those with less than high school education earn the least with $33,837. Women with an educational attainment of graduate degree earn the most with the average annual earnings of $69,188, while those with less than high school education have the smallest earnings of $23,396.
| Educational Attainment | Male Income | Female Income |
| Less than High School | $33,837 | $23,396 |
| High School Diploma | $41,032 | $28,782 |
| College or Associate's Degree | $51,052 | $34,405 |
| Bachelor's Degree | $77,887 | $52,977 |
| Graduate Degree | $99,347 | $69,188 |
| Total | $53,910 | $39,873 |
Family Income in Georgia
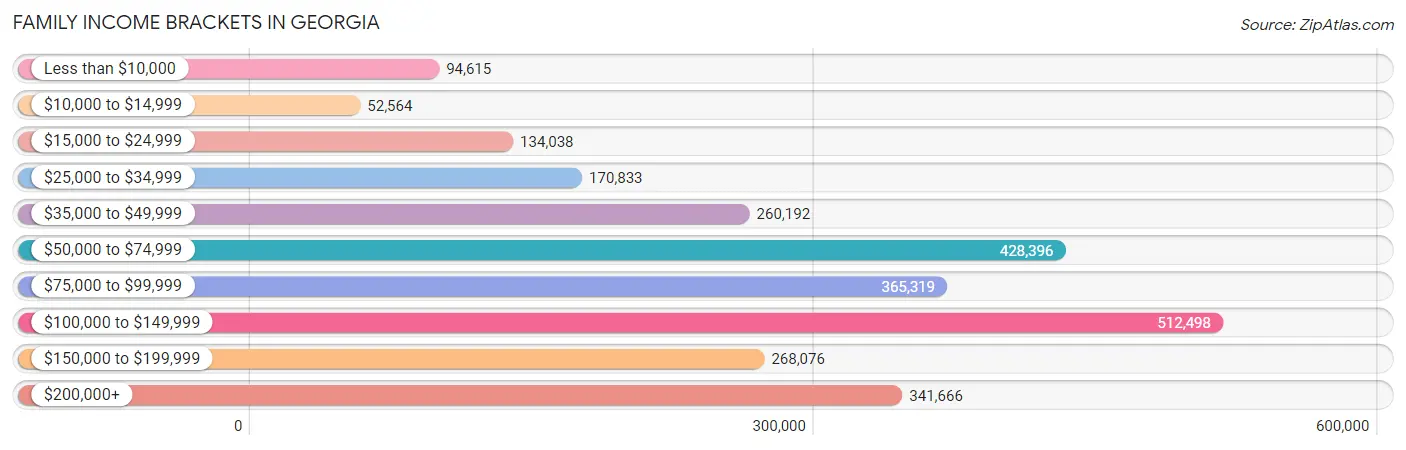
Family Income Brackets in Georgia
According to the Georgia family income data, there are 512,498 families falling into the $100,000 to $149,999 income range, which is the most common income bracket and makes up 19.5% of all families. Conversely, the $10,000 to $14,999 income bracket is the least frequent group with only 52,564 families (2.0%) belonging to this category.
| Income Bracket | # Families | % Families |
| Less than $10,000 | 94,615 | 3.6% |
| $10,000 to $14,999 | 52,564 | 2.0% |
| $15,000 to $24,999 | 134,038 | 5.1% |
| $25,000 to $34,999 | 170,833 | 6.5% |
| $35,000 to $49,999 | 260,192 | 9.9% |
| $50,000 to $74,999 | 428,396 | 16.3% |
| $75,000 to $99,999 | 365,319 | 13.9% |
| $100,000 to $149,999 | 512,498 | 19.5% |
| $150,000 to $199,999 | 268,076 | 10.2% |
| $200,000+ | 341,666 | 13.0% |
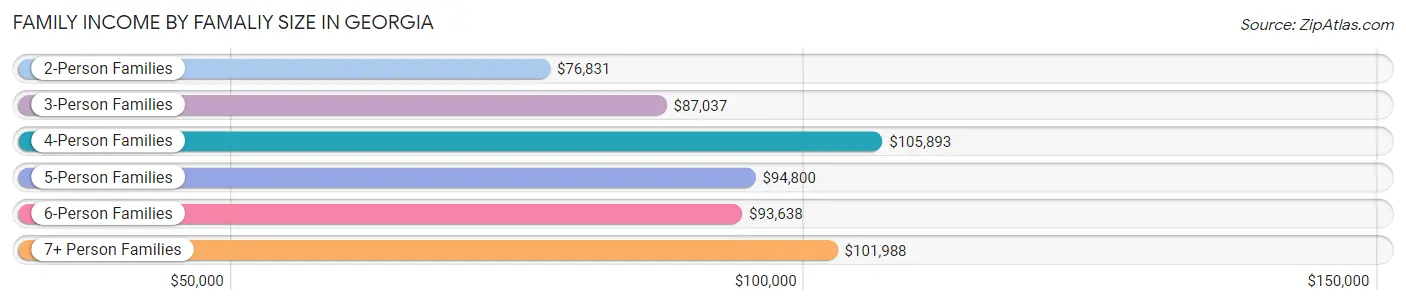
Family Income by Famaliy Size in Georgia
4-person families (484,035 | 18.4%) account for the highest median family income in Georgia with $105,893 per family, while 2-person families (1,189,336 | 45.3%) have the highest median income of $38,416 per family member.
| Income Bracket | # Families | Median Income |
| 2-Person Families | 1,189,336 (45.3%) | $76,831 |
| 3-Person Families | 615,148 (23.4%) | $87,037 |
| 4-Person Families | 484,035 (18.4%) | $105,893 |
| 5-Person Families | 216,402 (8.2%) | $94,800 |
| 6-Person Families | 79,080 (3.0%) | $93,638 |
| 7+ Person Families | 44,196 (1.7%) | $101,988 |
| Total | 2,628,197 (100.0%) | $86,169 |
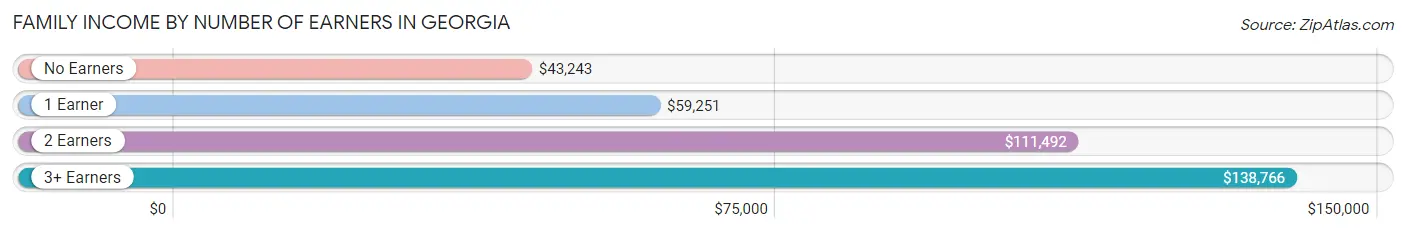
Family Income by Number of Earners in Georgia
The median family income in Georgia is $86,169, with families comprising 3+ earners (291,762) having the highest median family income of $138,766, while families with no earners (367,178) have the lowest median family income of $43,243, accounting for 11.1% and 14.0% of families, respectively.
| Number of Earners | # Families | Median Income |
| No Earners | 367,178 (14.0%) | $43,243 |
| 1 Earner | 881,586 (33.5%) | $59,251 |
| 2 Earners | 1,087,671 (41.4%) | $111,492 |
| 3+ Earners | 291,762 (11.1%) | $138,766 |
| Total | 2,628,197 (100.0%) | $86,169 |
Household Income in Georgia
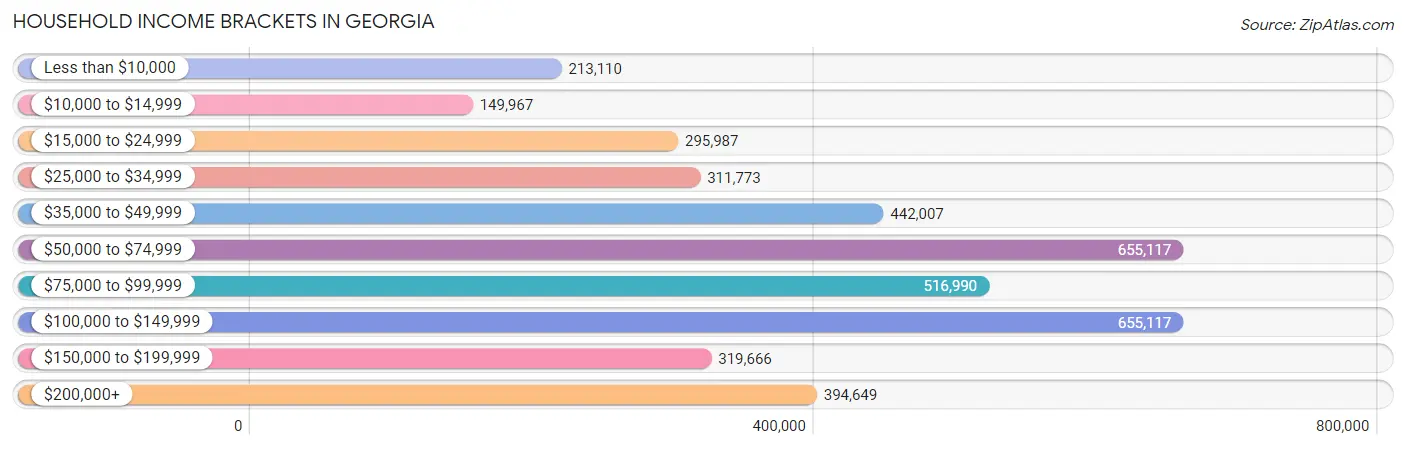
Household Income Brackets in Georgia
With 655,117 households falling in the category, the $50,000 to $74,999 income range is the most frequent in Georgia, accounting for 16.6% of all households. In contrast, only 149,967 households (3.8%) fall into the $10,000 to $14,999 income bracket, making it the least populous group.
| Income Bracket | # Households | % Households |
| Less than $10,000 | 213,110 | 5.4% |
| $10,000 to $14,999 | 149,967 | 3.8% |
| $15,000 to $24,999 | 295,987 | 7.5% |
| $25,000 to $34,999 | 311,773 | 7.9% |
| $35,000 to $49,999 | 442,007 | 11.2% |
| $50,000 to $74,999 | 655,117 | 16.6% |
| $75,000 to $99,999 | 516,990 | 13.1% |
| $100,000 to $149,999 | 655,117 | 16.6% |
| $150,000 to $199,999 | 319,666 | 8.1% |
| $200,000+ | 394,649 | 10.0% |
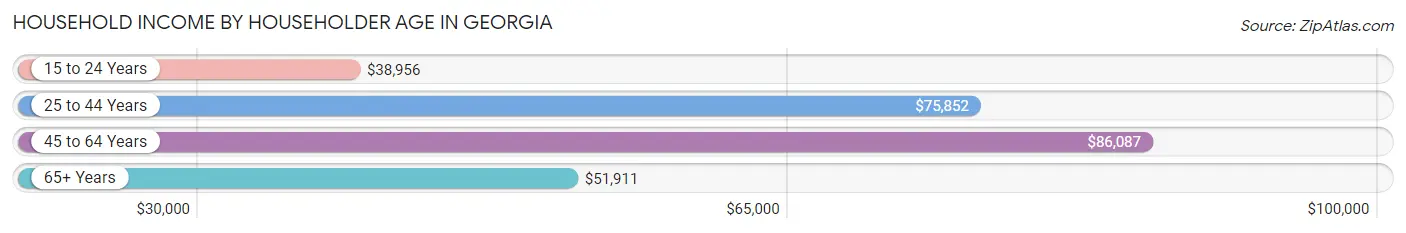
Household Income by Householder Age in Georgia
The median household income in Georgia is $71,355, with the highest median household income of $86,087 found in the 45 to 64 years age bracket for the primary householder. A total of 1,509,709 households (38.3%) fall into this category. Meanwhile, the 15 to 24 years age bracket for the primary householder has the lowest median household income of $38,956, with 148,976 households (3.8%) in this group.
| Income Bracket | # Households | Median Income |
| 15 to 24 Years | 148,976 (3.8%) | $38,956 |
| 25 to 44 Years | 1,349,796 (34.2%) | $75,852 |
| 45 to 64 Years | 1,509,709 (38.3%) | $86,087 |
| 65+ Years | 938,009 (23.8%) | $51,911 |
| Total | 3,946,490 (100.0%) | $71,355 |
Poverty in Georgia
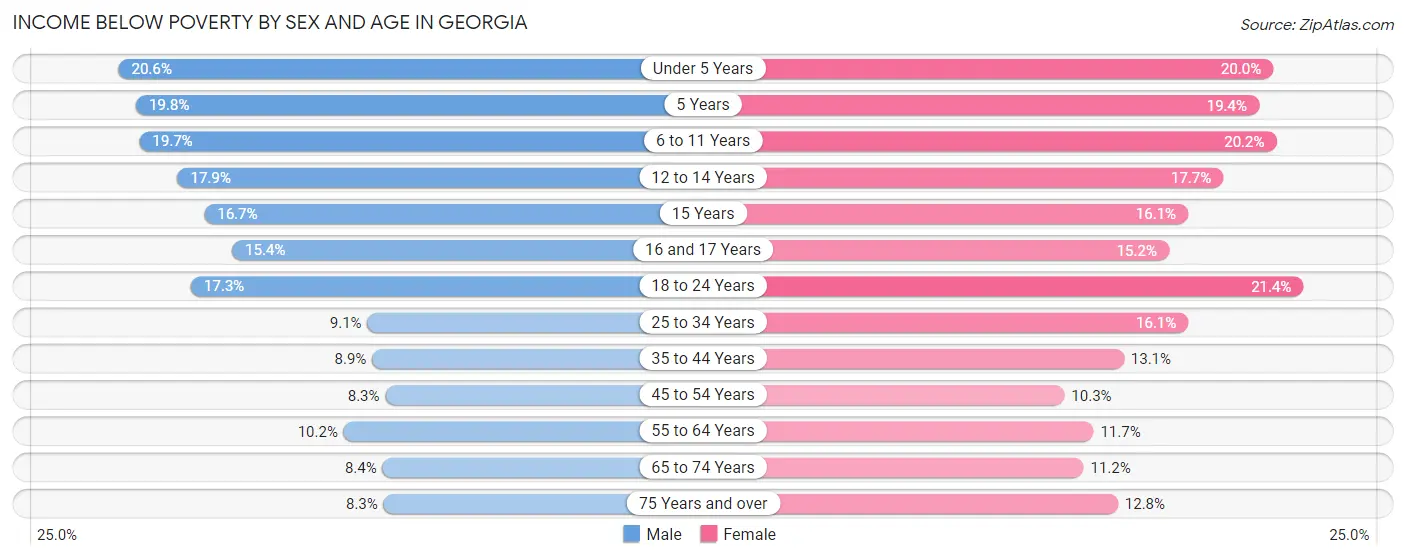
Income Below Poverty by Sex and Age in Georgia
With 12.2% poverty level for males and 14.8% for females among the residents of Georgia, under 5 year old males and 18 to 24 year old females are the most vulnerable to poverty, with 66,346 males (20.6%) and 100,312 females (21.4%) in their respective age groups living below the poverty level.
| Age Bracket | Male | Female |
| Under 5 Years | 66,346 (20.6%) | 60,909 (20.0%) |
| 5 Years | 13,198 (19.8%) | 12,288 (19.4%) |
| 6 to 11 Years | 82,902 (19.7%) | 82,092 (20.2%) |
| 12 to 14 Years | 41,190 (17.9%) | 38,152 (17.7%) |
| 15 Years | 13,138 (16.7%) | 12,165 (16.1%) |
| 16 and 17 Years | 22,852 (15.4%) | 21,786 (15.2%) |
| 18 to 24 Years | 83,384 (17.3%) | 100,312 (21.4%) |
| 25 to 34 Years | 63,782 (9.1%) | 118,948 (16.1%) |
| 35 to 44 Years | 59,357 (8.9%) | 94,772 (13.1%) |
| 45 to 54 Years | 55,646 (8.3%) | 73,497 (10.3%) |
| 55 to 64 Years | 63,816 (10.2%) | 79,616 (11.7%) |
| 65 to 74 Years | 35,865 (8.4%) | 56,936 (11.2%) |
| 75 Years and over | 19,497 (8.3%) | 43,127 (12.8%) |
| Total | 620,973 (12.2%) | 794,600 (14.8%) |
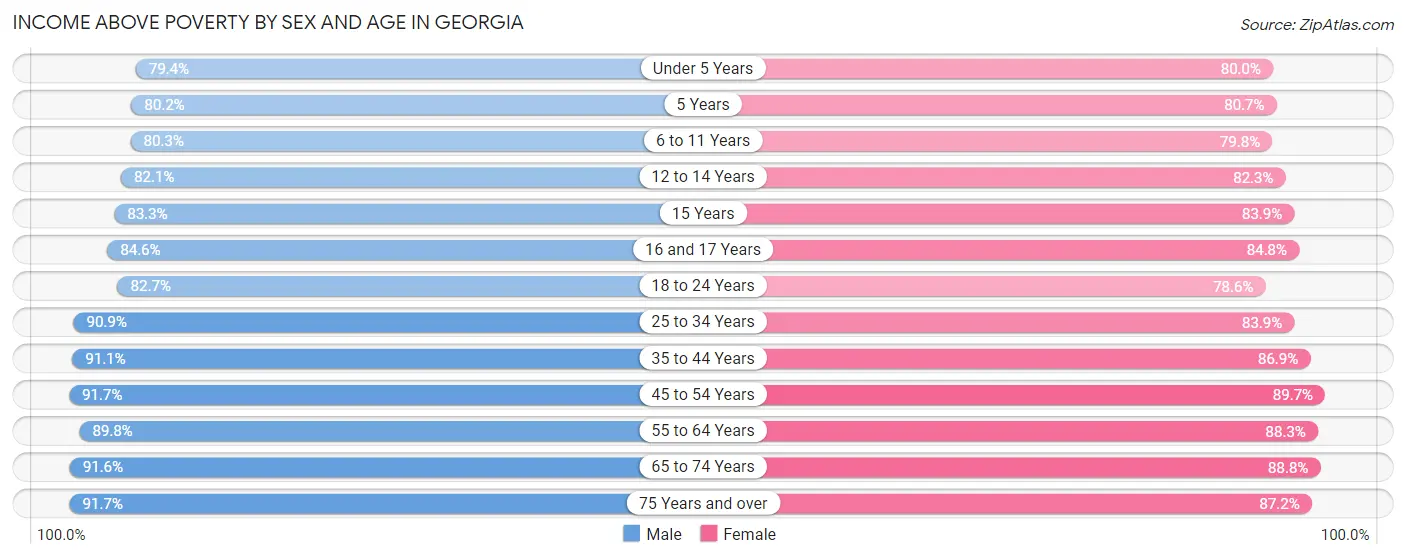
Income Above Poverty by Sex and Age in Georgia
According to the poverty statistics in Georgia, males aged 45 to 54 years and females aged 45 to 54 years are the age groups that are most secure financially, with 91.7% of males and 89.7% of females in these age groups living above the poverty line.
| Age Bracket | Male | Female |
| Under 5 Years | 255,053 (79.4%) | 243,505 (80.0%) |
| 5 Years | 53,367 (80.2%) | 51,228 (80.6%) |
| 6 to 11 Years | 338,635 (80.3%) | 325,053 (79.8%) |
| 12 to 14 Years | 188,951 (82.1%) | 177,537 (82.3%) |
| 15 Years | 65,732 (83.3%) | 63,597 (83.9%) |
| 16 and 17 Years | 125,800 (84.6%) | 121,814 (84.8%) |
| 18 to 24 Years | 399,167 (82.7%) | 368,179 (78.6%) |
| 25 to 34 Years | 637,507 (90.9%) | 621,267 (83.9%) |
| 35 to 44 Years | 609,824 (91.1%) | 629,257 (86.9%) |
| 45 to 54 Years | 618,306 (91.7%) | 638,150 (89.7%) |
| 55 to 64 Years | 562,634 (89.8%) | 602,306 (88.3%) |
| 65 to 74 Years | 391,726 (91.6%) | 450,472 (88.8%) |
| 75 Years and over | 214,230 (91.7%) | 293,560 (87.2%) |
| Total | 4,460,932 (87.8%) | 4,585,925 (85.2%) |
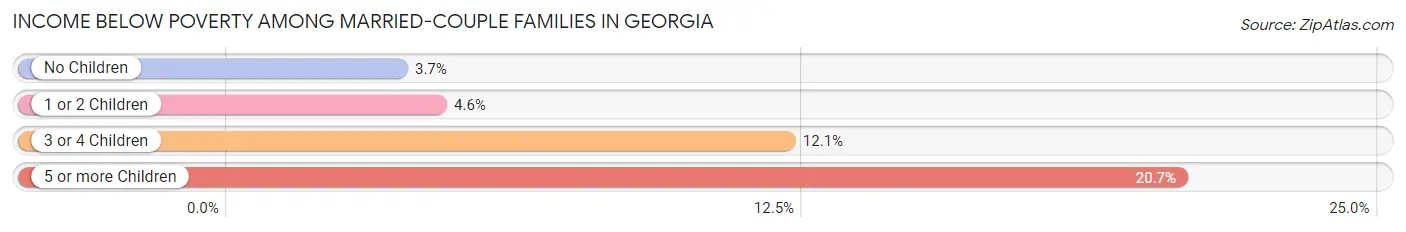
Income Below Poverty Among Married-Couple Families in Georgia
The poverty statistics for married-couple families in Georgia show that 4.8% or 88,133 of the total 1,848,105 families live below the poverty line. Families with 5 or more children have the highest poverty rate of 20.7%, comprising of 2,580 families. On the other hand, families with no children have the lowest poverty rate of 3.7%, which includes 39,099 families.
| Children | Above Poverty | Below Poverty |
| No Children | 1,018,382 (96.3%) | 39,099 (3.7%) |
| 1 or 2 Children | 603,566 (95.5%) | 28,751 (4.5%) |
| 3 or 4 Children | 128,123 (87.9%) | 17,703 (12.1%) |
| 5 or more Children | 9,901 (79.3%) | 2,580 (20.7%) |
| Total | 1,759,972 (95.2%) | 88,133 (4.8%) |
Income Below Poverty Among Single-Parent Households in Georgia
According to the poverty data in Georgia, 14.0% or 26,521 single-father households and 25.2% or 148,797 single-mother households are living below the poverty line. Among single-father households, those with 5 or more children have the highest poverty rate, with 732 households (45.4%) experiencing poverty. Likewise, among single-mother households, those with 5 or more children have the highest poverty rate, with 4,823 households (71.4%) falling below the poverty line.
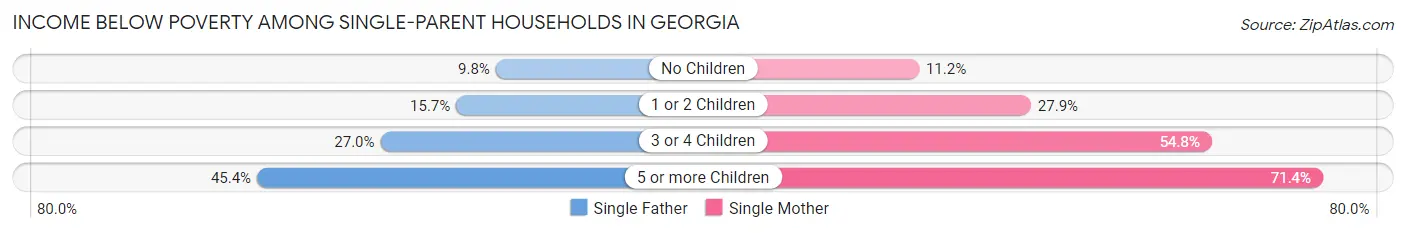
| Children | Single Father | Single Mother |
| No Children | 8,684 (9.8%) | 24,438 (11.2%) |
| 1 or 2 Children | 13,504 (15.7%) | 84,026 (27.9%) |
| 3 or 4 Children | 3,601 (27.0%) | 35,510 (54.8%) |
| 5 or more Children | 732 (45.4%) | 4,823 (71.4%) |
| Total | 26,521 (14.0%) | 148,797 (25.2%) |
Income Below Poverty Among Married-Couple vs Single-Parent Households in Georgia
The poverty data for Georgia shows that 88,133 of the married-couple family households (4.8%) and 175,318 of the single-parent households (22.5%) are living below the poverty level. Within the married-couple family households, those with 5 or more children have the highest poverty rate, with 2,580 households (20.7%) falling below the poverty line. Among the single-parent households, those with 5 or more children have the highest poverty rate, with 5,555 household (66.4%) living below poverty.
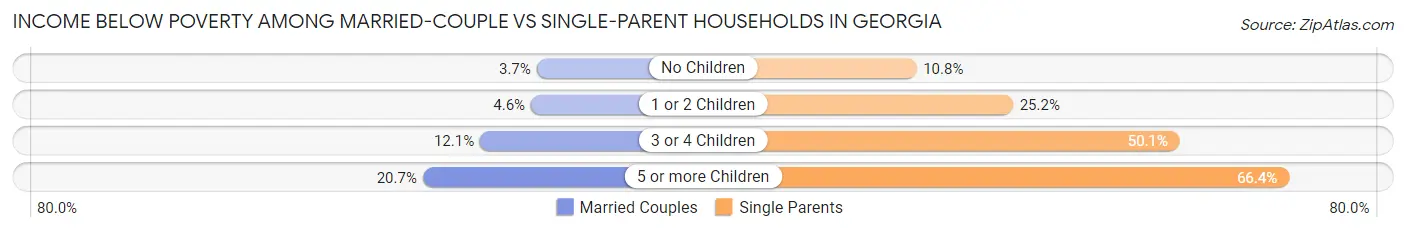
| Children | Married-Couple Families | Single-Parent Households |
| No Children | 39,099 (3.7%) | 33,122 (10.8%) |
| 1 or 2 Children | 28,751 (4.5%) | 97,530 (25.2%) |
| 3 or 4 Children | 17,703 (12.1%) | 39,111 (50.1%) |
| 5 or more Children | 2,580 (20.7%) | 5,555 (66.4%) |
| Total | 88,133 (4.8%) | 175,318 (22.5%) |
Largest Zip Codes by Population in Georgia
The largest zip codes in Georgia by population are 30044 (100,056), 30043 (88,050), 30024 (85,442), 30349 (78,431), and 30040 (77,848).
1.30044
100,056 (0.93%)
2.30043
88,050 (0.82%)
3.30024
85,442 (0.80%)
4.30349
78,431 (0.73%)
5.30040
77,848 (0.73%)
6.30052
74,564 (0.70%)
7.30041
73,865 (0.69%)
8.30127
71,642 (0.67%)
9.30281
70,433 (0.66%)
10.30096
69,456 (0.65%)
11.30047
67,675 (0.63%)
12.30135
67,299 (0.63%)
13.30004
66,406 (0.62%)
14.30022
65,985 (0.62%)
15.30188
64,757 (0.60%)
16.30331
64,295 (0.60%)
17.30058
63,647 (0.59%)
18.30062
62,958 (0.59%)
19.30101
62,284 (0.58%)
20.30906
62,166 (0.58%)
21.31907
62,140 (0.58%)
22.30083
60,937 (0.57%)
23.30066
60,795 (0.57%)
24.30253
60,539 (0.56%)
25.30318
59,559 (0.56%)
26.30263
59,462 (0.55%)
27.30016
59,179 (0.55%)
28.30144
58,836 (0.55%)
29.31088
58,298 (0.54%)
30.31419
58,073 (0.54%)
Largest Cities by Population in Georgia
The largest cities in Georgia by population are Atlanta (494,838), Columbus (204,572), Augusta-Richmond County consolidated government (balance) (201,615), Macon Bibb County (156,554), and Savannah (147,583).
1.Atlanta
494,838 (4.62%)
2.Columbus
204,572 (1.91%)
201,615 (1.88%)
156,554 (1.46%)
5.Savannah
147,583 (1.38%)
126,672 (1.18%)
107,865 (1.01%)
107,221 (1.00%)
9.Roswell
92,770 (0.87%)
10.Johns Creek
82,230 (0.77%)
80,374 (0.75%)
12.Albany
68,926 (0.64%)
13.Alpharetta
65,884 (0.61%)
14.Marietta
61,387 (0.57%)
15.Stonecrest
59,445 (0.55%)
16.Brookhaven
56,848 (0.53%)
17.Smyrna
55,863 (0.52%)
18.Valdosta
55,266 (0.52%)
19.Dunwoody
51,458 (0.48%)
20.Gainesville
42,780 (0.40%)
21.Newnan
42,689 (0.40%)
42,147 (0.39%)
23.Mableton
41,647 (0.39%)
24.Milton
41,029 (0.38%)
38,414 (0.36%)
26.East Point
38,113 (0.36%)
27.Rome
37,621 (0.35%)
28.Evans
37,456 (0.35%)
29.Tucker
36,994 (0.35%)
30.Douglasville
35,252 (0.33%)
Largest Counties by Population in Georgia
The largest counties in Georgia by population are Fulton County (1,061,944), Gwinnett County (957,977), Cobb County (765,813), DeKalb County (761,209), and Clayton County (296,312).
1,061,944 (9.90%)
957,977 (8.93%)
765,813 (7.14%)
761,209 (7.10%)
296,312 (2.76%)
296,266 (2.76%)
268,567 (2.50%)
253,225 (2.36%)
240,853 (2.25%)
206,153 (1.92%)
11.Hall County
204,953 (1.91%)
204,572 (1.91%)
169,898 (1.58%)
164,117 (1.53%)
156,921 (1.46%)
16.Bibb County
156,554 (1.46%)
147,449 (1.38%)
144,735 (1.35%)
128,864 (1.20%)
120,060 (1.12%)
119,259 (1.11%)
118,257 (1.10%)
113,298 (1.06%)
109,410 (1.02%)
103,033 (0.96%)
26.Floyd County
98,541 (0.92%)
97,752 (0.91%)
93,641 (0.87%)
85,038 (0.79%)
30.Glynn County
84,566 (0.79%)
Race in Georgia
The most populous races in Georgia are White / Caucasian (5,820,019 | 54.3%), Black / African American (3,373,948 | 31.5%), and Hispanic or Latino (1,078,457 | 10.1%).
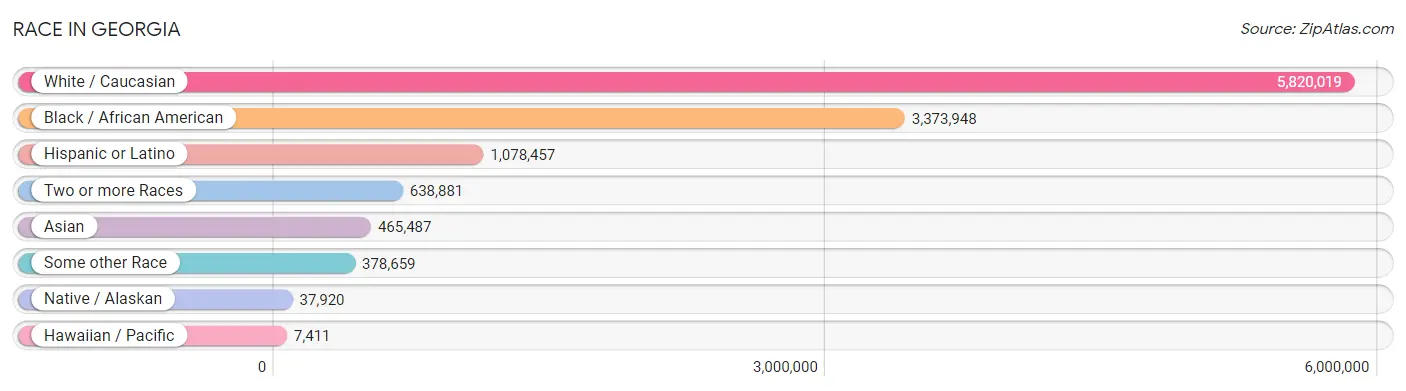
| Race | # Population | % Population |
| Asian | 465,487 | 4.3% |
| Black / African American | 3,373,948 | 31.5% |
| Hawaiian / Pacific | 7,411 | 0.1% |
| Hispanic or Latino | 1,078,457 | 10.1% |
| Native / Alaskan | 37,920 | 0.4% |
| White / Caucasian | 5,820,019 | 54.3% |
| Two or more Races | 638,881 | 6.0% |
| Some other Race | 378,659 | 3.5% |
| Total | 10,722,325 | 100.0% |
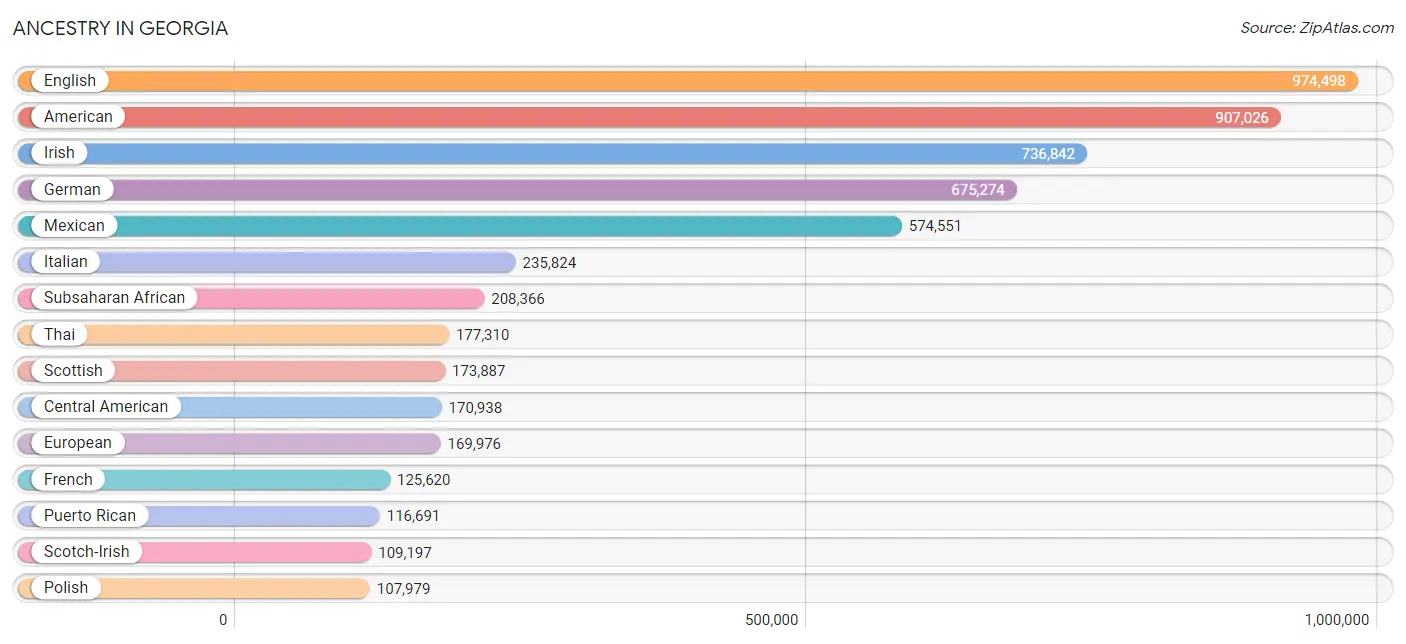
Ancestry in Georgia
The most populous ancestries reported in Georgia are English (974,498 | 9.1%), American (907,026 | 8.5%), Irish (736,842 | 6.9%), German (675,274 | 6.3%), and Mexican (574,551 | 5.4%), together accounting for 36.1% of all Georgia residents.
| Ancestry | # Population | % Population |
| Afghan | 1,978 | 0.0% |
| African | 97,024 | 0.9% |
| Alaska Native | 186 | 0.0% |
| Alaskan Athabascan | 62 | 0.0% |
| Albanian | 1,628 | 0.0% |
| Aleut | 55 | 0.0% |
| Alsatian | 143 | 0.0% |
| American | 907,026 | 8.5% |
| Apache | 1,852 | 0.0% |
| Arab | 35,290 | 0.3% |
| Arapaho | 118 | 0.0% |
| Argentinean | 5,735 | 0.1% |
| Armenian | 3,197 | 0.0% |
| Assyrian / Chaldean / Syriac | 360 | 0.0% |
| Australian | 2,366 | 0.0% |
| Austrian | 10,267 | 0.1% |
| Bahamian | 5,098 | 0.1% |
| Bangladeshi | 5,534 | 0.1% |
| Barbadian | 3,817 | 0.0% |
| Basque | 353 | 0.0% |
| Belgian | 3,893 | 0.0% |
| Belizean | 1,930 | 0.0% |
| Bermudan | 587 | 0.0% |
| Bhutanese | 23,741 | 0.2% |
| Blackfeet | 4,696 | 0.0% |
| Bolivian | 1,296 | 0.0% |
| Brazilian | 17,449 | 0.2% |
| British | 61,641 | 0.6% |
| British West Indian | 6,211 | 0.1% |
| Bulgarian | 2,219 | 0.0% |
| Burmese | 73,280 | 0.7% |
| Cajun | 2,172 | 0.0% |
| Cambodian | 303 | 0.0% |
| Canadian | 11,782 | 0.1% |
| Cape Verdean | 1,489 | 0.0% |
| Carpatho Rusyn | 23 | 0.0% |
| Celtic | 1,579 | 0.0% |
| Central American | 170,938 | 1.6% |
| Central American Indian | 14,624 | 0.1% |
| Cherokee | 39,099 | 0.4% |
| Cheyenne | 215 | 0.0% |
| Chickasaw | 263 | 0.0% |
| Chilean | 3,080 | 0.0% |
| Chinese | 282 | 0.0% |
| Chippewa | 889 | 0.0% |
| Choctaw | 2,651 | 0.0% |
| Colombian | 37,146 | 0.4% |
| Colville | 7 | 0.0% |
| Comanche | 272 | 0.0% |
| Costa Rican | 5,719 | 0.1% |
| Cree | 54 | 0.0% |
| Creek | 3,094 | 0.0% |
| Croatian | 3,802 | 0.0% |
| Crow | 334 | 0.0% |
| Cuban | 38,578 | 0.4% |
| Cypriot | 145 | 0.0% |
| Czech | 13,828 | 0.1% |
| Czechoslovakian | 3,584 | 0.0% |
| Danish | 14,826 | 0.1% |
| Delaware | 264 | 0.0% |
| Dominican | 28,516 | 0.3% |
| Dutch | 56,937 | 0.5% |
| Dutch West Indian | 650 | 0.0% |
| Eastern European | 21,258 | 0.2% |
| Ecuadorian | 6,753 | 0.1% |
| Egyptian | 5,022 | 0.1% |
| English | 974,498 | 9.1% |
| Estonian | 236 | 0.0% |
| Ethiopian | 23,384 | 0.2% |
| European | 169,976 | 1.6% |
| Fijian | 123 | 0.0% |
| Filipino | 4,481 | 0.0% |
| Finnish | 6,620 | 0.1% |
| French | 125,620 | 1.2% |
| French American Indian | 289 | 0.0% |
| French Canadian | 22,222 | 0.2% |
| German | 675,274 | 6.3% |
| German Russian | 465 | 0.0% |
| Ghanaian | 9,156 | 0.1% |
| Greek | 22,505 | 0.2% |
| Guamanian / Chamorro | 3,659 | 0.0% |
| Guatemalan | 65,283 | 0.6% |
| Guyanese | 11,516 | 0.1% |
| Haitian | 39,066 | 0.4% |
| Honduran | 33,944 | 0.3% |
| Hopi | 156 | 0.0% |
| Houma | 1 | 0.0% |
| Hungarian | 17,370 | 0.2% |
| Icelander | 628 | 0.0% |
| Indian (Asian) | 80,468 | 0.7% |
| Indonesian | 7,090 | 0.1% |
| Inupiat | 349 | 0.0% |
| Iranian | 10,750 | 0.1% |
| Iraqi | 3,182 | 0.0% |
| Irish | 736,842 | 6.9% |
| Iroquois | 1,108 | 0.0% |
| Israeli | 3,740 | 0.0% |
| Italian | 235,824 | 2.2% |
| Jamaican | 75,779 | 0.7% |
| Japanese | 7,067 | 0.1% |
| Jordanian | 997 | 0.0% |
| Kenyan | 3,621 | 0.0% |
| Korean | 51,636 | 0.5% |
| Laotian | 2,834 | 0.0% |
| Latvian | 1,984 | 0.0% |
| Lebanese | 10,068 | 0.1% |
| Liberian | 4,385 | 0.0% |
| Lithuanian | 7,887 | 0.1% |
| Lumbee | 876 | 0.0% |
| Luxembourger | 370 | 0.0% |
| Macedonian | 491 | 0.0% |
| Malaysian | 6,418 | 0.1% |
| Maltese | 437 | 0.0% |
| Marshallese | 84 | 0.0% |
| Menominee | 51 | 0.0% |
| Mexican | 574,551 | 5.4% |
| Mexican American Indian | 12,883 | 0.1% |
| Mongolian | 955 | 0.0% |
| Moroccan | 3,349 | 0.0% |
| Native Hawaiian | 7,556 | 0.1% |
| Navajo | 1,277 | 0.0% |
| New Zealander | 289 | 0.0% |
| Nicaraguan | 8,043 | 0.1% |
| Nigerian | 39,468 | 0.4% |
| Northern European | 11,069 | 0.1% |
| Norwegian | 37,650 | 0.4% |
| Okinawan | 586 | 0.0% |
| Osage | 85 | 0.0% |
| Ottawa | 35 | 0.0% |
| Paiute | 33 | 0.0% |
| Pakistani | 6,655 | 0.1% |
| Palestinian | 2,332 | 0.0% |
| Panamanian | 10,620 | 0.1% |
| Paraguayan | 443 | 0.0% |
| Pennsylvania German | 1,505 | 0.0% |
| Peruvian | 12,349 | 0.1% |
| Pima | 26 | 0.0% |
| Polish | 107,979 | 1.0% |
| Portuguese | 16,522 | 0.2% |
| Potawatomi | 308 | 0.0% |
| Pueblo | 242 | 0.0% |
| Puerto Rican | 116,691 | 1.1% |
| Puget Sound Salish | 101 | 0.0% |
| Romanian | 12,000 | 0.1% |
| Russian | 38,853 | 0.4% |
| Salvadoran | 47,108 | 0.4% |
| Samoan | 2,276 | 0.0% |
| Scandinavian | 18,031 | 0.2% |
| Scotch-Irish | 109,197 | 1.0% |
| Scottish | 173,887 | 1.6% |
| Seminole | 1,432 | 0.0% |
| Senegalese | 889 | 0.0% |
| Serbian | 1,603 | 0.0% |
| Shoshone | 60 | 0.0% |
| Sierra Leonean | 979 | 0.0% |
| Sioux | 1,769 | 0.0% |
| Slavic | 1,807 | 0.0% |
| Slovak | 6,155 | 0.1% |
| Slovene | 1,711 | 0.0% |
| Somali | 3,830 | 0.0% |
| South African | 3,812 | 0.0% |
| South American | 95,173 | 0.9% |
| South American Indian | 1,561 | 0.0% |
| Soviet Union | 193 | 0.0% |
| Spaniard | 12,452 | 0.1% |
| Spanish | 11,136 | 0.1% |
| Spanish American | 295 | 0.0% |
| Spanish American Indian | 52 | 0.0% |
| Sri Lankan | 72,518 | 0.7% |
| Subsaharan African | 208,366 | 1.9% |
| Sudanese | 1,766 | 0.0% |
| Swedish | 41,427 | 0.4% |
| Swiss | 12,469 | 0.1% |
| Syrian | 2,966 | 0.0% |
| Taiwanese | 9 | 0.0% |
| Thai | 177,310 | 1.7% |
| Tlingit-Haida | 8 | 0.0% |
| Tohono O'Odham | 35 | 0.0% |
| Tongan | 361 | 0.0% |
| Trinidadian and Tobagonian | 10,001 | 0.1% |
| Tsimshian | 26 | 0.0% |
| Turkish | 5,072 | 0.1% |
| U.S. Virgin Islander | 1,688 | 0.0% |
| Ugandan | 1,719 | 0.0% |
| Ukrainian | 13,600 | 0.1% |
| Uruguayan | 3,360 | 0.0% |
| Ute | 39 | 0.0% |
| Venezuelan | 24,012 | 0.2% |
| Vietnamese | 6,794 | 0.1% |
| Welsh | 45,950 | 0.4% |
| West Indian | 13,386 | 0.1% |
| Yakama | 49 | 0.0% |
| Yaqui | 145 | 0.0% |
| Yugoslavian | 7,818 | 0.1% |
| Yup'ik | 27 | 0.0% |
| Zimbabwean | 755 | 0.0% | View All 196 Rows |
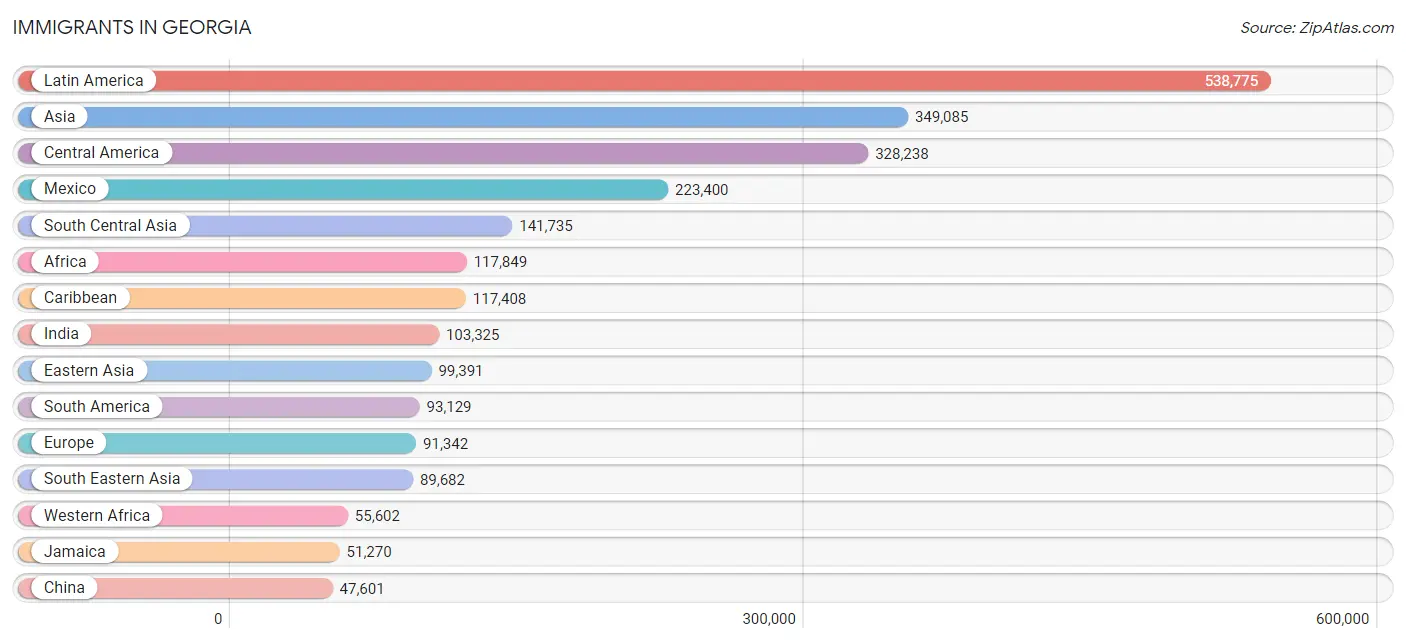
Immigrants in Georgia
The most numerous immigrant groups reported in Georgia came from Latin America (538,775 | 5.0%), Asia (349,085 | 3.3%), Central America (328,238 | 3.1%), Mexico (223,400 | 2.1%), and South Central Asia (141,735 | 1.3%), together accounting for 14.7% of all Georgia residents.
| Immigration Origin | # Population | % Population |
| Afghanistan | 2,278 | 0.0% |
| Africa | 117,849 | 1.1% |
| Albania | 243 | 0.0% |
| Argentina | 2,961 | 0.0% |
| Armenia | 171 | 0.0% |
| Asia | 349,085 | 3.3% |
| Australia | 1,849 | 0.0% |
| Austria | 891 | 0.0% |
| Azores | 26 | 0.0% |
| Bahamas | 3,222 | 0.0% |
| Bangladesh | 7,441 | 0.1% |
| Barbados | 1,750 | 0.0% |
| Belarus | 805 | 0.0% |
| Belgium | 892 | 0.0% |
| Belize | 1,191 | 0.0% |
| Bolivia | 869 | 0.0% |
| Bosnia and Herzegovina | 4,775 | 0.0% |
| Brazil | 18,211 | 0.2% |
| Bulgaria | 1,443 | 0.0% |
| Cabo Verde | 73 | 0.0% |
| Cambodia | 2,808 | 0.0% |
| Cameroon | 3,906 | 0.0% |
| Canada | 17,851 | 0.2% |
| Caribbean | 117,408 | 1.1% |
| Central America | 328,238 | 3.1% |
| Chile | 1,820 | 0.0% |
| China | 47,601 | 0.4% |
| Colombia | 23,813 | 0.2% |
| Congo | 1,542 | 0.0% |
| Costa Rica | 3,088 | 0.0% |
| Croatia | 716 | 0.0% |
| Cuba | 12,946 | 0.1% |
| Czechoslovakia | 1,364 | 0.0% |
| Denmark | 767 | 0.0% |
| Dominica | 2,022 | 0.0% |
| Dominican Republic | 11,847 | 0.1% |
| Eastern Africa | 36,680 | 0.3% |
| Eastern Asia | 99,391 | 0.9% |
| Eastern Europe | 34,642 | 0.3% |
| Ecuador | 4,046 | 0.0% |
| Egypt | 2,940 | 0.0% |
| El Salvador | 27,794 | 0.3% |
| England | 8,849 | 0.1% |
| Eritrea | 2,737 | 0.0% |
| Ethiopia | 17,643 | 0.2% |
| Europe | 91,342 | 0.9% |
| Fiji | 101 | 0.0% |
| France | 3,777 | 0.0% |
| Germany | 18,651 | 0.2% |
| Ghana | 11,747 | 0.1% |
| Greece | 1,253 | 0.0% |
| Grenada | 874 | 0.0% |
| Guatemala | 39,974 | 0.4% |
| Guyana | 10,397 | 0.1% |
| Haiti | 17,476 | 0.2% |
| Honduras | 23,500 | 0.2% |
| Hong Kong | 2,214 | 0.0% |
| Hungary | 710 | 0.0% |
| India | 103,325 | 1.0% |
| Indonesia | 2,261 | 0.0% |
| Iran | 6,717 | 0.1% |
| Iraq | 3,921 | 0.0% |
| Ireland | 1,321 | 0.0% |
| Israel | 2,671 | 0.0% |
| Italy | 2,552 | 0.0% |
| Jamaica | 51,270 | 0.5% |
| Japan | 7,969 | 0.1% |
| Jordan | 1,141 | 0.0% |
| Kazakhstan | 561 | 0.0% |
| Kenya | 6,963 | 0.1% |
| Korea | 43,756 | 0.4% |
| Kuwait | 822 | 0.0% |
| Laos | 4,400 | 0.0% |
| Latin America | 538,775 | 5.0% |
| Latvia | 774 | 0.0% |
| Lebanon | 1,739 | 0.0% |
| Liberia | 4,350 | 0.0% |
| Lithuania | 319 | 0.0% |
| Malaysia | 3,238 | 0.0% |
| Mexico | 223,400 | 2.1% |
| Micronesia | 841 | 0.0% |
| Middle Africa | 8,851 | 0.1% |
| Moldova | 1,029 | 0.0% |
| Morocco | 1,657 | 0.0% |
| Nepal | 3,559 | 0.0% |
| Netherlands | 1,911 | 0.0% |
| Nicaragua | 3,839 | 0.0% |
| Nigeria | 27,846 | 0.3% |
| North Macedonia | 199 | 0.0% |
| Northern Africa | 6,834 | 0.1% |
| Northern Europe | 23,028 | 0.2% |
| Norway | 310 | 0.0% |
| Oceania | 3,894 | 0.0% |
| Pakistan | 12,223 | 0.1% |
| Panama | 5,023 | 0.1% |
| Peru | 8,613 | 0.1% |
| Philippines | 20,700 | 0.2% |
| Poland | 3,179 | 0.0% |
| Portugal | 792 | 0.0% |
| Romania | 6,388 | 0.1% |
| Russia | 5,900 | 0.1% |
| Saudi Arabia | 1,096 | 0.0% |
| Scotland | 1,124 | 0.0% |
| Senegal | 1,138 | 0.0% |
| Serbia | 502 | 0.0% |
| Sierra Leone | 1,754 | 0.0% |
| Singapore | 1,045 | 0.0% |
| Somalia | 1,460 | 0.0% |
| South Africa | 6,116 | 0.1% |
| South America | 93,129 | 0.9% |
| South Central Asia | 141,735 | 1.3% |
| South Eastern Asia | 89,682 | 0.8% |
| Southern Europe | 6,769 | 0.1% |
| Spain | 2,141 | 0.0% |
| Sri Lanka | 1,437 | 0.0% |
| St. Vincent and the Grenadines | 776 | 0.0% |
| Sudan | 1,212 | 0.0% |
| Sweden | 838 | 0.0% |
| Switzerland | 516 | 0.0% |
| Syria | 1,290 | 0.0% |
| Taiwan | 6,160 | 0.1% |
| Thailand | 4,387 | 0.0% |
| Trinidad and Tobago | 8,684 | 0.1% |
| Turkey | 2,996 | 0.0% |
| Uganda | 2,337 | 0.0% |
| Ukraine | 4,193 | 0.0% |
| Uruguay | 2,804 | 0.0% |
| Uzbekistan | 1,716 | 0.0% |
| Venezuela | 19,012 | 0.2% |
| Vietnam | 45,797 | 0.4% |
| West Indies | 808 | 0.0% |
| Western Africa | 55,602 | 0.5% |
| Western Asia | 17,767 | 0.2% |
| Western Europe | 26,669 | 0.3% |
| Yemen | 200 | 0.0% |
| Zaire | 3,069 | 0.0% |
| Zimbabwe | 1,283 | 0.0% | View All 137 Rows |
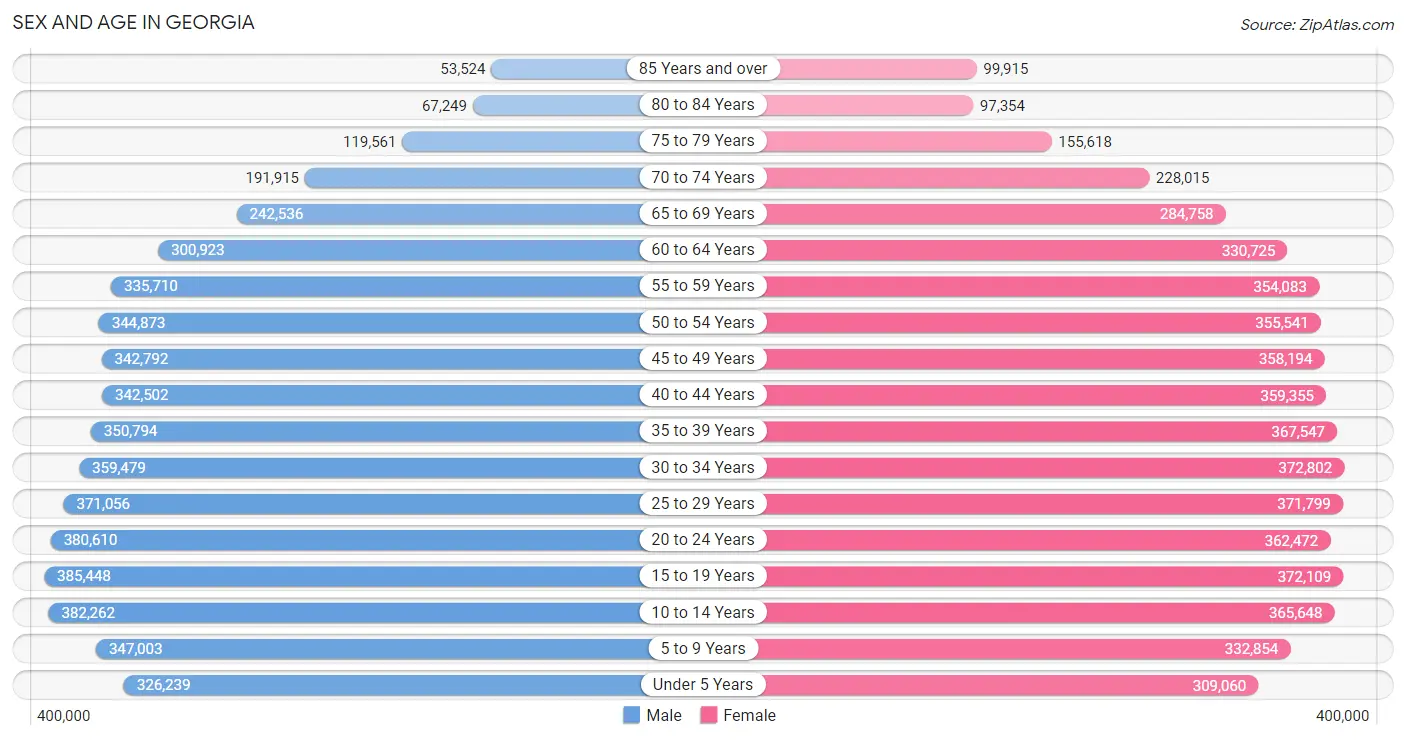
Sex and Age in Georgia
Sex and Age in Georgia
The most populous age groups in Georgia are 15 to 19 Years (385,448 | 7.3%) for men and 30 to 34 Years (372,802 | 6.8%) for women.
| Age Bracket | Male | Female |
| Under 5 Years | 326,239 (6.2%) | 309,060 (5.6%) |
| 5 to 9 Years | 347,003 (6.6%) | 332,854 (6.1%) |
| 10 to 14 Years | 382,262 (7.3%) | 365,648 (6.7%) |
| 15 to 19 Years | 385,448 (7.3%) | 372,109 (6.8%) |
| 20 to 24 Years | 380,610 (7.3%) | 362,472 (6.6%) |
| 25 to 29 Years | 371,056 (7.1%) | 371,799 (6.8%) |
| 30 to 34 Years | 359,479 (6.9%) | 372,802 (6.8%) |
| 35 to 39 Years | 350,794 (6.7%) | 367,547 (6.7%) |
| 40 to 44 Years | 342,502 (6.5%) | 359,355 (6.6%) |
| 45 to 49 Years | 342,792 (6.5%) | 358,194 (6.5%) |
| 50 to 54 Years | 344,873 (6.6%) | 355,541 (6.5%) |
| 55 to 59 Years | 335,710 (6.4%) | 354,083 (6.5%) |
| 60 to 64 Years | 300,923 (5.7%) | 330,725 (6.0%) |
| 65 to 69 Years | 242,536 (4.6%) | 284,758 (5.2%) |
| 70 to 74 Years | 191,915 (3.7%) | 228,015 (4.2%) |
| 75 to 79 Years | 119,561 (2.3%) | 155,618 (2.8%) |
| 80 to 84 Years | 67,249 (1.3%) | 97,354 (1.8%) |
| 85 Years and over | 53,524 (1.0%) | 99,915 (1.8%) |
| Total | 5,244,476 (100.0%) | 5,477,849 (100.0%) |
Families and Households in Georgia
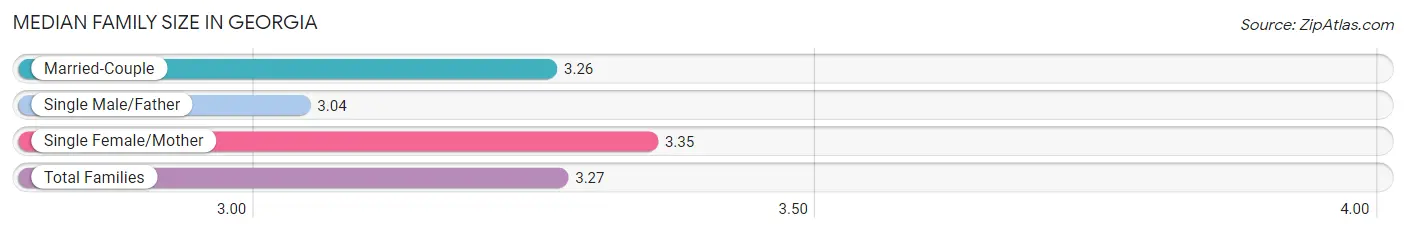
Median Family Size in Georgia
The median family size in Georgia is 3.27 persons per family, with single female/mother families (590,477 | 22.5%) accounting for the largest median family size of 3.35 persons per family. On the other hand, single male/father families (189,615 | 7.2%) represent the smallest median family size with 3.04 persons per family.
| Family Type | # Families | Family Size |
| Married-Couple | 1,848,105 (70.3%) | 3.26 |
| Single Male/Father | 189,615 (7.2%) | 3.04 |
| Single Female/Mother | 590,477 (22.5%) | 3.35 |
| Total Families | 2,628,197 (100.0%) | 3.27 |
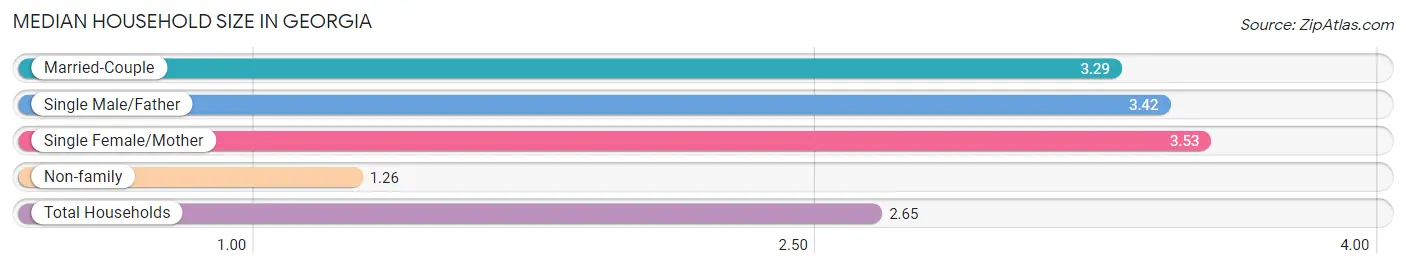
Median Household Size in Georgia
The median household size in Georgia is 2.65 persons per household, with single female/mother households (590,477 | 15.0%) accounting for the largest median household size of 3.53 persons per household. non-family households (1,318,293 | 33.4%) represent the smallest median household size with 1.26 persons per household.
| Household Type | # Households | Household Size |
| Married-Couple | 1,848,105 (46.8%) | 3.29 |
| Single Male/Father | 189,615 (4.8%) | 3.42 |
| Single Female/Mother | 590,477 (15.0%) | 3.53 |
| Non-family | 1,318,293 (33.4%) | 1.26 |
| Total Households | 3,946,490 (100.0%) | 2.65 |
Household Size by Marriage Status in Georgia
Out of a total of 3,946,490 households in Georgia, 2,628,197 (66.6%) are family households, while 1,318,293 (33.4%) are nonfamily households. The most numerous type of family households are 2-person households, comprising 1,114,938, and the most common type of nonfamily households are 1-person households, comprising 1,085,390.
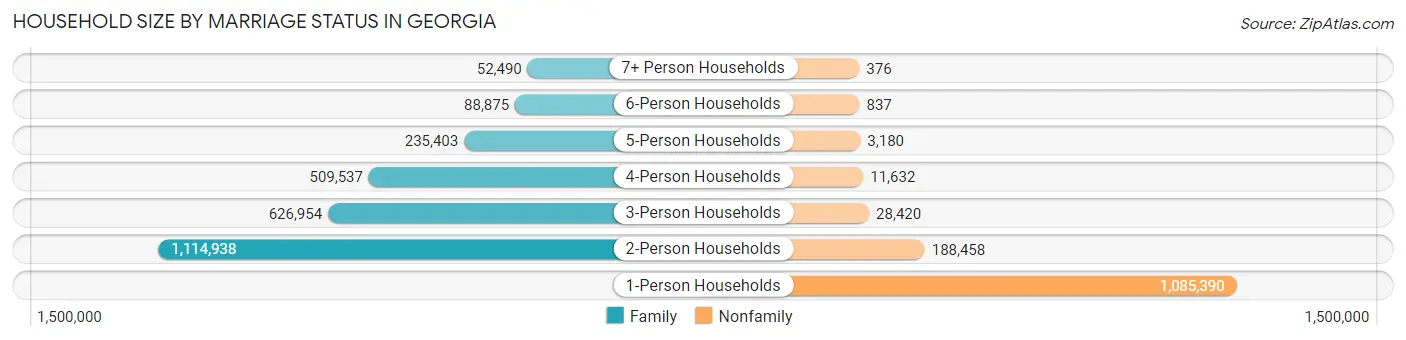
| Household Size | Family Households | Nonfamily Households |
| 1-Person Households | - | 1,085,390 (27.5%) |
| 2-Person Households | 1,114,938 (28.2%) | 188,458 (4.8%) |
| 3-Person Households | 626,954 (15.9%) | 28,420 (0.7%) |
| 4-Person Households | 509,537 (12.9%) | 11,632 (0.3%) |
| 5-Person Households | 235,403 (6.0%) | 3,180 (0.1%) |
| 6-Person Households | 88,875 (2.2%) | 837 (0.0%) |
| 7+ Person Households | 52,490 (1.3%) | 376 (0.0%) |
| Total | 2,628,197 (66.6%) | 1,318,293 (33.4%) |
Female Fertility in Georgia
Fertility by Age in Georgia
Average fertility rate in Georgia is 51.0 births per 1,000 women. Women in the age bracket of 20 to 34 years have the highest fertility rate with 86.0 births per 1,000 women. Women in the age bracket of 20 to 34 years acount for 70.8% of all women with births.
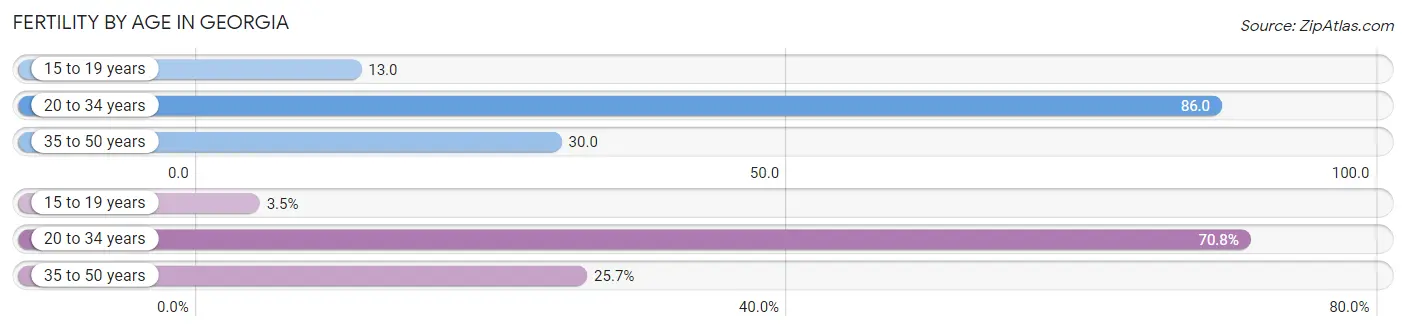
| Age Bracket | Women with Births | Births / 1,000 Women |
| 15 to 19 years | 4,714 (3.5%) | 13.0 |
| 20 to 34 years | 94,916 (70.8%) | 86.0 |
| 35 to 50 years | 34,524 (25.7%) | 30.0 |
| Total | 134,154 (100.0%) | 51.0 |
Fertility by Age by Marriage Status in Georgia
63.9% of women with births (134,154) in Georgia are married. The highest percentage of unmarried women with births falls into 15 to 19 years age bracket with 89.4% of them unmarried at the time of birth, while the lowest percentage of unmarried women with births belong to 35 to 50 years age bracket with 22.7% of them unmarried.
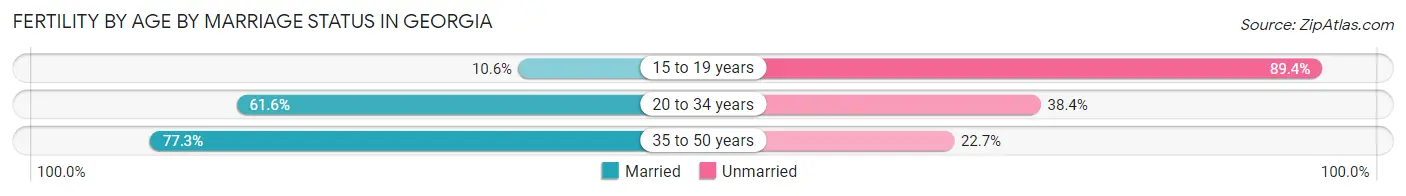
| Age Bracket | Married | Unmarried |
| 15 to 19 years | 500 (10.6%) | 4,214 (89.4%) |
| 20 to 34 years | 58,468 (61.6%) | 36,448 (38.4%) |
| 35 to 50 years | 26,687 (77.3%) | 7,837 (22.7%) |
| Total | 85,724 (63.9%) | 48,430 (36.1%) |
Fertility by Education in Georgia
Average fertility rate in Georgia is 51.0 births per 1,000 women. Women with the education attainment of high school diploma have the highest fertility rate of 61.0 births per 1,000 women, while women with the education attainment of less than high school have the lowest fertility at 33.0 births per 1,000 women. Women with the education attainment of college or associate's degree represent 29.2% of all women with births.
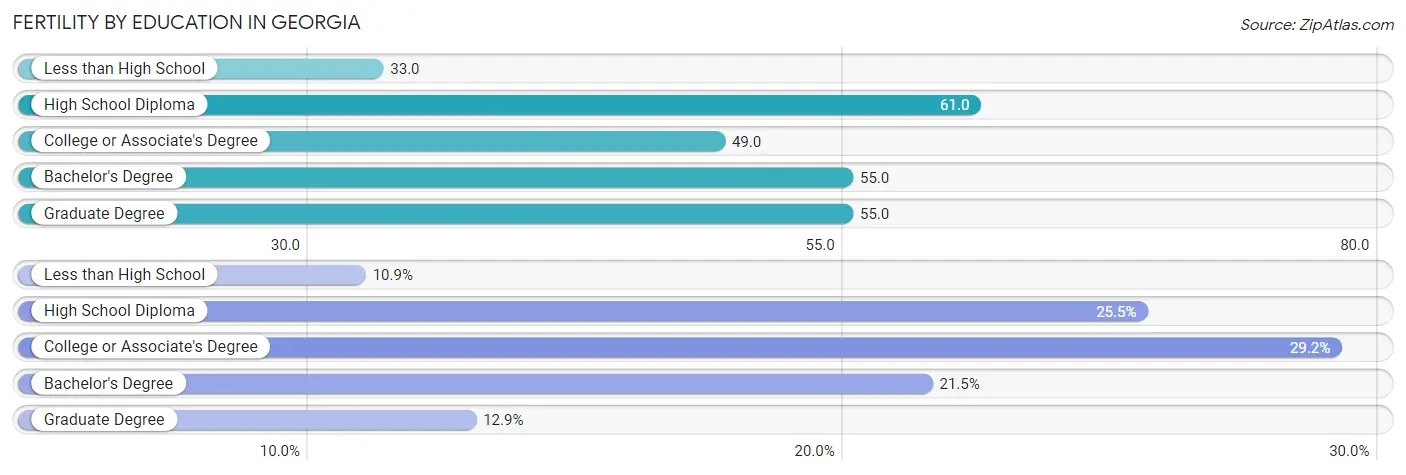
| Educational Attainment | Women with Births | Births / 1,000 Women |
| Less than High School | 14,580 (10.9%) | 33.0 |
| High School Diploma | 34,251 (25.5%) | 61.0 |
| College or Associate's Degree | 39,124 (29.2%) | 49.0 |
| Bachelor's Degree | 28,833 (21.5%) | 55.0 |
| Graduate Degree | 17,366 (12.9%) | 55.0 |
| Total | 134,154 (100.0%) | 51.0 |
Fertility by Education by Marriage Status in Georgia
36.1% of women with births in Georgia are unmarried. Women with the educational attainment of graduate degree are most likely to be married with 91.3% of them married at childbirth, while women with the educational attainment of less than high school are least likely to be married with 62.0% of them unmarried at childbirth.
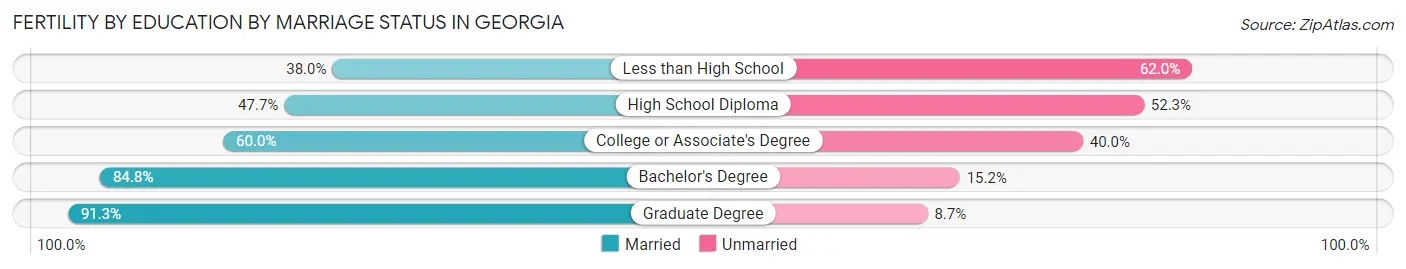
| Educational Attainment | Married | Unmarried |
| Less than High School | 5,540 (38.0%) | 9,040 (62.0%) |
| High School Diploma | 16,338 (47.7%) | 17,913 (52.3%) |
| College or Associate's Degree | 23,474 (60.0%) | 15,650 (40.0%) |
| Bachelor's Degree | 24,450 (84.8%) | 4,383 (15.2%) |
| Graduate Degree | 15,855 (91.3%) | 1,511 (8.7%) |
| Total | 85,724 (63.9%) | 48,430 (36.1%) |
Employment Characteristics in Georgia
Employment by Class of Employer in Georgia
Among the 5,010,799 employed individuals in Georgia, private company employees (3,441,269 | 68.7%), local government employees (349,886 | 7.0%), and not-for-profit organizations (313,929 | 6.3%) make up the most common classes of employment.
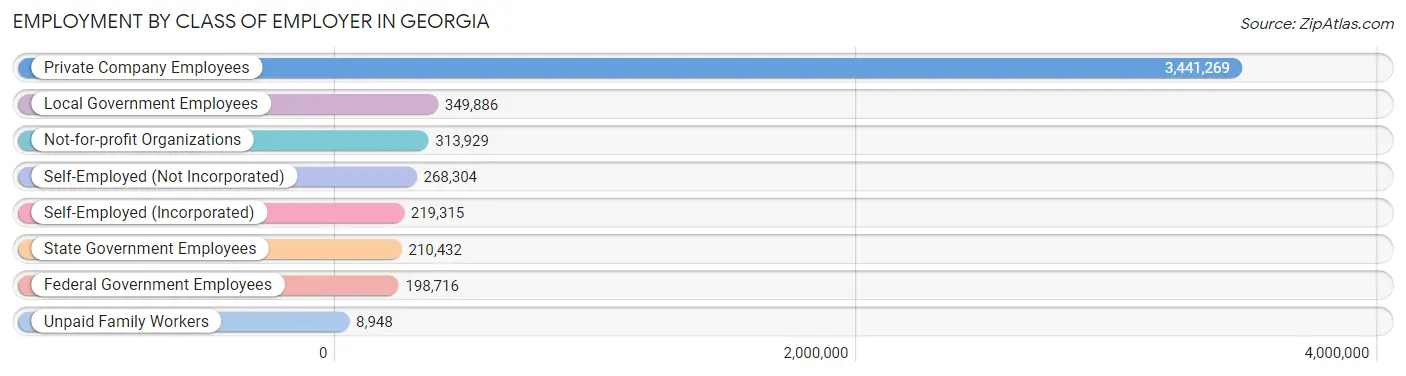
| Employer Class | # Employees | % Employees |
| Private Company Employees | 3,441,269 | 68.7% |
| Self-Employed (Incorporated) | 219,315 | 4.4% |
| Self-Employed (Not Incorporated) | 268,304 | 5.3% |
| Not-for-profit Organizations | 313,929 | 6.3% |
| Local Government Employees | 349,886 | 7.0% |
| State Government Employees | 210,432 | 4.2% |
| Federal Government Employees | 198,716 | 4.0% |
| Unpaid Family Workers | 8,948 | 0.2% |
| Total | 5,010,799 | 100.0% |
Employment Status by Age in Georgia
According to the labor force statistics for Georgia, out of the total population over 16 years of age (8,504,181), 63.6% or 5,408,659 individuals are in the labor force, with 5.2% or 281,250 of them unemployed. The age group with the highest labor force participation rate is 25 to 29 years, with 82.9% or 615,827 individuals in the labor force. Within the labor force, the 16 to 19 years age range has the highest percentage of unemployed individuals, with 15.3% or 33,461 of them being unemployed.
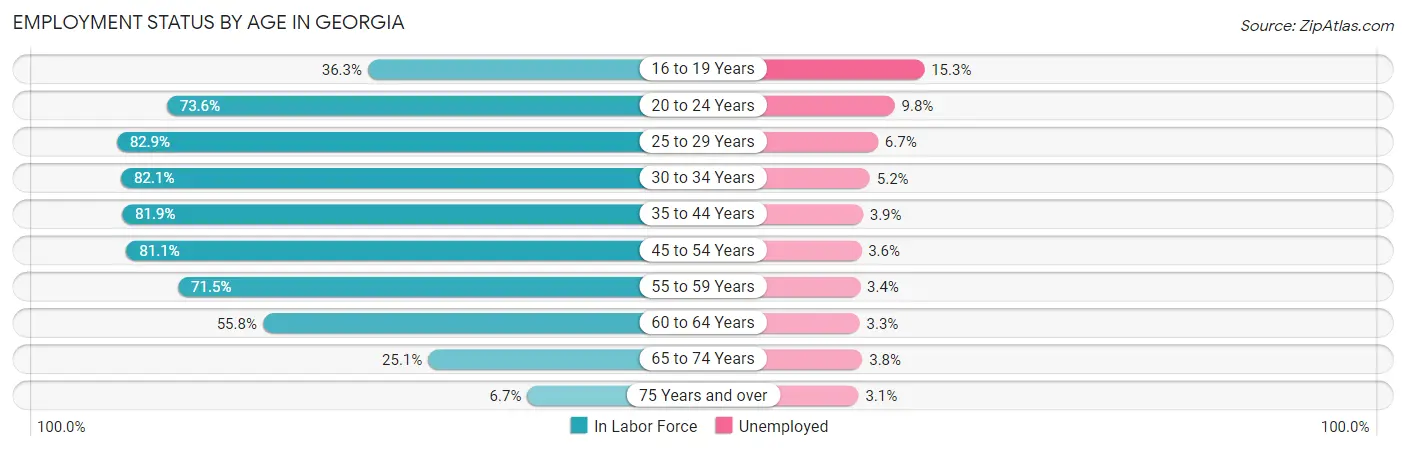
| Age Bracket | In Labor Force | Unemployed |
| 16 to 19 Years | 218,700 (36.3%) | 33,461 (15.3%) |
| 20 to 24 Years | 546,908 (73.6%) | 53,597 (9.8%) |
| 25 to 29 Years | 615,827 (82.9%) | 41,260 (6.7%) |
| 30 to 34 Years | 601,203 (82.1%) | 31,263 (5.2%) |
| 35 to 44 Years | 1,163,142 (81.9%) | 45,363 (3.9%) |
| 45 to 54 Years | 1,136,535 (81.1%) | 40,915 (3.6%) |
| 55 to 59 Years | 493,202 (71.5%) | 16,769 (3.4%) |
| 60 to 64 Years | 352,460 (55.8%) | 11,631 (3.3%) |
| 65 to 74 Years | 237,753 (25.1%) | 9,035 (3.8%) |
| 75 Years and over | 39,746 (6.7%) | 1,232 (3.1%) |
| Total | 5,408,659 (63.6%) | 281,250 (5.2%) |
Employment Status by Educational Attainment in Georgia
According to labor force statistics for Georgia, 77.7% of individuals (4,365,322) out of the total population between 25 and 64 years of age (5,618,175) are in the labor force, with 4.3% or 187,709 of them being unemployed. The group with the highest labor force participation rate are those with the educational attainment of bachelor's degree or higher, with 87.2% or 1,721,415 individuals in the labor force. Within the labor force, individuals with less than high school education have the highest percentage of unemployment, with 6.9% or 23,503 of them being unemployed.
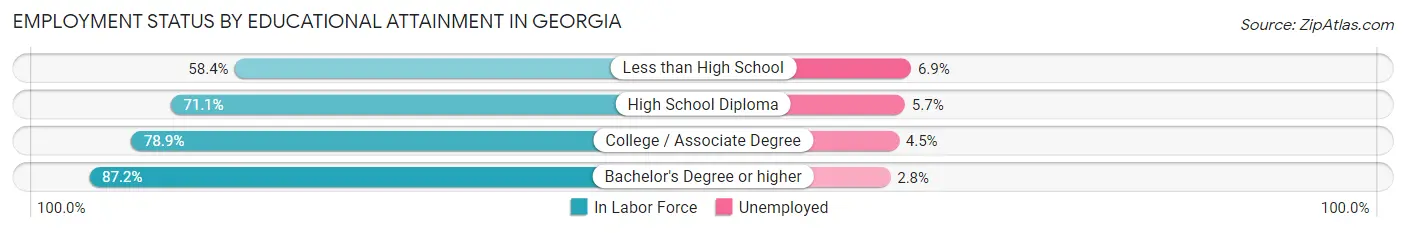
| Educational Attainment | In Labor Force | Unemployed |
| Less than High School | 340,616 (58.4%) | 40,244 (6.9%) |
| High School Diploma | 1,039,553 (71.1%) | 83,340 (5.7%) |
| College / Associate Degree | 1,261,396 (78.9%) | 71,943 (4.5%) |
| Bachelor's Degree or higher | 1,721,415 (87.2%) | 55,275 (2.8%) |
| Total | 4,365,322 (77.7%) | 241,582 (4.3%) |
Employment Occupations by Sex in Georgia
Management, Business, Science and Arts Occupations
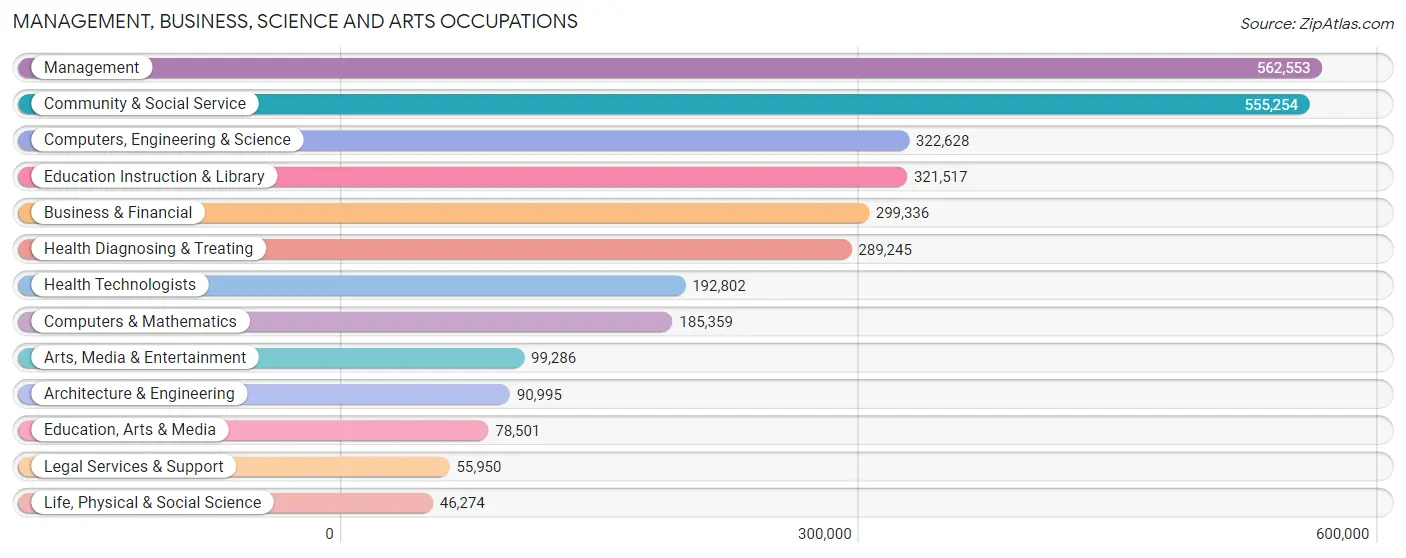
The most common Management, Business, Science and Arts occupations in Georgia are Management (562,553 | 11.1%), Community & Social Service (555,254 | 11.0%), Computers, Engineering & Science (322,628 | 6.4%), Education Instruction & Library (321,517 | 6.3%), and Business & Financial (299,336 | 5.9%).
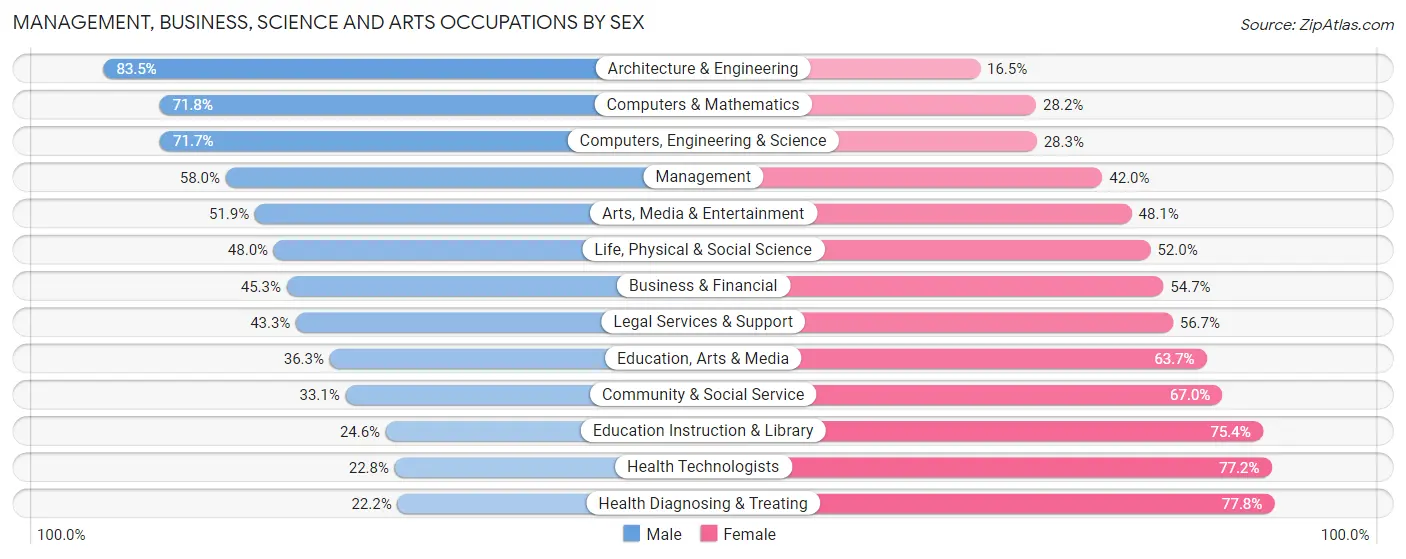
Management, Business, Science and Arts Occupations by Sex
Within the Management, Business, Science and Arts occupations in Georgia, the most male-oriented occupations are Architecture & Engineering (83.5%), Computers & Mathematics (71.8%), and Computers, Engineering & Science (71.7%), while the most female-oriented occupations are Health Diagnosing & Treating (77.8%), Health Technologists (77.2%), and Education Instruction & Library (75.4%).
| Occupation | Male | Female |
| Management | 326,441 (58.0%) | 236,112 (42.0%) |
| Business & Financial | 135,605 (45.3%) | 163,731 (54.7%) |
| Computers, Engineering & Science | 231,386 (71.7%) | 91,242 (28.3%) |
| Computers & Mathematics | 133,158 (71.8%) | 52,201 (28.2%) |
| Architecture & Engineering | 76,019 (83.5%) | 14,976 (16.5%) |
| Life, Physical & Social Science | 22,209 (48.0%) | 24,065 (52.0%) |
| Community & Social Service | 183,484 (33.1%) | 371,770 (66.9%) |
| Education, Arts & Media | 28,518 (36.3%) | 49,983 (63.7%) |
| Legal Services & Support | 24,249 (43.3%) | 31,701 (56.7%) |
| Education Instruction & Library | 79,159 (24.6%) | 242,358 (75.4%) |
| Arts, Media & Entertainment | 51,558 (51.9%) | 47,728 (48.1%) |
| Health Diagnosing & Treating | 64,241 (22.2%) | 225,004 (77.8%) |
| Health Technologists | 43,918 (22.8%) | 148,884 (77.2%) |
| Total (Category) | 941,157 (46.4%) | 1,087,859 (53.6%) |
| Total (Overall) | 2,627,891 (51.8%) | 2,441,527 (48.2%) |
Services Occupations
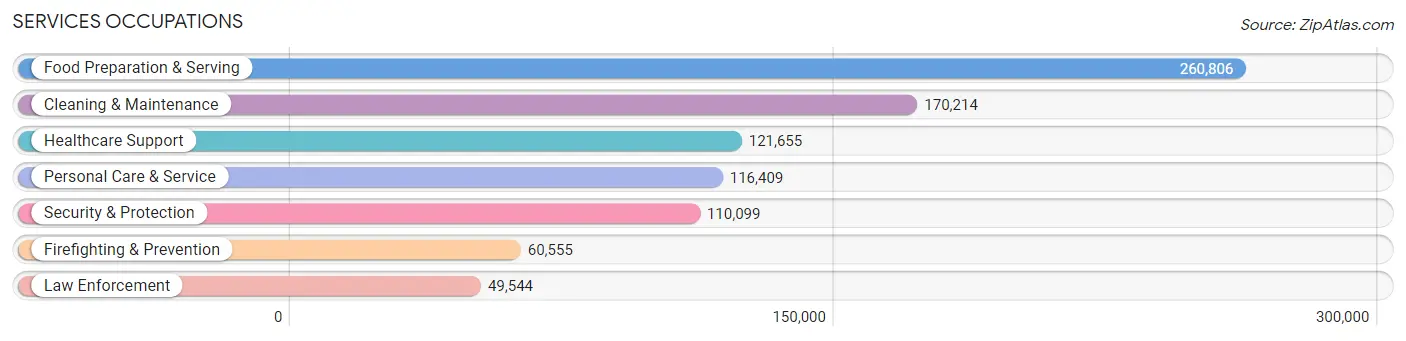
The most common Services occupations in Georgia are Food Preparation & Serving (260,806 | 5.1%), Cleaning & Maintenance (170,214 | 3.4%), Healthcare Support (121,655 | 2.4%), Personal Care & Service (116,409 | 2.3%), and Security & Protection (110,099 | 2.2%).
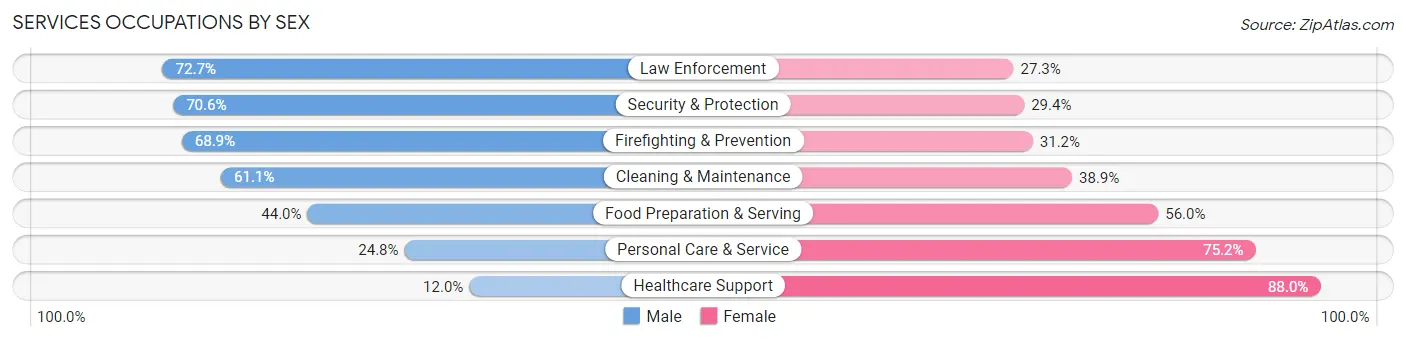
Services Occupations by Sex
Within the Services occupations in Georgia, the most male-oriented occupations are Law Enforcement (72.7%), Security & Protection (70.6%), and Firefighting & Prevention (68.9%), while the most female-oriented occupations are Healthcare Support (88.0%), Personal Care & Service (75.2%), and Food Preparation & Serving (56.0%).
| Occupation | Male | Female |
| Healthcare Support | 14,568 (12.0%) | 107,087 (88.0%) |
| Security & Protection | 77,690 (70.6%) | 32,409 (29.4%) |
| Firefighting & Prevention | 41,691 (68.9%) | 18,864 (31.1%) |
| Law Enforcement | 35,999 (72.7%) | 13,545 (27.3%) |
| Food Preparation & Serving | 114,775 (44.0%) | 146,031 (56.0%) |
| Cleaning & Maintenance | 103,960 (61.1%) | 66,254 (38.9%) |
| Personal Care & Service | 28,869 (24.8%) | 87,540 (75.2%) |
| Total (Category) | 339,862 (43.6%) | 439,321 (56.4%) |
| Total (Overall) | 2,627,891 (51.8%) | 2,441,527 (48.2%) |
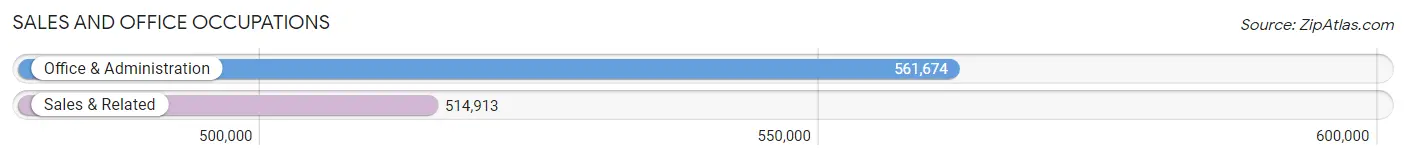
Sales and Office Occupations
The most common Sales and Office occupations in Georgia are Office & Administration (561,674 | 11.1%), and Sales & Related (514,913 | 10.2%).
Sales and Office Occupations by Sex
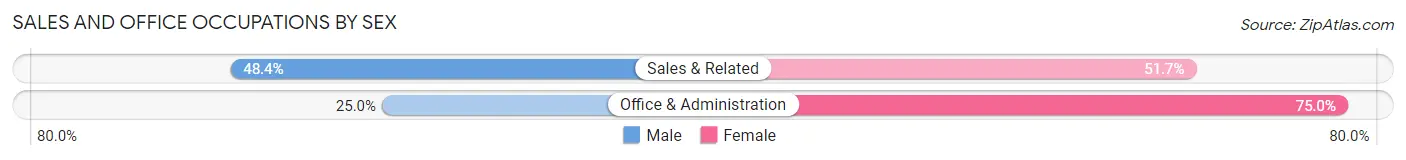
| Occupation | Male | Female |
| Sales & Related | 248,940 (48.3%) | 265,973 (51.6%) |
| Office & Administration | 140,616 (25.0%) | 421,058 (75.0%) |
| Total (Category) | 389,556 (36.2%) | 687,031 (63.8%) |
| Total (Overall) | 2,627,891 (51.8%) | 2,441,527 (48.2%) |
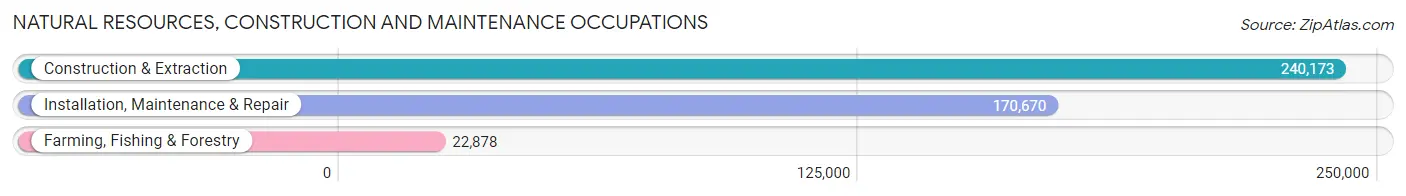
Natural Resources, Construction and Maintenance Occupations
The most common Natural Resources, Construction and Maintenance occupations in Georgia are Construction & Extraction (240,173 | 4.7%), Installation, Maintenance & Repair (170,670 | 3.4%), and Farming, Fishing & Forestry (22,878 | 0.4%).
Natural Resources, Construction and Maintenance Occupations by Sex
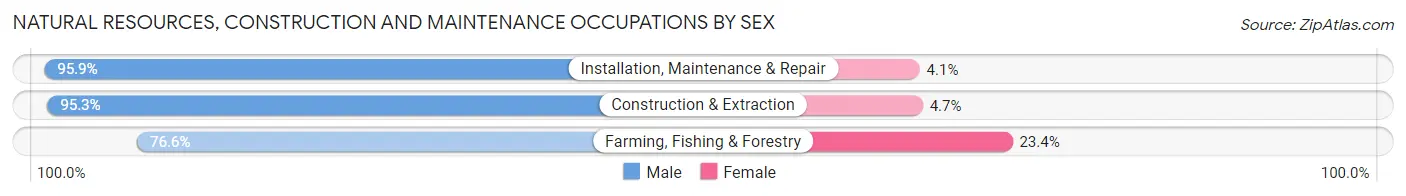
| Occupation | Male | Female |
| Farming, Fishing & Forestry | 17,521 (76.6%) | 5,357 (23.4%) |
| Construction & Extraction | 228,784 (95.3%) | 11,389 (4.7%) |
| Installation, Maintenance & Repair | 163,657 (95.9%) | 7,013 (4.1%) |
| Total (Category) | 409,962 (94.5%) | 23,759 (5.5%) |
| Total (Overall) | 2,627,891 (51.8%) | 2,441,527 (48.2%) |
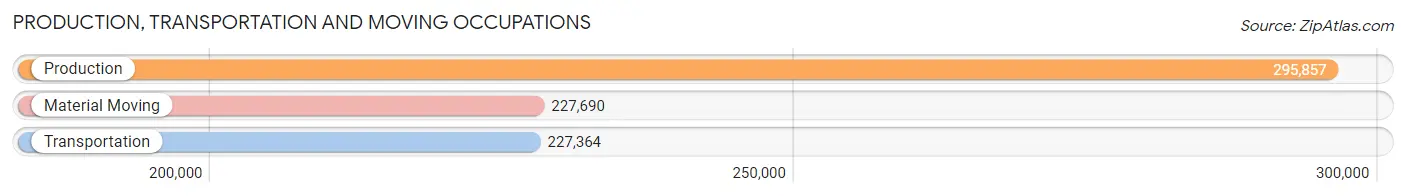
Production, Transportation and Moving Occupations
The most common Production, Transportation and Moving occupations in Georgia are Production (295,857 | 5.8%), Material Moving (227,690 | 4.5%), and Transportation (227,364 | 4.5%).
Production, Transportation and Moving Occupations by Sex
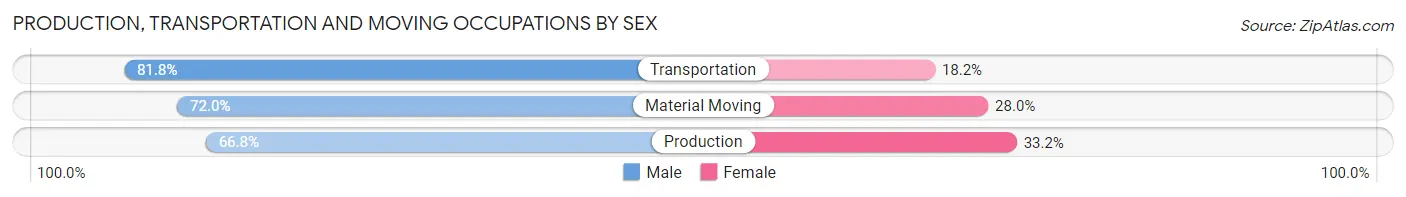
| Occupation | Male | Female |
| Production | 197,522 (66.8%) | 98,335 (33.2%) |
| Transportation | 185,893 (81.8%) | 41,471 (18.2%) |
| Material Moving | 163,939 (72.0%) | 63,751 (28.0%) |
| Total (Category) | 547,354 (72.9%) | 203,557 (27.1%) |
| Total (Overall) | 2,627,891 (51.8%) | 2,441,527 (48.2%) |
Employment Industries by Sex in Georgia
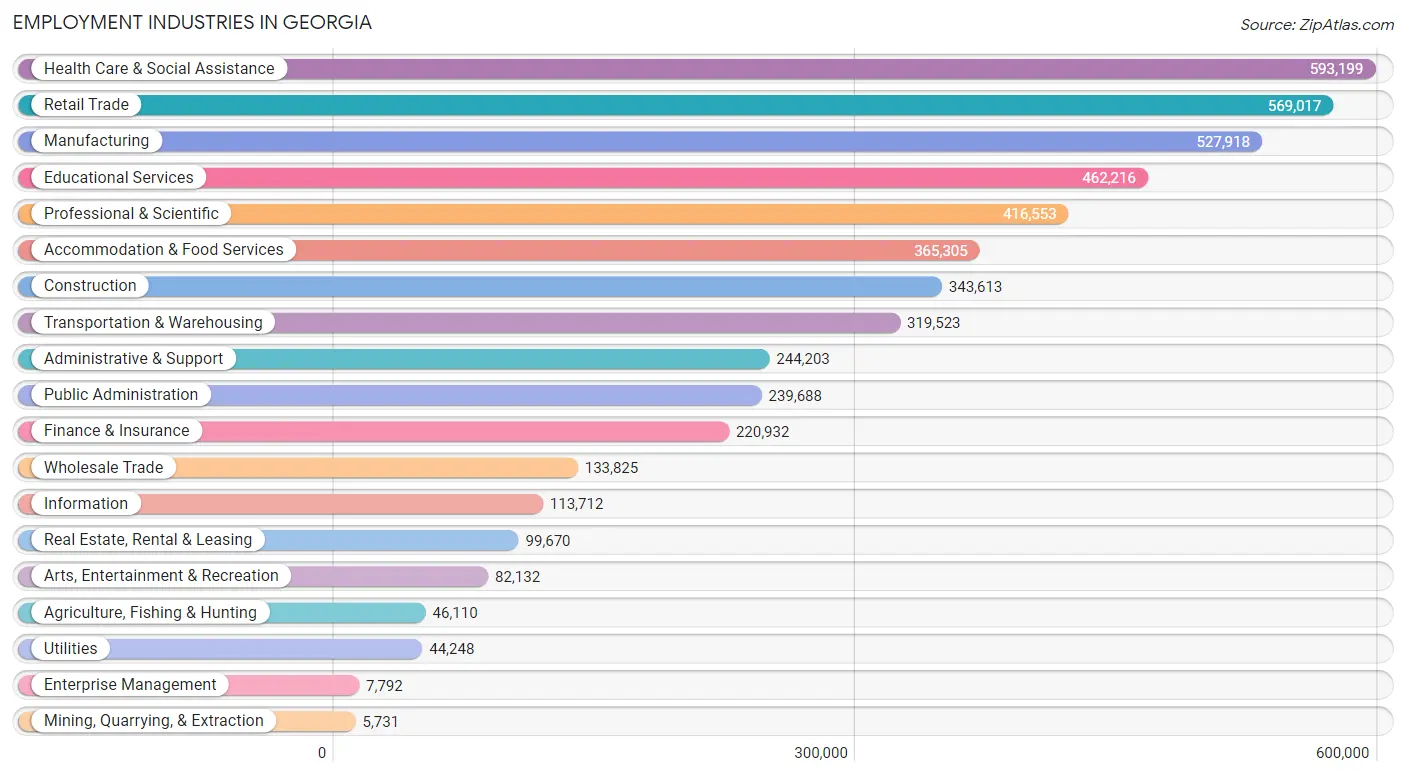
Employment Industries in Georgia
The major employment industries in Georgia include Health Care & Social Assistance (593,199 | 11.7%), Retail Trade (569,017 | 11.2%), Manufacturing (527,918 | 10.4%), Educational Services (462,216 | 9.1%), and Professional & Scientific (416,553 | 8.2%).
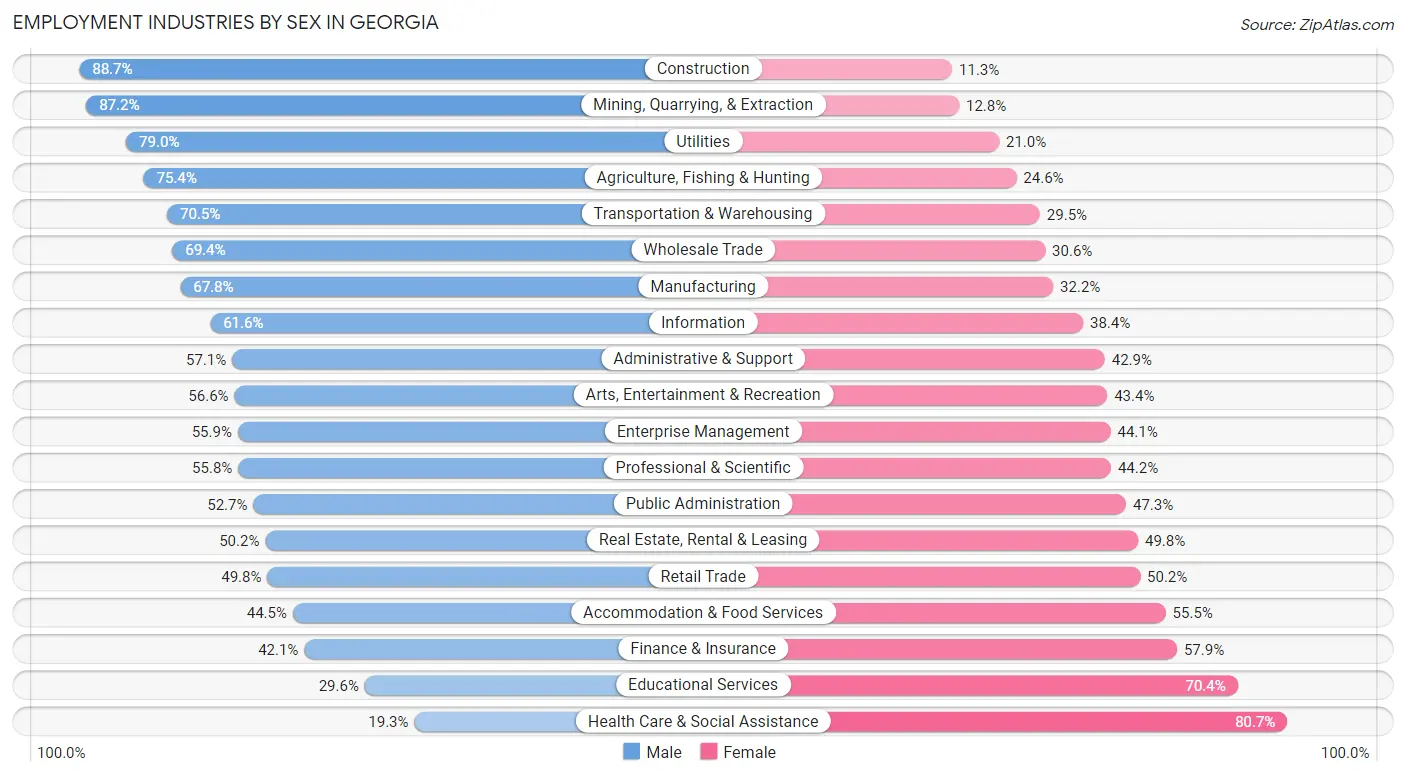
Employment Industries by Sex in Georgia
The Georgia industries that see more men than women are Construction (88.7%), Mining, Quarrying, & Extraction (87.2%), and Utilities (79.0%), whereas the industries that tend to have a higher number of women are Health Care & Social Assistance (80.7%), Educational Services (70.4%), and Finance & Insurance (57.9%).
| Industry | Male | Female |
| Agriculture, Fishing & Hunting | 34,753 (75.4%) | 11,357 (24.6%) |
| Mining, Quarrying, & Extraction | 5,000 (87.2%) | 731 (12.8%) |
| Construction | 304,729 (88.7%) | 38,884 (11.3%) |
| Manufacturing | 357,712 (67.8%) | 170,206 (32.2%) |
| Wholesale Trade | 92,906 (69.4%) | 40,919 (30.6%) |
| Retail Trade | 283,203 (49.8%) | 285,814 (50.2%) |
| Transportation & Warehousing | 225,300 (70.5%) | 94,223 (29.5%) |
| Utilities | 34,943 (79.0%) | 9,305 (21.0%) |
| Information | 70,028 (61.6%) | 43,684 (38.4%) |
| Finance & Insurance | 93,073 (42.1%) | 127,859 (57.9%) |
| Real Estate, Rental & Leasing | 50,026 (50.2%) | 49,644 (49.8%) |
| Professional & Scientific | 232,454 (55.8%) | 184,099 (44.2%) |
| Enterprise Management | 4,355 (55.9%) | 3,437 (44.1%) |
| Administrative & Support | 139,378 (57.1%) | 104,825 (42.9%) |
| Educational Services | 136,823 (29.6%) | 325,393 (70.4%) |
| Health Care & Social Assistance | 114,694 (19.3%) | 478,505 (80.7%) |
| Arts, Entertainment & Recreation | 46,458 (56.6%) | 35,674 (43.4%) |
| Accommodation & Food Services | 162,491 (44.5%) | 202,814 (55.5%) |
| Public Administration | 126,249 (52.7%) | 113,439 (47.3%) |
| Total | 2,627,891 (51.8%) | 2,441,527 (48.2%) |
Education in Georgia
School Enrollment in Georgia
The most common levels of schooling among the 2,757,087 students in Georgia are high school (607,277 | 22.0%), middle school (587,566 | 21.3%), and college / undergraduate (561,296 | 20.4%).
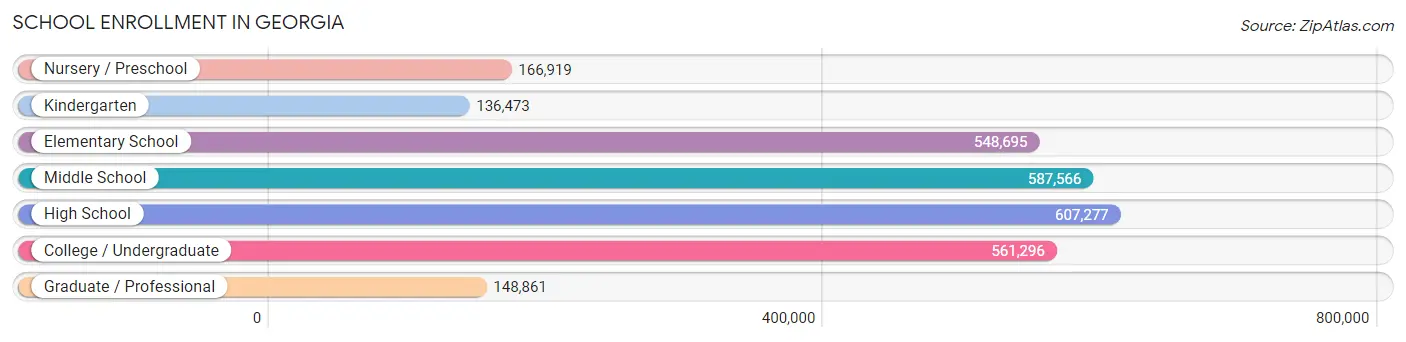
| School Level | # Students | % Students |
| Nursery / Preschool | 166,919 | 6.0% |
| Kindergarten | 136,473 | 5.0% |
| Elementary School | 548,695 | 19.9% |
| Middle School | 587,566 | 21.3% |
| High School | 607,277 | 22.0% |
| College / Undergraduate | 561,296 | 20.4% |
| Graduate / Professional | 148,861 | 5.4% |
| Total | 2,757,087 | 100.0% |
School Enrollment by Age by Funding Source in Georgia
Out of a total of 2,757,087 students who are enrolled in schools in Georgia, 427,348 (15.5%) attend a private institution, while the remaining 2,329,739 (84.5%) are enrolled in public schools. The age group of 3 to 4 year olds has the highest likelihood of being enrolled in private schools, with 50,209 (38.6% in the age bracket) enrolled. Conversely, the age group of 15 to 17 year olds has the lowest likelihood of being enrolled in a private school, with 384,999 (89.1% in the age bracket) attending a public institution.
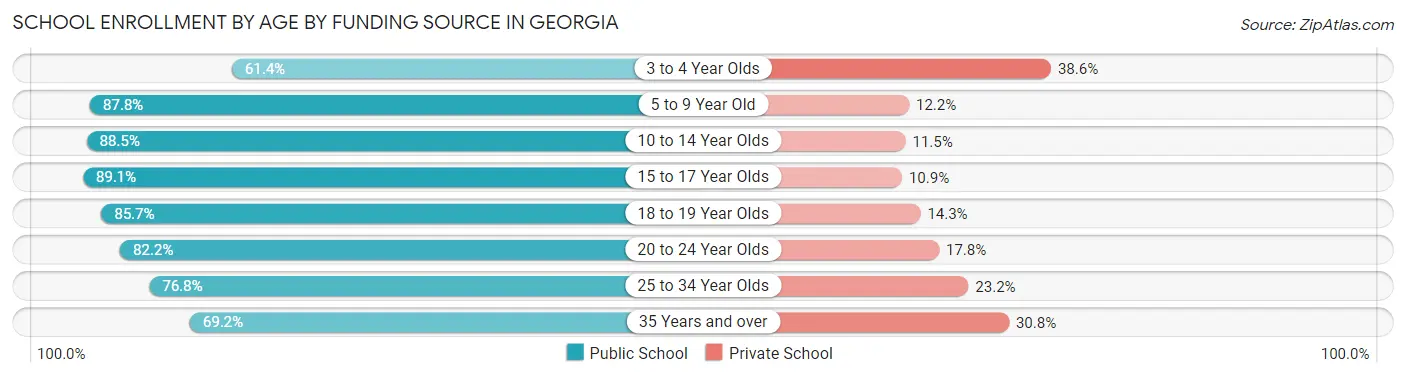
| Age Bracket | Public School | Private School |
| 3 to 4 Year Olds | 79,812 (61.4%) | 50,209 (38.6%) |
| 5 to 9 Year Old | 566,822 (87.8%) | 78,561 (12.2%) |
| 10 to 14 Year Olds | 646,721 (88.5%) | 84,320 (11.5%) |
| 15 to 17 Year Olds | 384,999 (89.1%) | 46,901 (10.9%) |
| 18 to 19 Year Olds | 186,809 (85.7%) | 31,168 (14.3%) |
| 20 to 24 Year Olds | 236,815 (82.2%) | 51,175 (17.8%) |
| 25 to 34 Year Olds | 124,804 (76.8%) | 37,769 (23.2%) |
| 35 Years and over | 103,956 (69.2%) | 46,246 (30.8%) |
| Total | 2,329,739 (84.5%) | 427,348 (15.5%) |
Educational Attainment by Field of Study in Georgia
Business (592,002 | 23.1%), education (296,352 | 11.5%), science & technology (243,982 | 9.5%), engineering (181,943 | 7.1%), and social sciences (181,152 | 7.1%) are the most common fields of study among 2,567,275 individuals in Georgia who have obtained a bachelor's degree or higher.
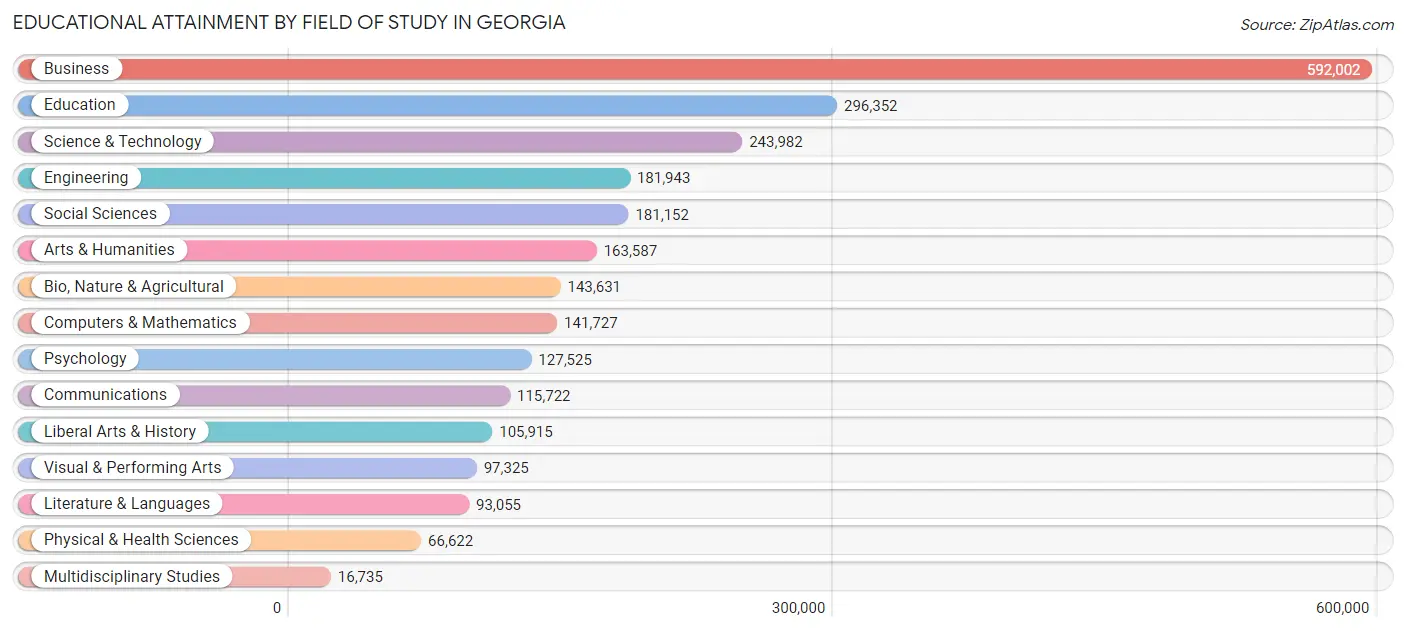
| Field of Study | # Graduates | % Graduates |
| Computers & Mathematics | 141,727 | 5.5% |
| Bio, Nature & Agricultural | 143,631 | 5.6% |
| Physical & Health Sciences | 66,622 | 2.6% |
| Psychology | 127,525 | 5.0% |
| Social Sciences | 181,152 | 7.1% |
| Engineering | 181,943 | 7.1% |
| Multidisciplinary Studies | 16,735 | 0.6% |
| Science & Technology | 243,982 | 9.5% |
| Business | 592,002 | 23.1% |
| Education | 296,352 | 11.5% |
| Literature & Languages | 93,055 | 3.6% |
| Liberal Arts & History | 105,915 | 4.1% |
| Visual & Performing Arts | 97,325 | 3.8% |
| Communications | 115,722 | 4.5% |
| Arts & Humanities | 163,587 | 6.4% |
| Total | 2,567,275 | 100.0% |
Transportation & Commute in Georgia
Vehicle Availability by Sex in Georgia
The most prevalent vehicle ownership categories in Georgia are males with 2 vehicles (1,081,063, accounting for 41.6%) and females with 2 vehicles (936,167, making up 45.6%).
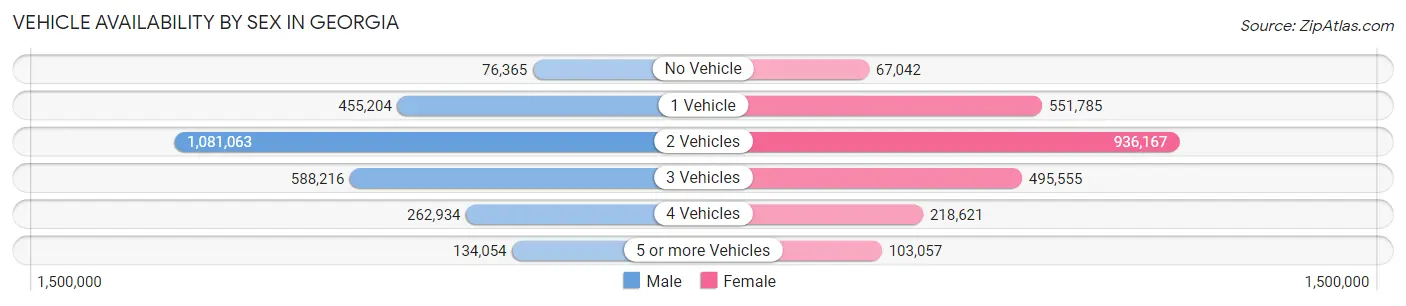
| Vehicles Available | Male | Female |
| No Vehicle | 76,365 (2.9%) | 67,042 (2.8%) |
| 1 Vehicle | 455,204 (17.5%) | 551,785 (23.3%) |
| 2 Vehicles | 1,081,063 (41.6%) | 936,167 (39.5%) |
| 3 Vehicles | 588,216 (22.6%) | 495,555 (20.9%) |
| 4 Vehicles | 262,934 (10.1%) | 218,621 (9.2%) |
| 5 or more Vehicles | 134,054 (5.2%) | 103,057 (4.3%) |
| Total | 2,597,836 (100.0%) | 2,372,227 (100.0%) |
Commute Time in Georgia
The most frequently occuring commute durations in Georgia are 15 to 19 minutes (658,062 commuters, 15.0%), 30 to 34 minutes (631,073 commuters, 14.3%), and 20 to 24 minutes (616,739 commuters, 14.0%).
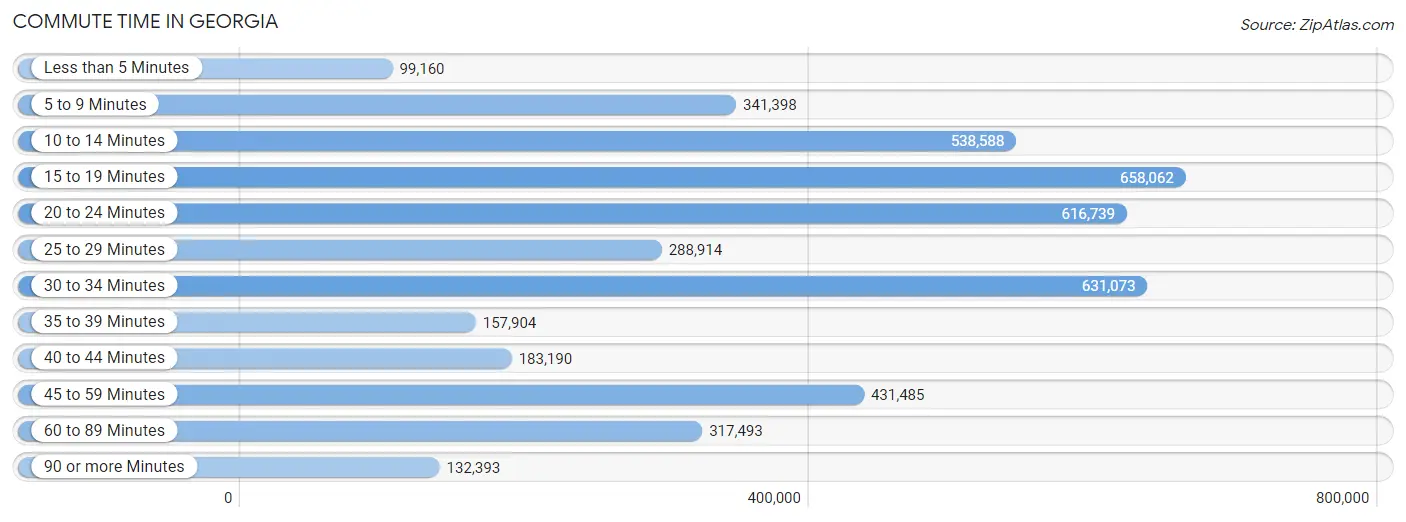
| Commute Time | # Commuters | % Commuters |
| Less than 5 Minutes | 99,160 | 2.3% |
| 5 to 9 Minutes | 341,398 | 7.8% |
| 10 to 14 Minutes | 538,588 | 12.2% |
| 15 to 19 Minutes | 658,062 | 15.0% |
| 20 to 24 Minutes | 616,739 | 14.0% |
| 25 to 29 Minutes | 288,914 | 6.6% |
| 30 to 34 Minutes | 631,073 | 14.3% |
| 35 to 39 Minutes | 157,904 | 3.6% |
| 40 to 44 Minutes | 183,190 | 4.2% |
| 45 to 59 Minutes | 431,485 | 9.8% |
| 60 to 89 Minutes | 317,493 | 7.2% |
| 90 or more Minutes | 132,393 | 3.0% |
Commute Time by Sex in Georgia
The most common commute times in Georgia are 30 to 34 minutes (347,778 commuters, 15.0%) for males and 15 to 19 minutes (327,749 commuters, 15.8%) for females.
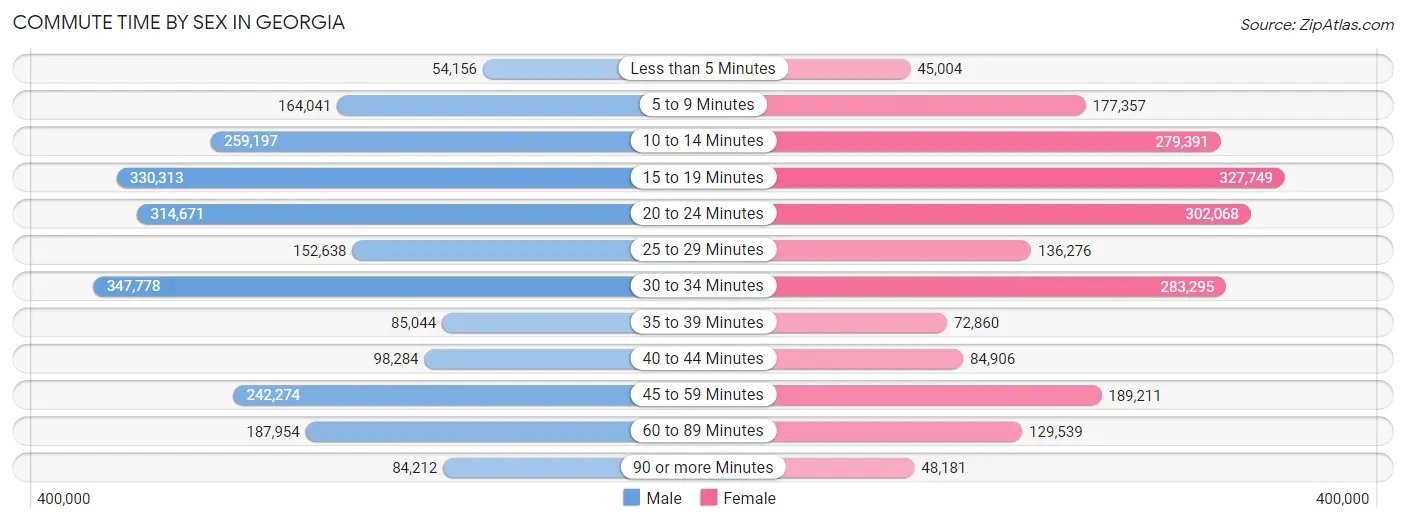
| Commute Time | Male | Female |
| Less than 5 Minutes | 54,156 (2.3%) | 45,004 (2.2%) |
| 5 to 9 Minutes | 164,041 (7.1%) | 177,357 (8.5%) |
| 10 to 14 Minutes | 259,197 (11.2%) | 279,391 (13.5%) |
| 15 to 19 Minutes | 330,313 (14.2%) | 327,749 (15.8%) |
| 20 to 24 Minutes | 314,671 (13.6%) | 302,068 (14.5%) |
| 25 to 29 Minutes | 152,638 (6.6%) | 136,276 (6.6%) |
| 30 to 34 Minutes | 347,778 (15.0%) | 283,295 (13.7%) |
| 35 to 39 Minutes | 85,044 (3.7%) | 72,860 (3.5%) |
| 40 to 44 Minutes | 98,284 (4.2%) | 84,906 (4.1%) |
| 45 to 59 Minutes | 242,274 (10.4%) | 189,211 (9.1%) |
| 60 to 89 Minutes | 187,954 (8.1%) | 129,539 (6.2%) |
| 90 or more Minutes | 84,212 (3.6%) | 48,181 (2.3%) |
Time of Departure to Work by Sex in Georgia
The most frequent times of departure to work in Georgia are 7:00 AM to 7:29 AM (340,155, 14.7%) for males and 7:00 AM to 7:29 AM (326,086, 15.7%) for females.
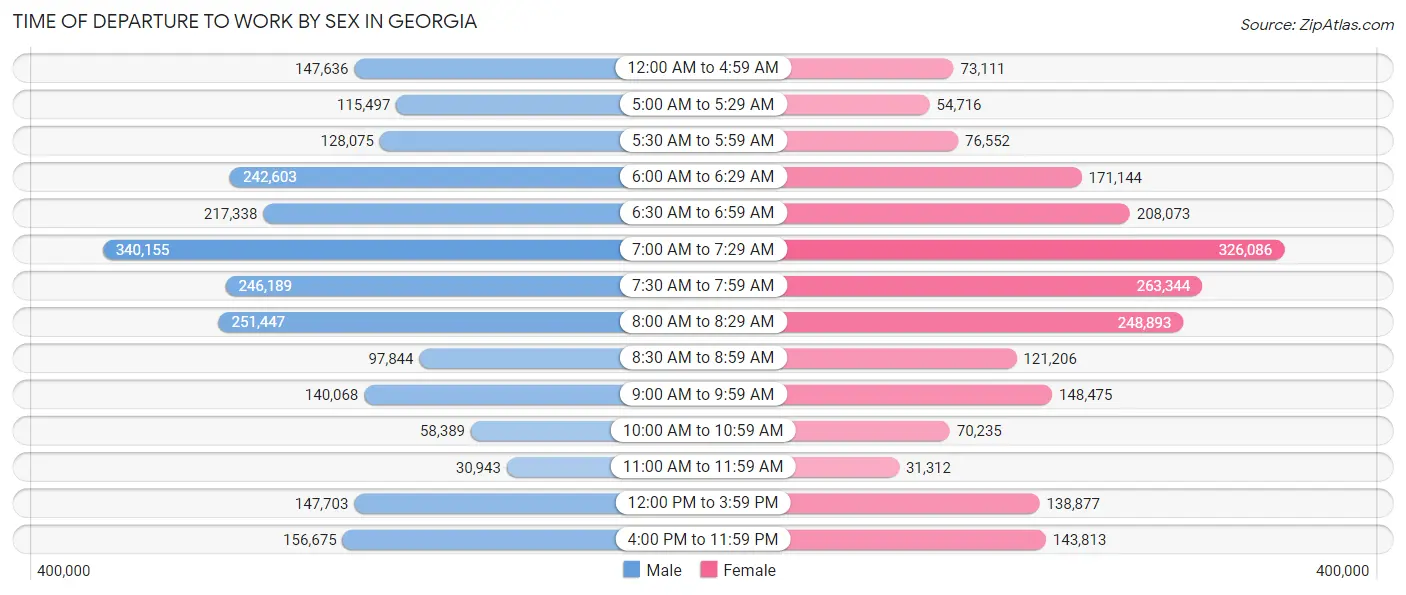
| Time of Departure | Male | Female |
| 12:00 AM to 4:59 AM | 147,636 (6.4%) | 73,111 (3.5%) |
| 5:00 AM to 5:29 AM | 115,497 (5.0%) | 54,716 (2.6%) |
| 5:30 AM to 5:59 AM | 128,075 (5.5%) | 76,552 (3.7%) |
| 6:00 AM to 6:29 AM | 242,603 (10.4%) | 171,144 (8.2%) |
| 6:30 AM to 6:59 AM | 217,338 (9.4%) | 208,073 (10.0%) |
| 7:00 AM to 7:29 AM | 340,155 (14.7%) | 326,086 (15.7%) |
| 7:30 AM to 7:59 AM | 246,189 (10.6%) | 263,344 (12.7%) |
| 8:00 AM to 8:29 AM | 251,447 (10.8%) | 248,893 (12.0%) |
| 8:30 AM to 8:59 AM | 97,844 (4.2%) | 121,206 (5.8%) |
| 9:00 AM to 9:59 AM | 140,068 (6.0%) | 148,475 (7.1%) |
| 10:00 AM to 10:59 AM | 58,389 (2.5%) | 70,235 (3.4%) |
| 11:00 AM to 11:59 AM | 30,943 (1.3%) | 31,312 (1.5%) |
| 12:00 PM to 3:59 PM | 147,703 (6.4%) | 138,877 (6.7%) |
| 4:00 PM to 11:59 PM | 156,675 (6.8%) | 143,813 (6.9%) |
| Total | 2,320,562 (100.0%) | 2,075,837 (100.0%) |
Housing Occupancy in Georgia
Occupancy by Ownership in Georgia
Of the total 3,946,490 dwellings in Georgia, owner-occupied units account for 2,565,877 (65.0%), while renter-occupied units make up 1,380,613 (35.0%).
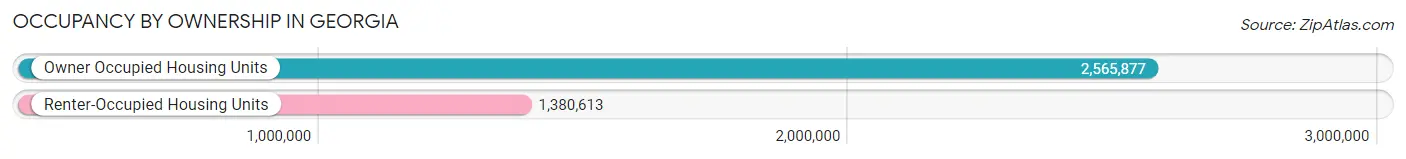
| Occupancy | # Housing Units | % Housing Units |
| Owner Occupied Housing Units | 2,565,877 | 65.0% |
| Renter-Occupied Housing Units | 1,380,613 | 35.0% |
| Total Occupied Housing Units | 3,946,490 | 100.0% |
Occupancy by Household Size in Georgia
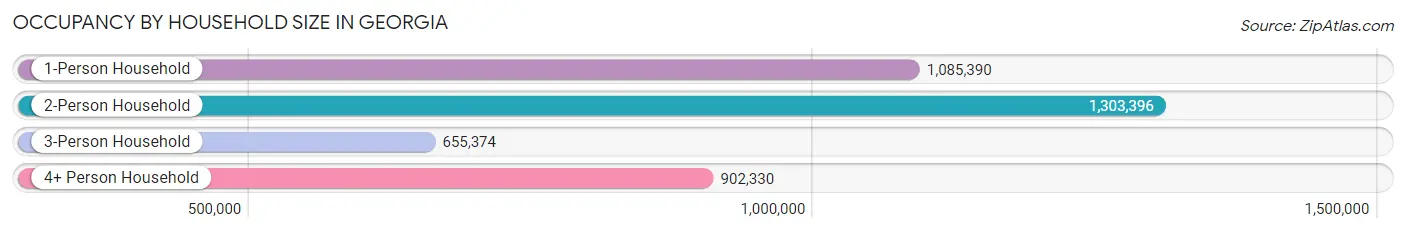
| Household Size | # Housing Units | % Housing Units |
| 1-Person Household | 1,085,390 | 27.5% |
| 2-Person Household | 1,303,396 | 33.0% |
| 3-Person Household | 655,374 | 16.6% |
| 4+ Person Household | 902,330 | 22.9% |
| Total Housing Units | 3,946,490 | 100.0% |
Occupancy by Ownership by Household Size in Georgia
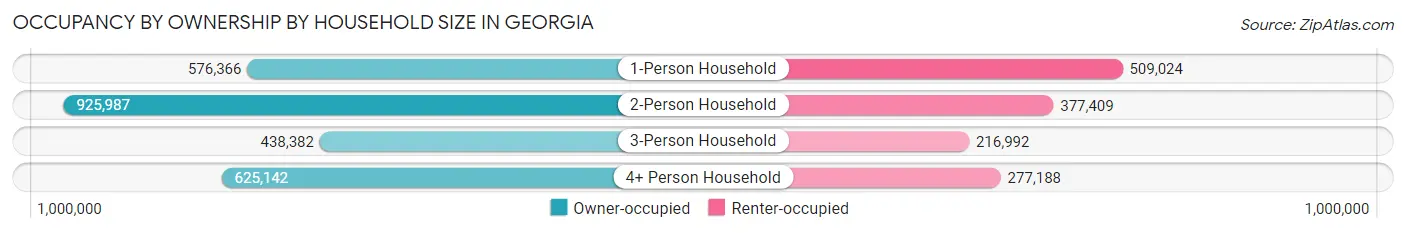
| Household Size | Owner-occupied | Renter-occupied |
| 1-Person Household | 576,366 (53.1%) | 509,024 (46.9%) |
| 2-Person Household | 925,987 (71.0%) | 377,409 (29.0%) |
| 3-Person Household | 438,382 (66.9%) | 216,992 (33.1%) |
| 4+ Person Household | 625,142 (69.3%) | 277,188 (30.7%) |
| Total Housing Units | 2,565,877 (65.0%) | 1,380,613 (35.0%) |
Occupancy by Educational Attainment in Georgia
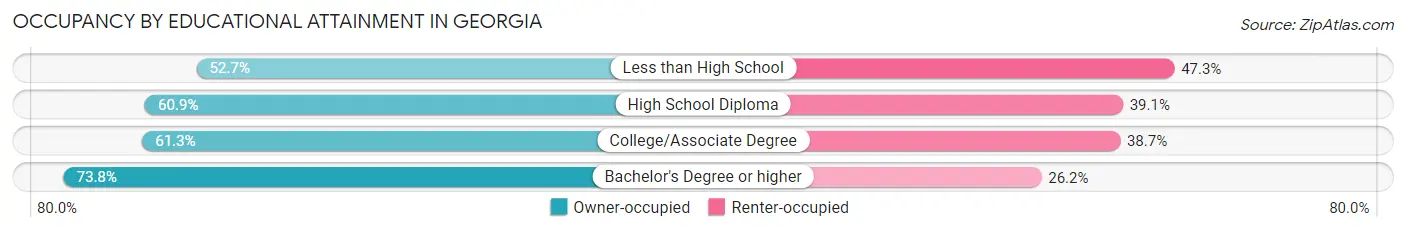
| Household Size | Owner-occupied | Renter-occupied |
| Less than High School | 195,465 (52.7%) | 175,195 (47.3%) |
| High School Diploma | 578,768 (60.9%) | 371,732 (39.1%) |
| College/Associate Degree | 717,847 (61.3%) | 452,657 (38.7%) |
| Bachelor's Degree or higher | 1,073,797 (73.8%) | 381,029 (26.2%) |
Occupancy by Age of Householder in Georgia
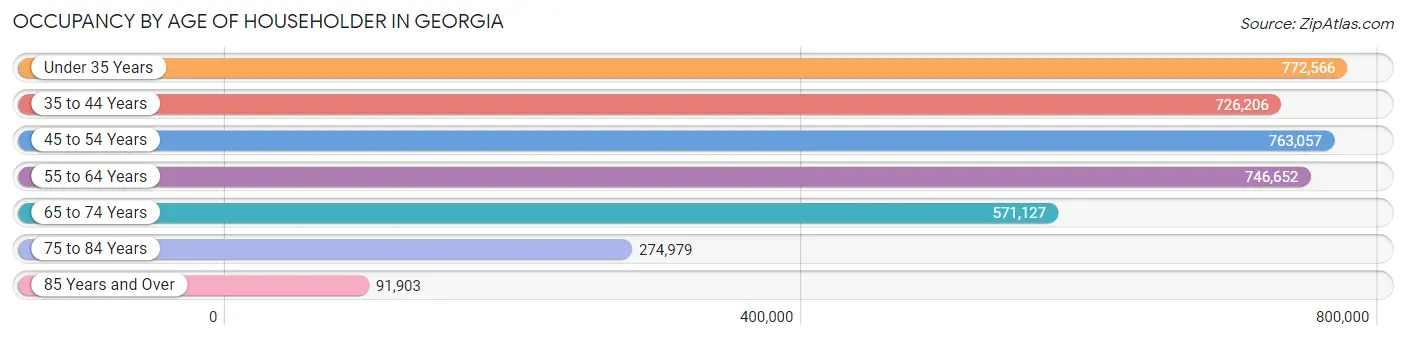
| Age Bracket | # Households | % Households |
| Under 35 Years | 772,566 | 19.6% |
| 35 to 44 Years | 726,206 | 18.4% |
| 45 to 54 Years | 763,057 | 19.3% |
| 55 to 64 Years | 746,652 | 18.9% |
| 65 to 74 Years | 571,127 | 14.5% |
| 75 to 84 Years | 274,979 | 7.0% |
| 85 Years and Over | 91,903 | 2.3% |
| Total | 3,946,490 | 100.0% |
Housing Finances in Georgia
Median Income by Occupancy in Georgia
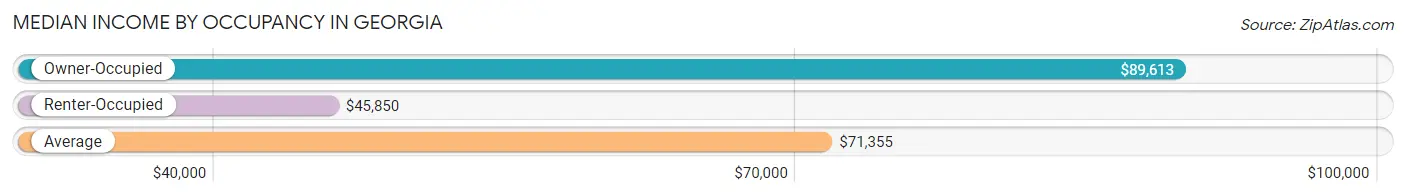
| Occupancy Type | # Households | Median Income |
| Owner-Occupied | 2,565,877 (65.0%) | $89,613 |
| Renter-Occupied | 1,380,613 (35.0%) | $45,850 |
| Average | 3,946,490 (100.0%) | $71,355 |
Occupancy by Householder Income Bracket in Georgia
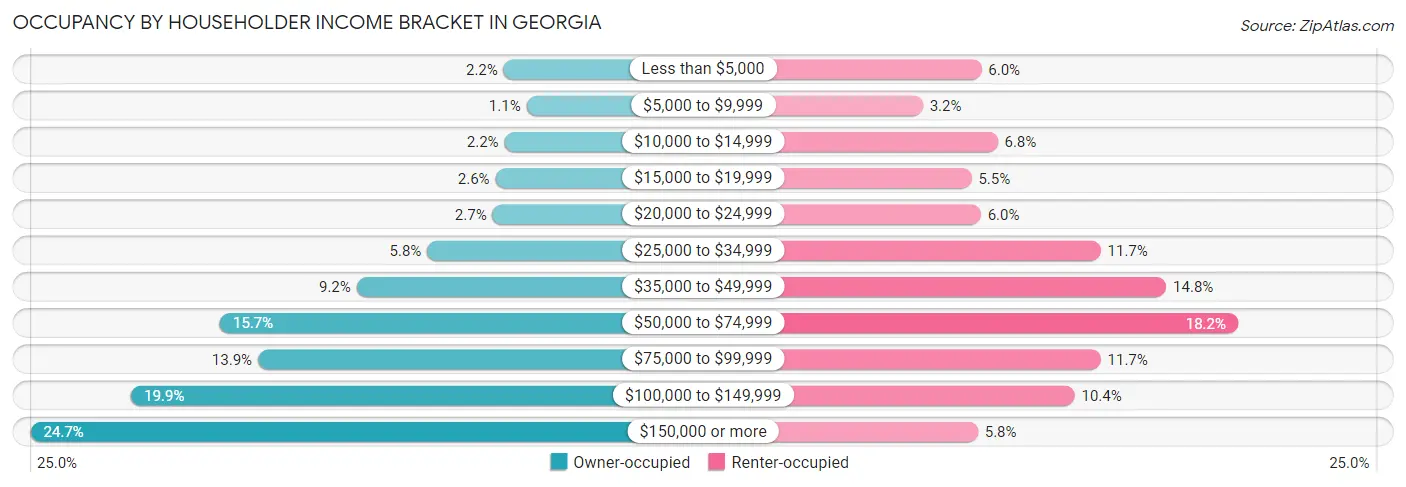
| Income Bracket | Owner-occupied | Renter-occupied |
| Less than $5,000 | 56,150 (2.2%) | 82,638 (6.0%) |
| $5,000 to $9,999 | 28,269 (1.1%) | 44,135 (3.2%) |
| $10,000 to $14,999 | 55,099 (2.1%) | 93,338 (6.8%) |
| $15,000 to $19,999 | 66,307 (2.6%) | 76,174 (5.5%) |
| $20,000 to $24,999 | 69,747 (2.7%) | 82,236 (6.0%) |
| $25,000 to $34,999 | 149,700 (5.8%) | 161,153 (11.7%) |
| $35,000 to $49,999 | 235,864 (9.2%) | 204,179 (14.8%) |
| $50,000 to $74,999 | 402,856 (15.7%) | 251,307 (18.2%) |
| $75,000 to $99,999 | 356,299 (13.9%) | 161,069 (11.7%) |
| $100,000 to $149,999 | 511,337 (19.9%) | 143,970 (10.4%) |
| $150,000 or more | 634,249 (24.7%) | 80,414 (5.8%) |
| Total | 2,565,877 (100.0%) | 1,380,613 (100.0%) |
Monthly Housing Cost Tiers in Georgia
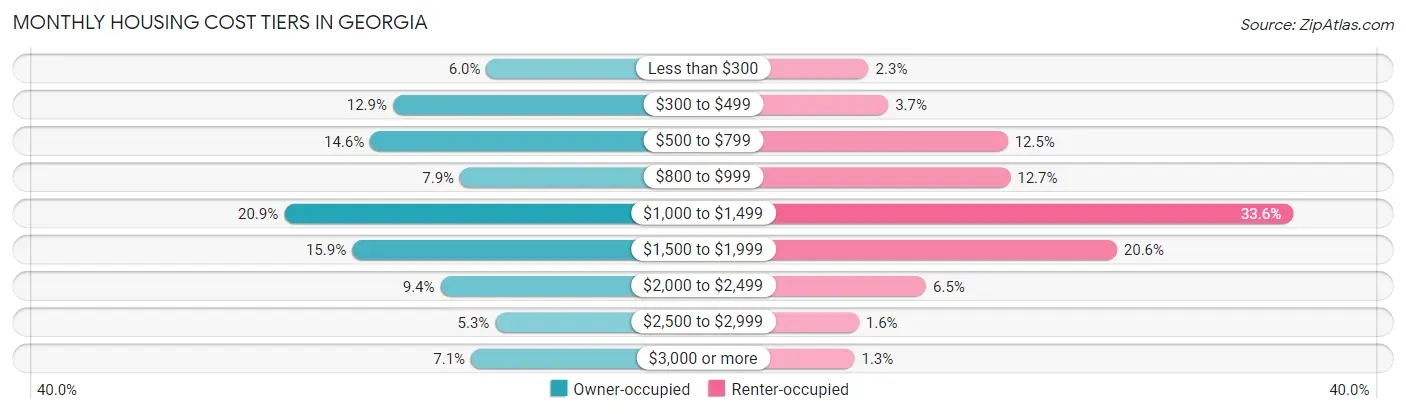
| Monthly Cost | Owner-occupied | Renter-occupied |
| Less than $300 | 153,771 (6.0%) | 31,753 (2.3%) |
| $300 to $499 | 330,439 (12.9%) | 51,593 (3.7%) |
| $500 to $799 | 373,694 (14.6%) | 173,149 (12.5%) |
| $800 to $999 | 203,699 (7.9%) | 175,778 (12.7%) |
| $1,000 to $1,499 | 536,060 (20.9%) | 463,200 (33.6%) |
| $1,500 to $1,999 | 407,643 (15.9%) | 284,111 (20.6%) |
| $2,000 to $2,499 | 240,791 (9.4%) | 90,095 (6.5%) |
| $2,500 to $2,999 | 136,894 (5.3%) | 21,872 (1.6%) |
| $3,000 or more | 182,886 (7.1%) | 17,450 (1.3%) |
| Total | 2,565,877 (100.0%) | 1,380,613 (100.0%) |
Physical Housing Characteristics in Georgia
Housing Structures in Georgia
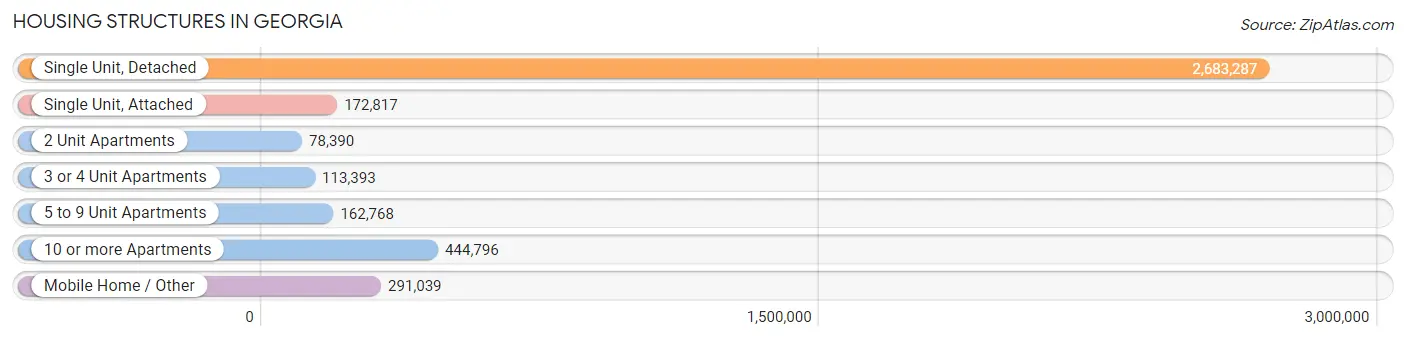
| Structure Type | # Housing Units | % Housing Units |
| Single Unit, Detached | 2,683,287 | 68.0% |
| Single Unit, Attached | 172,817 | 4.4% |
| 2 Unit Apartments | 78,390 | 2.0% |
| 3 or 4 Unit Apartments | 113,393 | 2.9% |
| 5 to 9 Unit Apartments | 162,768 | 4.1% |
| 10 or more Apartments | 444,796 | 11.3% |
| Mobile Home / Other | 291,039 | 7.4% |
| Total | 3,946,490 | 100.0% |
Housing Structures by Occupancy in Georgia
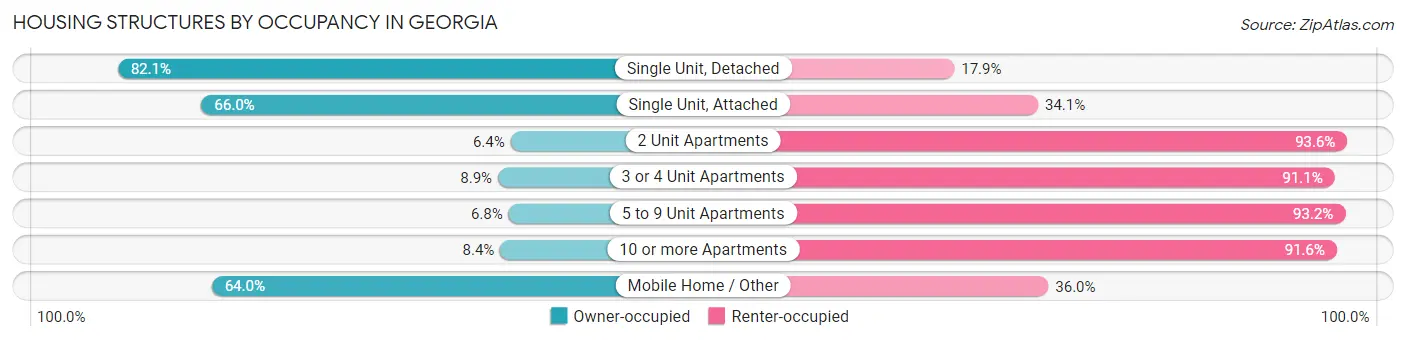
| Structure Type | Owner-occupied | Renter-occupied |
| Single Unit, Detached | 2,202,077 (82.1%) | 481,210 (17.9%) |
| Single Unit, Attached | 113,968 (65.9%) | 58,849 (34.1%) |
| 2 Unit Apartments | 5,037 (6.4%) | 73,353 (93.6%) |
| 3 or 4 Unit Apartments | 10,044 (8.9%) | 103,349 (91.1%) |
| 5 to 9 Unit Apartments | 11,102 (6.8%) | 151,666 (93.2%) |
| 10 or more Apartments | 37,496 (8.4%) | 407,300 (91.6%) |
| Mobile Home / Other | 186,153 (64.0%) | 104,886 (36.0%) |
| Total | 2,565,877 (65.0%) | 1,380,613 (35.0%) |
Housing Structures by Number of Rooms in Georgia
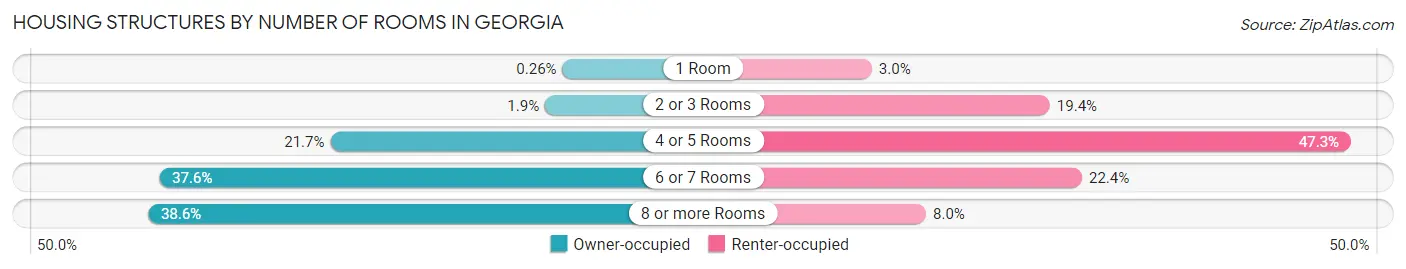
| Number of Rooms | Owner-occupied | Renter-occupied |
| 1 Room | 6,657 (0.3%) | 40,932 (3.0%) |
| 2 or 3 Rooms | 47,946 (1.9%) | 268,085 (19.4%) |
| 4 or 5 Rooms | 557,510 (21.7%) | 652,422 (47.3%) |
| 6 or 7 Rooms | 963,675 (37.6%) | 309,078 (22.4%) |
| 8 or more Rooms | 990,089 (38.6%) | 110,096 (8.0%) |
| Total | 2,565,877 (100.0%) | 1,380,613 (100.0%) |
Housing Structure by Heating Type in Georgia
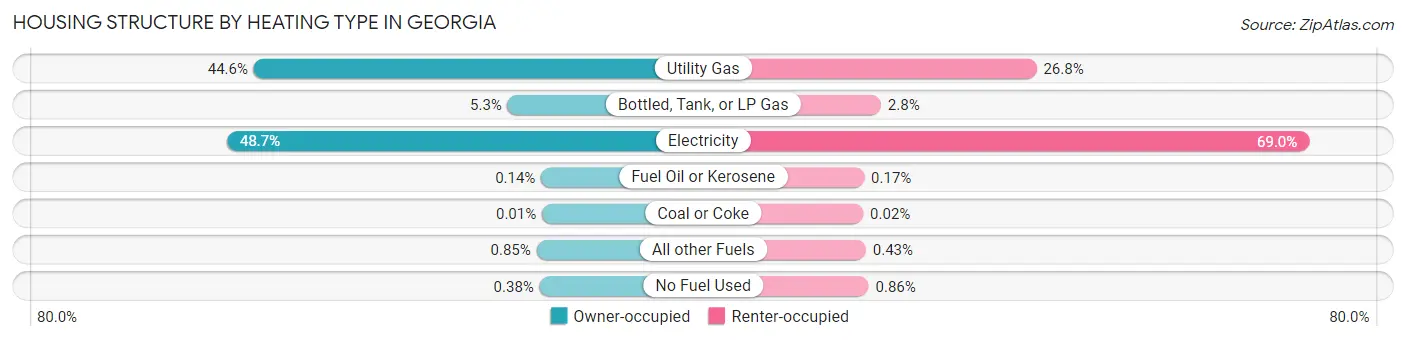
| Heating Type | Owner-occupied | Renter-occupied |
| Utility Gas | 1,143,523 (44.6%) | 370,091 (26.8%) |
| Bottled, Tank, or LP Gas | 136,455 (5.3%) | 38,047 (2.8%) |
| Electricity | 1,250,629 (48.7%) | 951,981 (69.0%) |
| Fuel Oil or Kerosene | 3,618 (0.1%) | 2,398 (0.2%) |
| Coal or Coke | 223 (0.0%) | 212 (0.0%) |
| All other Fuels | 21,764 (0.9%) | 5,944 (0.4%) |
| No Fuel Used | 9,665 (0.4%) | 11,940 (0.9%) |
| Total | 2,565,877 (100.0%) | 1,380,613 (100.0%) |
Household Vehicle Usage in Georgia
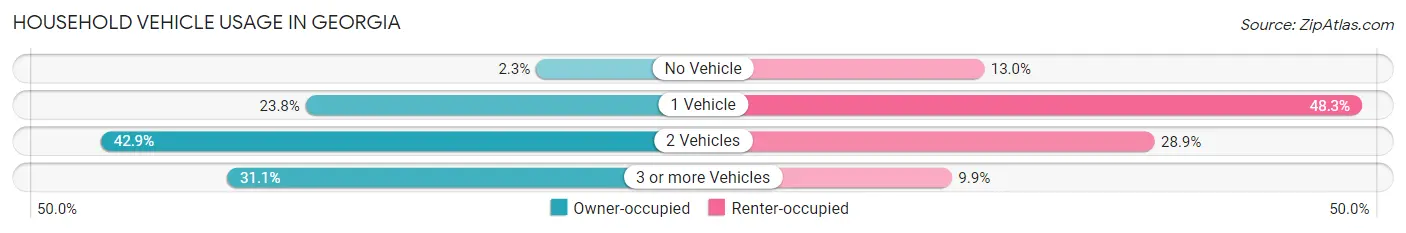
| Vehicles per Household | Owner-occupied | Renter-occupied |
| No Vehicle | 57,950 (2.3%) | 178,866 (13.0%) |
| 1 Vehicle | 609,968 (23.8%) | 666,146 (48.2%) |
| 2 Vehicles | 1,100,350 (42.9%) | 398,389 (28.9%) |
| 3 or more Vehicles | 797,609 (31.1%) | 137,212 (9.9%) |
| Total | 2,565,877 (100.0%) | 1,380,613 (100.0%) |
Real Estate & Mortgages in Georgia
Real Estate and Mortgage Overview in Georgia
| Characteristic | Without Mortgage | With Mortgage |
| Housing Units | 918,846 | 1,647,031 |
| Median Property Value | $199,100 | $269,600 |
| Median Household Income | $63,957 | $489,528 |
| Monthly Housing Costs | $493 | $179,806 |
| Real Estate Taxes | $1,416 | $41,018 |
Property Value by Mortgage Status in Georgia
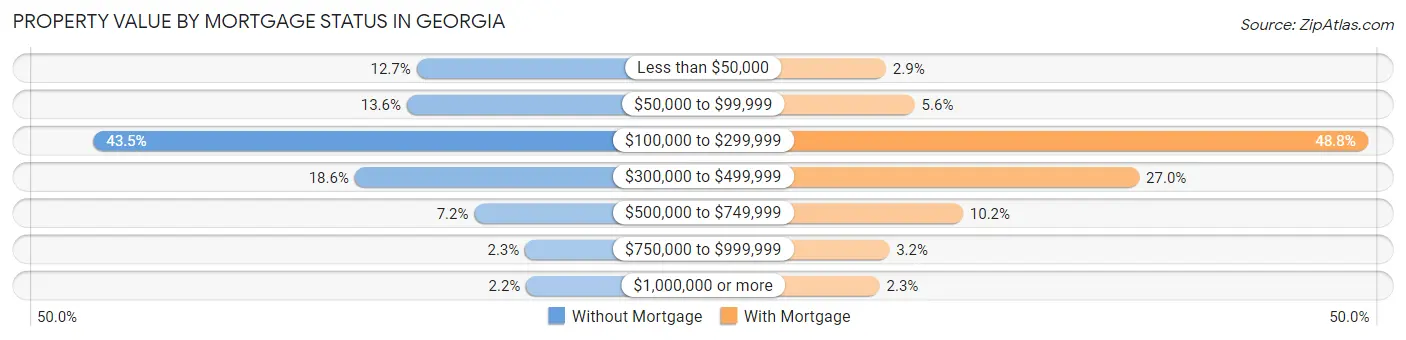
| Property Value | Without Mortgage | With Mortgage |
| Less than $50,000 | 116,380 (12.7%) | 47,572 (2.9%) |
| $50,000 to $99,999 | 124,934 (13.6%) | 92,684 (5.6%) |
| $100,000 to $299,999 | 399,280 (43.4%) | 803,033 (48.8%) |
| $300,000 to $499,999 | 170,511 (18.6%) | 444,822 (27.0%) |
| $500,000 to $749,999 | 65,865 (7.2%) | 168,334 (10.2%) |
| $750,000 to $999,999 | 21,400 (2.3%) | 52,856 (3.2%) |
| $1,000,000 or more | 20,476 (2.2%) | 37,730 (2.3%) |
| Total | 918,846 (100.0%) | 1,647,031 (100.0%) |
Household Income by Mortgage Status in Georgia
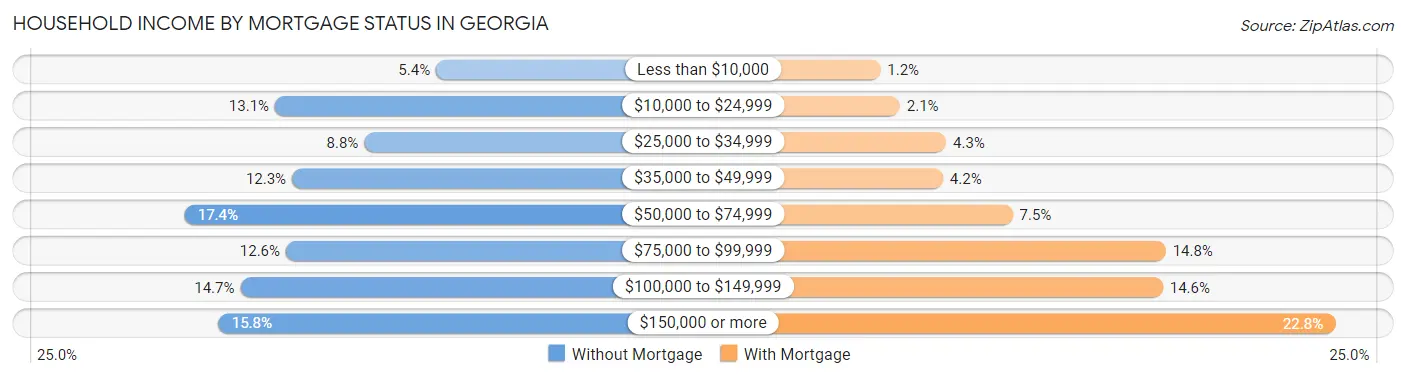
| Household Income | Without Mortgage | With Mortgage |
| Less than $10,000 | 49,734 (5.4%) | 19,487 (1.2%) |
| $10,000 to $24,999 | 120,151 (13.1%) | 34,685 (2.1%) |
| $25,000 to $34,999 | 81,136 (8.8%) | 71,002 (4.3%) |
| $35,000 to $49,999 | 112,720 (12.3%) | 68,564 (4.2%) |
| $50,000 to $74,999 | 159,627 (17.4%) | 123,144 (7.5%) |
| $75,000 to $99,999 | 115,404 (12.6%) | 243,229 (14.8%) |
| $100,000 to $149,999 | 135,353 (14.7%) | 240,895 (14.6%) |
| $150,000 or more | 144,721 (15.8%) | 375,984 (22.8%) |
| Total | 918,846 (100.0%) | 1,647,031 (100.0%) |
Property Value to Household Income Ratio in Georgia
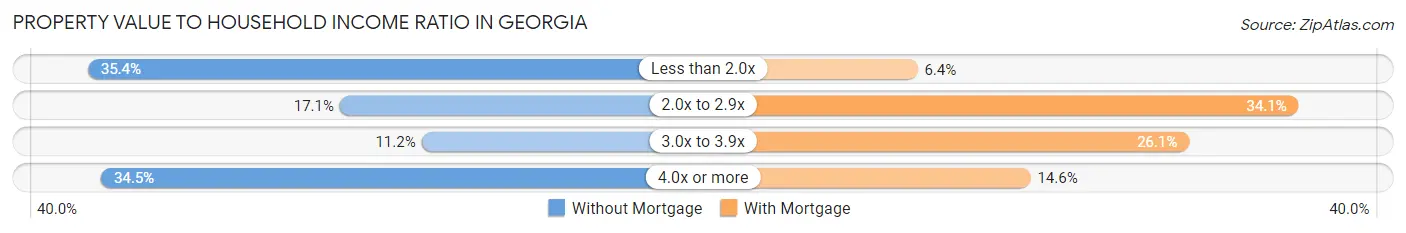
| Value-to-Income Ratio | Without Mortgage | With Mortgage |
| Less than 2.0x | 325,380 (35.4%) | 104,715 (6.4%) |
| 2.0x to 2.9x | 157,106 (17.1%) | 560,750 (34.1%) |
| 3.0x to 3.9x | 102,608 (11.2%) | 429,859 (26.1%) |
| 4.0x or more | 316,572 (34.4%) | 239,982 (14.6%) |
| Total | 918,846 (100.0%) | 1,647,031 (100.0%) |
Real Estate Taxes by Mortgage Status in Georgia
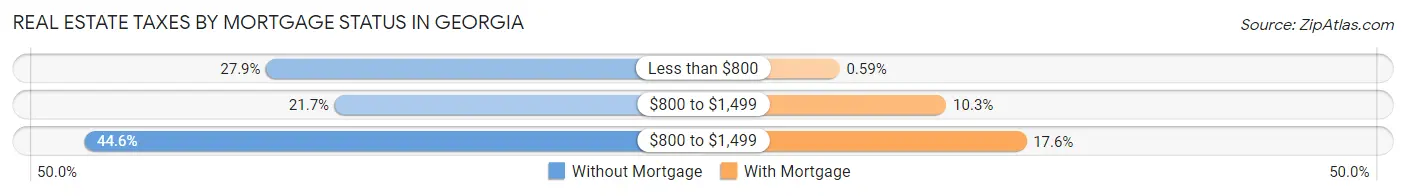
| Property Taxes | Without Mortgage | With Mortgage |
| Less than $800 | 256,524 (27.9%) | 9,695 (0.6%) |
| $800 to $1,499 | 199,060 (21.7%) | 170,220 (10.3%) |
| $800 to $1,499 | 409,552 (44.6%) | 290,613 (17.6%) |
| Total | 918,846 (100.0%) | 1,647,031 (100.0%) |
Health & Disability in Georgia
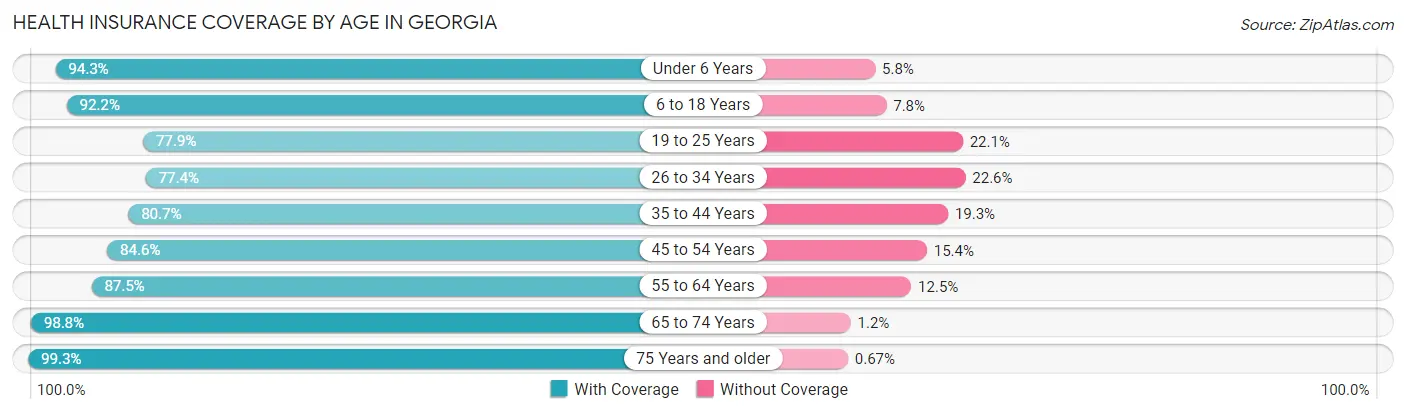
Health Insurance Coverage by Age in Georgia
| Age Bracket | With Coverage | Without Coverage |
| Under 6 Years | 723,691 (94.3%) | 44,146 (5.8%) |
| 6 to 18 Years | 1,754,322 (92.2%) | 149,061 (7.8%) |
| 19 to 25 Years | 779,370 (77.9%) | 220,803 (22.1%) |
| 26 to 34 Years | 992,643 (77.4%) | 289,506 (22.6%) |
| 35 to 44 Years | 1,114,982 (80.7%) | 267,124 (19.3%) |
| 45 to 54 Years | 1,169,978 (84.6%) | 212,808 (15.4%) |
| 55 to 64 Years | 1,144,946 (87.5%) | 163,107 (12.5%) |
| 65 to 74 Years | 923,994 (98.8%) | 11,005 (1.2%) |
| 75 Years and older | 566,594 (99.3%) | 3,820 (0.7%) |
| Total | 9,170,520 (87.1%) | 1,361,380 (12.9%) |
Health Insurance Coverage by Citizenship Status in Georgia
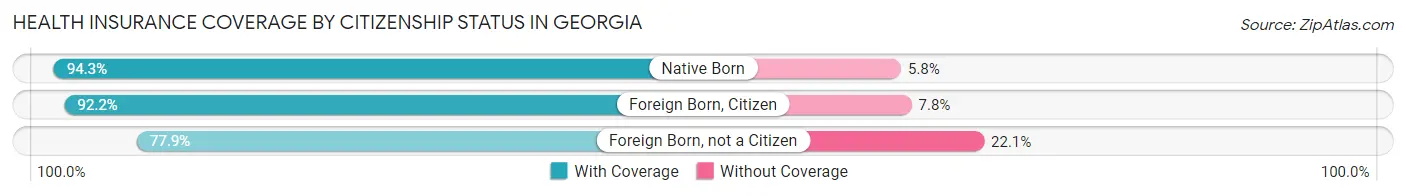
| Citizenship Status | With Coverage | Without Coverage |
| Native Born | 723,691 (94.3%) | 44,146 (5.8%) |
| Foreign Born, Citizen | 1,754,322 (92.2%) | 149,061 (7.8%) |
| Foreign Born, not a Citizen | 779,370 (77.9%) | 220,803 (22.1%) |
Health Insurance Coverage by Household Income in Georgia
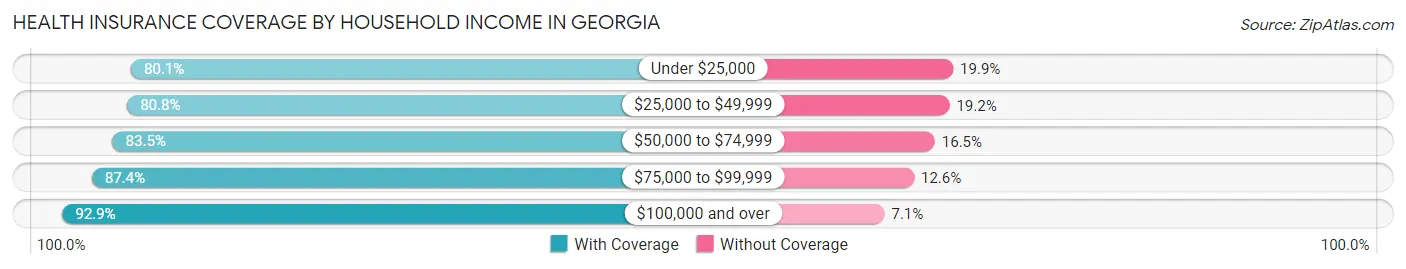
| Household Income | With Coverage | Without Coverage |
| Under $25,000 | 1,006,832 (80.1%) | 250,559 (19.9%) |
| $25,000 to $49,999 | 1,386,793 (80.8%) | 330,468 (19.2%) |
| $50,000 to $74,999 | 1,406,388 (83.5%) | 277,922 (16.5%) |
| $75,000 to $99,999 | 1,260,506 (87.4%) | 181,762 (12.6%) |
| $100,000 and over | 4,023,927 (92.9%) | 306,154 (7.1%) |
Public vs Private Health Insurance Coverage by Age in Georgia
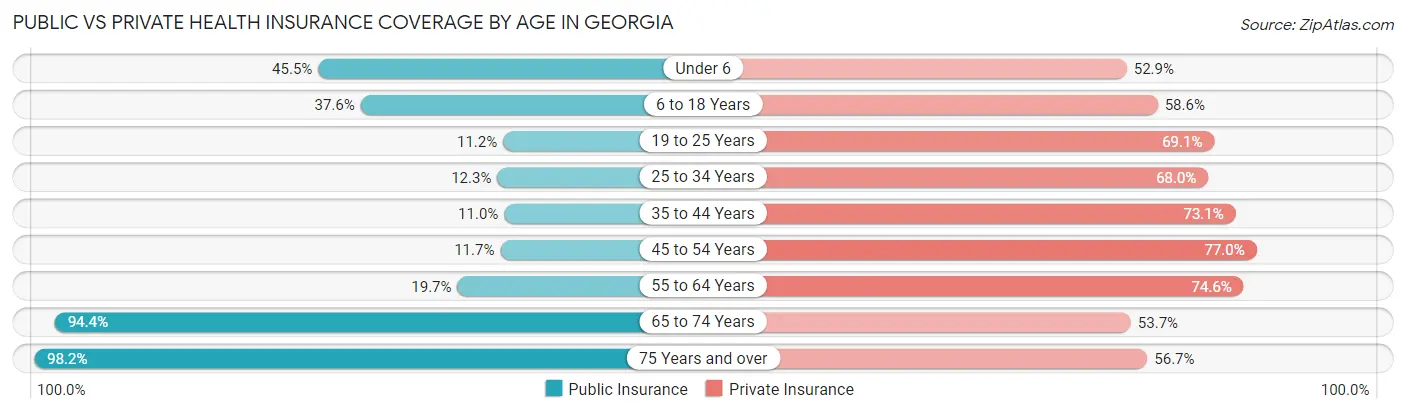
| Age Bracket | Public Insurance | Private Insurance |
| Under 6 | 349,464 (45.5%) | 406,212 (52.9%) |
| 6 to 18 Years | 716,447 (37.6%) | 1,116,198 (58.6%) |
| 19 to 25 Years | 111,879 (11.2%) | 691,348 (69.1%) |
| 25 to 34 Years | 157,256 (12.3%) | 871,809 (68.0%) |
| 35 to 44 Years | 151,919 (11.0%) | 1,009,994 (73.1%) |
| 45 to 54 Years | 162,123 (11.7%) | 1,064,277 (77.0%) |
| 55 to 64 Years | 257,296 (19.7%) | 975,537 (74.6%) |
| 65 to 74 Years | 882,646 (94.4%) | 501,687 (53.7%) |
| 75 Years and over | 560,351 (98.2%) | 323,513 (56.7%) |
| Total | 3,349,381 (31.8%) | 6,960,575 (66.1%) |
Disability Status by Sex by Age in Georgia
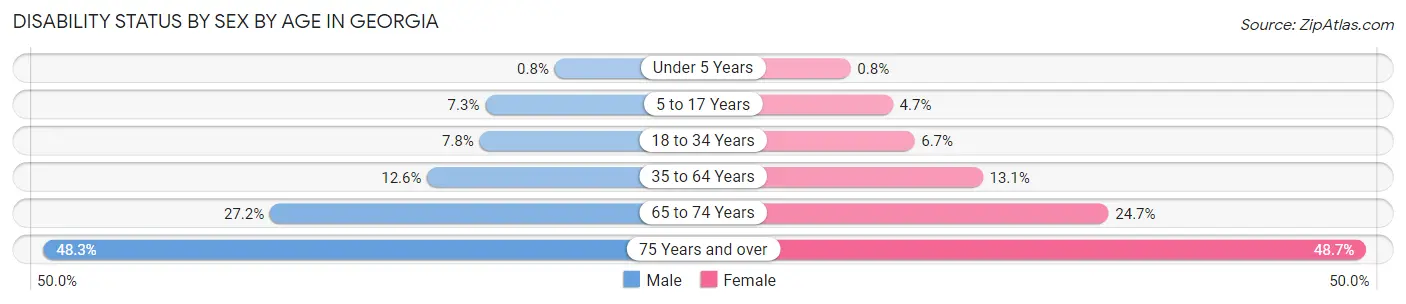
| Age Bracket | Male | Female |
| Under 5 Years | 2,621 (0.8%) | 2,469 (0.8%) |
| 5 to 17 Years | 69,379 (7.2%) | 43,370 (4.7%) |
| 18 to 34 Years | 92,982 (7.8%) | 83,975 (6.7%) |
| 35 to 64 Years | 247,130 (12.6%) | 276,202 (13.1%) |
| 65 to 74 Years | 116,399 (27.2%) | 125,517 (24.7%) |
| 75 Years and over | 112,770 (48.2%) | 163,831 (48.7%) |
Disability Class by Sex by Age in Georgia
Disability Class: Hearing Difficulty
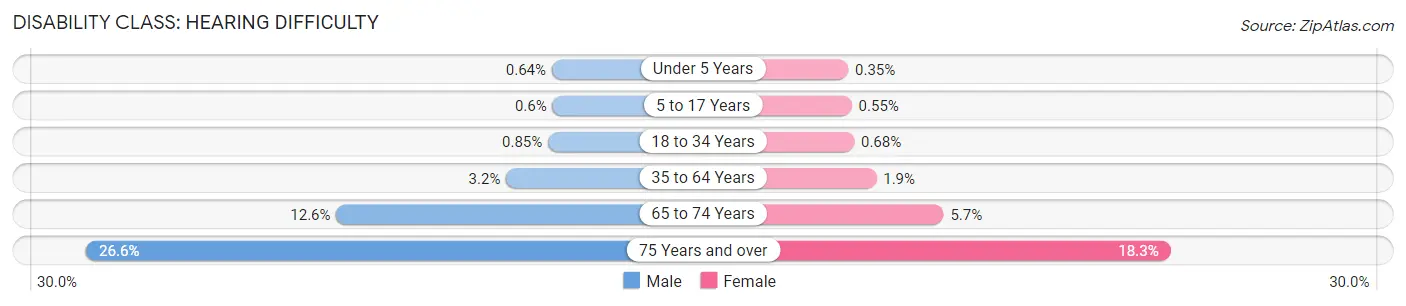
| Age Bracket | Male | Female |
| Under 5 Years | 2,073 (0.6%) | 1,080 (0.4%) |
| 5 to 17 Years | 5,783 (0.6%) | 5,075 (0.5%) |
| 18 to 34 Years | 10,129 (0.9%) | 8,533 (0.7%) |
| 35 to 64 Years | 62,232 (3.2%) | 40,589 (1.9%) |
| 65 to 74 Years | 54,061 (12.6%) | 28,711 (5.7%) |
| 75 Years and over | 62,104 (26.6%) | 61,623 (18.3%) |
Disability Class: Vision Difficulty
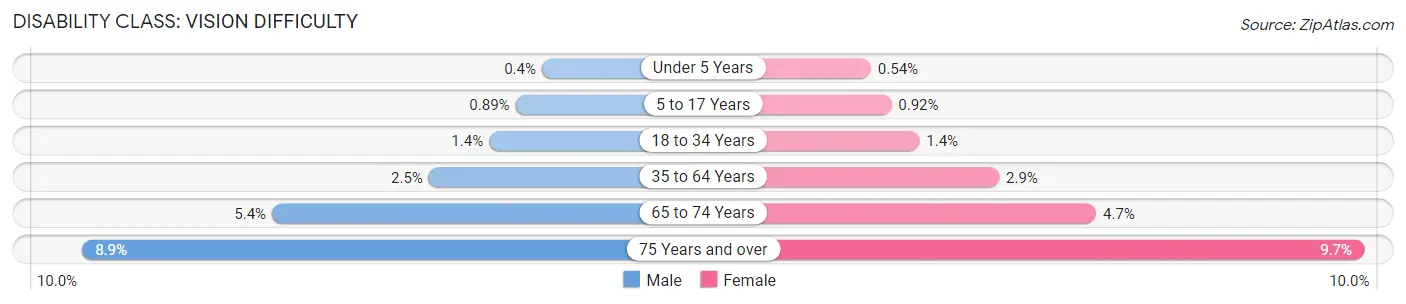
| Age Bracket | Male | Female |
| Under 5 Years | 1,298 (0.4%) | 1,665 (0.5%) |
| 5 to 17 Years | 8,545 (0.9%) | 8,485 (0.9%) |
| 18 to 34 Years | 16,440 (1.4%) | 18,013 (1.4%) |
| 35 to 64 Years | 48,893 (2.5%) | 61,865 (2.9%) |
| 65 to 74 Years | 23,121 (5.4%) | 23,960 (4.7%) |
| 75 Years and over | 20,883 (8.9%) | 32,620 (9.7%) |
Disability Class: Cognitive Difficulty
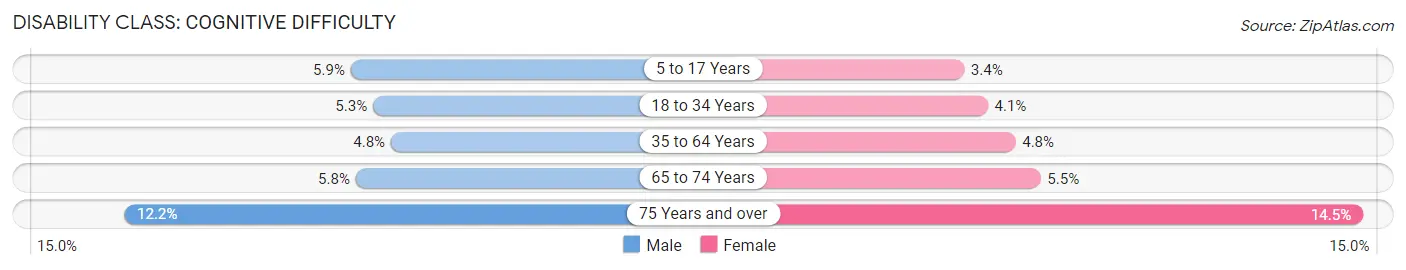
| Age Bracket | Male | Female |
| 5 to 17 Years | 56,648 (5.9%) | 31,229 (3.4%) |
| 18 to 34 Years | 63,401 (5.3%) | 50,623 (4.1%) |
| 35 to 64 Years | 93,897 (4.8%) | 102,260 (4.8%) |
| 65 to 74 Years | 24,711 (5.8%) | 28,057 (5.5%) |
| 75 Years and over | 28,578 (12.2%) | 48,839 (14.5%) |
Disability Class: Ambulatory Difficulty
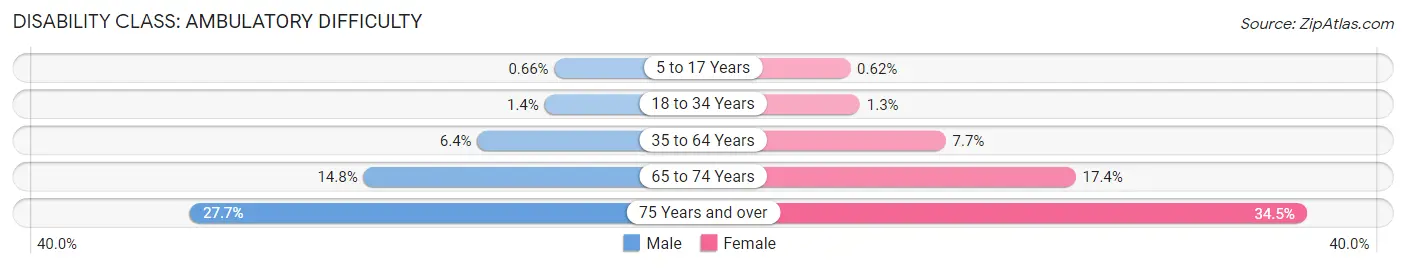
| Age Bracket | Male | Female |
| 5 to 17 Years | 6,320 (0.7%) | 5,692 (0.6%) |
| 18 to 34 Years | 16,595 (1.4%) | 16,735 (1.3%) |
| 35 to 64 Years | 124,949 (6.4%) | 163,220 (7.7%) |
| 65 to 74 Years | 63,467 (14.8%) | 88,110 (17.4%) |
| 75 Years and over | 64,758 (27.7%) | 116,181 (34.5%) |
Disability Class: Self-Care Difficulty
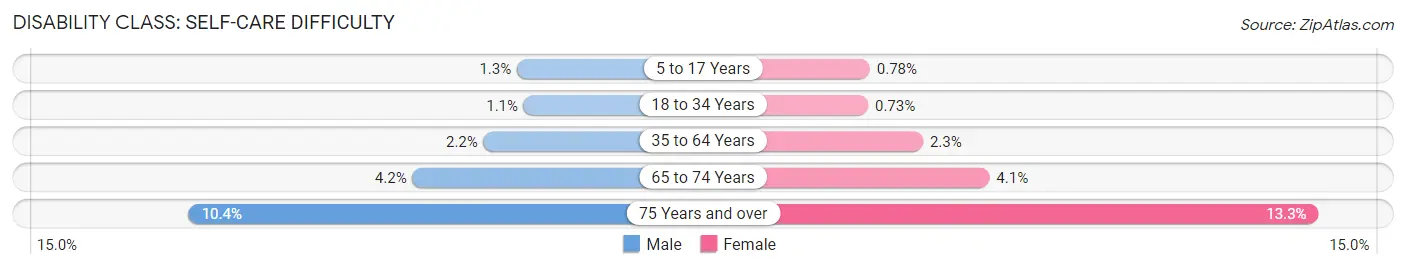
| Age Bracket | Male | Female |
| 5 to 17 Years | 12,352 (1.3%) | 7,131 (0.8%) |
| 18 to 34 Years | 13,206 (1.1%) | 9,071 (0.7%) |
| 35 to 64 Years | 43,397 (2.2%) | 47,794 (2.3%) |
| 65 to 74 Years | 17,970 (4.2%) | 20,839 (4.1%) |
| 75 Years and over | 24,367 (10.4%) | 44,680 (13.3%) |
Technology Access in Georgia
Computing Device Access in Georgia
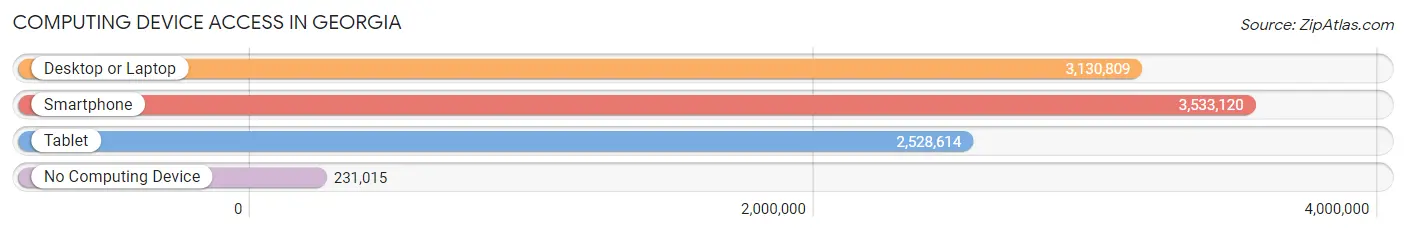
| Device Type | # Households | % Households |
| Desktop or Laptop | 3,130,809 | 79.3% |
| Smartphone | 3,533,120 | 89.5% |
| Tablet | 2,528,614 | 64.1% |
| No Computing Device | 231,015 | 5.9% |
| Total | 3,946,490 | 100.0% |
Internet Access in Georgia
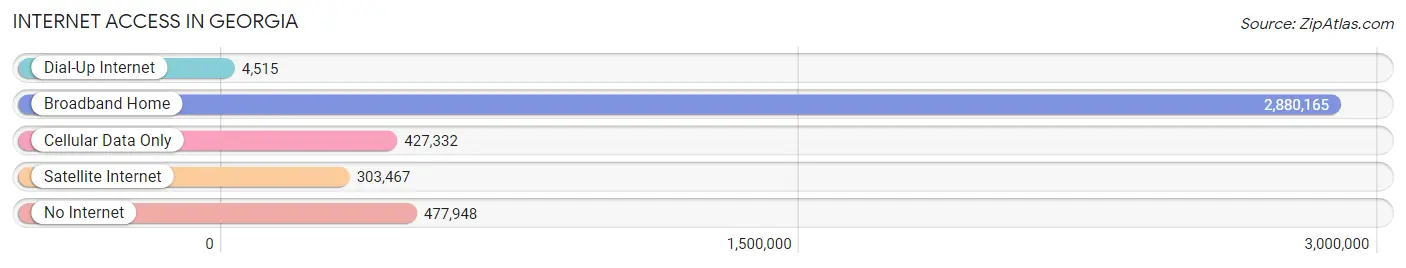
| Internet Type | # Households | % Households |
| Dial-Up Internet | 4,515 | 0.1% |
| Broadband Home | 2,880,165 | 73.0% |
| Cellular Data Only | 427,332 | 10.8% |
| Satellite Internet | 303,467 | 7.7% |
| No Internet | 477,948 | 12.1% |
| Total | 3,946,490 | 100.0% |
Georgia Summary
Georgia is a state located in the southeastern United States. It is bordered by Tennessee to the north, North Carolina and South Carolina to the east, and Florida to the south. Georgia is the 24th largest state in the United States, with an area of 59,441 square miles (153,909 km2). It is the 8th most populous state in the United States, with a population of 10,617,423 as of 2019.
Geography
Georgia is located in the southeastern United States, bordered by Tennessee to the north, North Carolina and South Carolina to the east, and Florida to the south. The state is divided into 159 counties, with the majority of the population living in the metropolitan areas of Atlanta, Augusta, Columbus, and Savannah. Georgia is the 24th largest state in the United States, with an area of 59,441 square miles (153,909 km2). The highest point in the state is Brasstown Bald, at 4,784 feet (1,458 m) above sea level. The state is home to the Blue Ridge Mountains, the Appalachian Mountains, and the Chattahoochee River.
History
Georgia was one of the original 13 colonies that formed the United States. It was the fourth state to ratify the United States Constitution, on January 2, 1788. Georgia was the last of the original colonies to be admitted to the Union. During the American Civil War, Georgia was the last Confederate state to secede from the Union, on January 19, 1861. After the war, Georgia was the first state to be readmitted to the Union, on July 15, 1870.
Economy
Georgia has a diverse economy, with a gross domestic product (GDP) of $567.2 billion in 2018. The state is home to a number of major industries, including agriculture, manufacturing, tourism, and technology. The state is the leading producer of peanuts, pecans, and peaches in the United States. Georgia is also a major producer of poultry, cotton, and timber. The state is home to a number of Fortune 500 companies, including The Home Depot, UPS, and Coca-Cola.
Demographics
As of 2019, Georgia had a population of 10,617,423, making it the 8th most populous state in the United States. The state has a population density of 181.3 people per square mile (70.2/km2). The racial makeup of the state is 59.7% White, 31.5% Black or African American, 4.1% Asian, 0.3% Native American, 0.1% Pacific Islander, 2.7% from other races, and 1.7% from two or more races. The median household income in the state is $54,342, and the median age is 36.7 years.
Common Questions
When was Georgia Incorporated?
Georgia was Incorporated into the Union on Jan 2, 1788.
What is the Total Area of Georgia?
Total Area of Georgia is 59,425 Square Miles.
What is the Total Land Area of Georgia?
Total Land Area of Georgia is 57,501 Square Miles.
What is the Total Water Area of Georgia?
Total Water Area of Georgia is 1,924 Square Miles.
What is the Average Elevation in Georgia?
Average Elevation in Georgia is 600 Feet.
What is the Highest Elevation in Georgia?
Highest Elevation in Georgia is 4,784 Feet.
What is the Lowest Elevation in Georgia?
Lowest Elevation in Georgia is 0 Feet.
What is the Population Density in Georgia?
Population Density in Georgia is 186.5 People per Square Mile.
What is Per Capita Income in Georgia?
Per Capita income in Georgia is $37,836.
What is the Median Family Income in Georgia?
Median Family Income in Georgia is $86,169.
What is the Median Household income in Georgia?
Median Household Income in Georgia is $71,355.
What is Income or Wage Gap in Georgia?
Income or Wage Gap in Georgia is 25.8%.
Women in Georgia earn 74.2 cents for every dollar earned by a man.
What is Family Income Deficit in Georgia?
Family Income Deficit in Georgia is $11,259.
Families that are below poverty line in Georgia earn $11,259 less on average than the poverty threshold level.
What is Inequality or Gini Index in Georgia?
Inequality or Gini Index in Georgia is 0.48.
What is the Total Population of Georgia?
Total Population of Georgia is 10,722,325.
What is the Total Male Population of Georgia?
Total Male Population of Georgia is 5,244,476.
What is the Total Female Population of Georgia?
Total Female Population of Georgia is 5,477,849.
What is the Ratio of Males per 100 Females in Georgia?
There are 95.74 Males per 100 Females in Georgia.
What is the Ratio of Females per 100 Males in Georgia?
There are 104.45 Females per 100 Males in Georgia.
What is the Median Population Age in Georgia?
Median Population Age in Georgia is 37.2 Years.
What is the Average Family Size in Georgia
Average Family Size in Georgia is 3.3 People.
What is the Average Household Size in Georgia
Average Household Size in Georgia is 2.6 People.
How Large is the Labor Force in Georgia?
There are 5,408,659 People in the Labor Forcein in Georgia.
What is the Percentage of People in the Labor Force in Georgia?
63.6% of People are in the Labor Force in Georgia.
What is the Unemployment Rate in Georgia?
Unemployment Rate in Georgia is 5.2%.