Immigrants from Bolivia Disability Age 5 to 17
COMPARE
Immigrants from Bolivia
Select to Compare
Disability Age 5 to 17
Immigrants from Bolivia Disability Age 5 to 17
4.8%
DISABILITY | AGE 5 TO 17
100.0/ 100
METRIC RATING
23rd/ 347
METRIC RANK
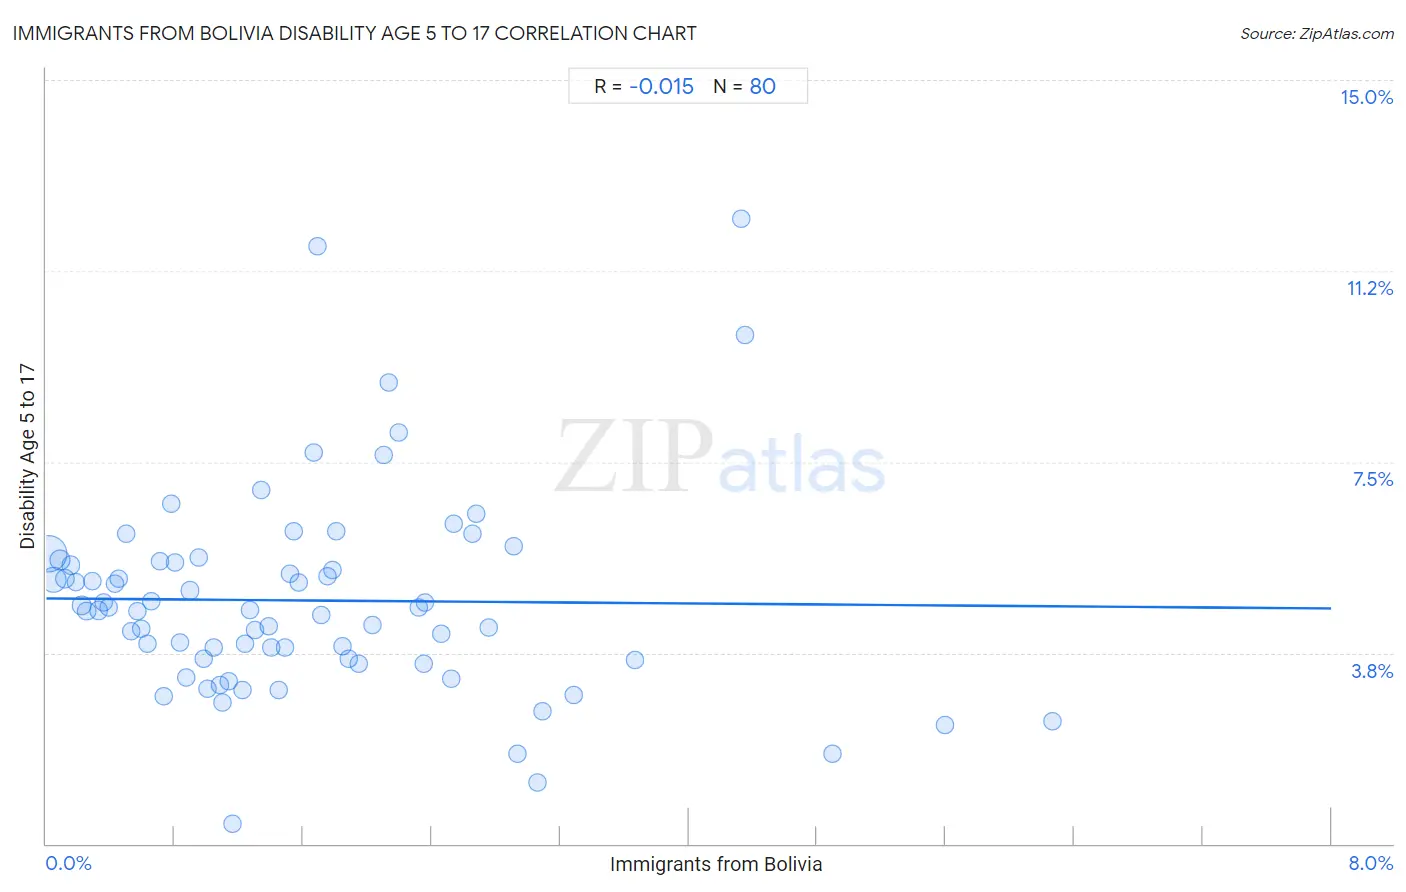
Immigrants from Bolivia Disability Age 5 to 17 Correlation Chart
The statistical analysis conducted on geographies consisting of 158,284,084 people shows no correlation between the proportion of Immigrants from Bolivia and percentage of population with a disability between the ages 5 and 17 in the United States with a correlation coefficient (R) of -0.015 and weighted average of 4.8%. On average, for every 1% (one percent) increase in Immigrants from Bolivia within a typical geography, there is a decrease of 0.024% in percentage of population with a disability between the ages 5 and 17.
It is essential to understand that the correlation between the percentage of Immigrants from Bolivia and percentage of population with a disability between the ages 5 and 17 does not imply a direct cause-and-effect relationship. It remains uncertain whether the presence of Immigrants from Bolivia influences an upward or downward trend in the level of percentage of population with a disability between the ages 5 and 17 within an area, or if Immigrants from Bolivia simply ended up residing in those areas with higher or lower levels of percentage of population with a disability between the ages 5 and 17 due to other factors.
Demographics Similar to Immigrants from Bolivia by Disability Age 5 to 17
In terms of disability age 5 to 17, the demographic groups most similar to Immigrants from Bolivia are Immigrants from Lebanon (4.8%, a difference of 0.15%), Immigrants from Asia (4.8%, a difference of 0.26%), Asian (4.8%, a difference of 0.66%), Yup'ik (4.8%, a difference of 1.0%), and Bhutanese (4.9%, a difference of 1.1%).
| Demographics | Rating | Rank | Disability Age 5 to 17 |
| Immigrants from Singapore | 100.0 /100 | #16 | Exceptional 4.7% |
| Arapaho | 100.0 /100 | #17 | Exceptional 4.7% |
| Immigrants from South Central Asia | 100.0 /100 | #18 | Exceptional 4.7% |
| Immigrants from Uzbekistan | 100.0 /100 | #19 | Exceptional 4.8% |
| Burmese | 100.0 /100 | #20 | Exceptional 4.8% |
| Yup'ik | 100.0 /100 | #21 | Exceptional 4.8% |
| Asians | 100.0 /100 | #22 | Exceptional 4.8% |
| Immigrants from Bolivia | 100.0 /100 | #23 | Exceptional 4.8% |
| Immigrants from Lebanon | 100.0 /100 | #24 | Exceptional 4.8% |
| Immigrants from Asia | 100.0 /100 | #25 | Exceptional 4.8% |
| Bhutanese | 100.0 /100 | #26 | Exceptional 4.9% |
| Taiwanese | 100.0 /100 | #27 | Exceptional 4.9% |
| Immigrants from Japan | 100.0 /100 | #28 | Exceptional 4.9% |
| Immigrants from Serbia | 100.0 /100 | #29 | Exceptional 4.9% |
| Immigrants from Malaysia | 100.0 /100 | #30 | Exceptional 5.0% |
Immigrants from Bolivia Disability Age 5 to 17 Correlation Summary
| Measurement | Immigrants from Bolivia Data | Disability Age 5 to 17 Data |
| Minimum | 0.017% | 0.40% |
| Maximum | 6.3% | 12.3% |
| Range | 6.2% | 11.9% |
| Mean | 1.6% | 4.8% |
| Median | 1.4% | 4.6% |
| Interquartile 25% (IQ1) | 0.68% | 3.6% |
| Interquartile 75% (IQ3) | 2.3% | 5.5% |
| Interquartile Range (IQR) | 1.6% | 1.9% |
| Standard Deviation (Sample) | 1.3% | 2.0% |
| Standard Deviation (Population) | 1.3% | 2.0% |
Correlation Details
| Immigrants from Bolivia Percentile | Sample Size | Disability Age 5 to 17 |
[ 0.0% - 0.5% ] 0.017% | 83,887,468 | 5.7% |
[ 0.0% - 0.5% ] 0.048% | 35,233,086 | 5.2% |
[ 0.0% - 0.5% ] 0.084% | 11,324,012 | 5.6% |
[ 0.0% - 0.5% ] 0.12% | 6,139,494 | 5.2% |
[ 0.0% - 0.5% ] 0.15% | 3,824,788 | 5.5% |
[ 0.0% - 0.5% ] 0.19% | 3,575,638 | 5.1% |
[ 0.0% - 0.5% ] 0.22% | 2,199,764 | 4.7% |
[ 0.0% - 0.5% ] 0.25% | 1,429,202 | 4.6% |
[ 0.0% - 0.5% ] 0.29% | 1,149,717 | 5.2% |
[ 0.0% - 0.5% ] 0.32% | 1,417,977 | 4.6% |
[ 0.0% - 0.5% ] 0.36% | 772,078 | 4.7% |
[ 0.0% - 0.5% ] 0.39% | 613,751 | 4.6% |
[ 0.0% - 0.5% ] 0.43% | 583,488 | 5.1% |
[ 0.0% - 0.5% ] 0.45% | 498,337 | 5.2% |
[ 0.0% - 0.5% ] 0.50% | 477,068 | 6.1% |
[ 0.5% - 1.0% ] 0.53% | 339,606 | 4.2% |
[ 0.5% - 1.0% ] 0.57% | 565,027 | 4.6% |
[ 0.5% - 1.0% ] 0.59% | 181,273 | 4.2% |
[ 0.5% - 1.0% ] 0.63% | 265,210 | 3.9% |
[ 0.5% - 1.0% ] 0.66% | 235,620 | 4.8% |
[ 0.5% - 1.0% ] 0.71% | 176,864 | 5.5% |
[ 0.5% - 1.0% ] 0.73% | 153,078 | 2.9% |
[ 0.5% - 1.0% ] 0.78% | 119,786 | 6.7% |
[ 0.5% - 1.0% ] 0.80% | 213,043 | 5.5% |
[ 0.5% - 1.0% ] 0.84% | 158,854 | 3.9% |
[ 0.5% - 1.0% ] 0.87% | 229,496 | 3.3% |
[ 0.5% - 1.0% ] 0.90% | 205,413 | 5.0% |
[ 0.5% - 1.0% ] 0.95% | 148,811 | 5.6% |
[ 0.5% - 1.0% ] 0.98% | 111,618 | 3.6% |
[ 1.0% - 1.5% ] 1.00% | 96,307 | 3.0% |
[ 1.0% - 1.5% ] 1.04% | 122,720 | 3.8% |
[ 1.0% - 1.5% ] 1.08% | 291,181 | 3.1% |
[ 1.0% - 1.5% ] 1.10% | 19,401 | 2.8% |
[ 1.0% - 1.5% ] 1.14% | 103,456 | 3.2% |
[ 1.0% - 1.5% ] 1.16% | 16,620 | 0.40% |
[ 1.0% - 1.5% ] 1.22% | 30,566 | 3.0% |
[ 1.0% - 1.5% ] 1.24% | 18,557 | 3.9% |
[ 1.0% - 1.5% ] 1.26% | 38,745 | 4.6% |
[ 1.0% - 1.5% ] 1.30% | 34,442 | 4.2% |
[ 1.0% - 1.5% ] 1.34% | 5,663 | 6.9% |
[ 1.0% - 1.5% ] 1.38% | 54,699 | 4.3% |
[ 1.0% - 1.5% ] 1.40% | 36,063 | 3.9% |
[ 1.0% - 1.5% ] 1.45% | 65,223 | 3.0% |
[ 1.0% - 1.5% ] 1.48% | 118,205 | 3.9% |
[ 1.5% - 2.0% ] 1.52% | 113,497 | 5.3% |
[ 1.5% - 2.0% ] 1.54% | 21,991 | 6.1% |
[ 1.5% - 2.0% ] 1.57% | 114,723 | 5.1% |
[ 1.5% - 2.0% ] 1.67% | 120 | 7.7% |
[ 1.5% - 2.0% ] 1.69% | 19,372 | 11.7% |
[ 1.5% - 2.0% ] 1.71% | 6,359 | 4.5% |
[ 1.5% - 2.0% ] 1.75% | 24,242 | 5.2% |
[ 1.5% - 2.0% ] 1.79% | 7,057 | 5.4% |
[ 1.5% - 2.0% ] 1.81% | 1,604 | 6.1% |
[ 1.5% - 2.0% ] 1.84% | 27,734 | 3.9% |
[ 1.5% - 2.0% ] 1.89% | 62,332 | 3.6% |
[ 1.5% - 2.0% ] 1.94% | 31,022 | 3.5% |
[ 2.0% - 2.5% ] 2.03% | 44,959 | 4.3% |
[ 2.0% - 2.5% ] 2.10% | 9,141 | 7.6% |
[ 2.0% - 2.5% ] 2.13% | 17,788 | 9.1% |
[ 2.0% - 2.5% ] 2.19% | 5,790 | 8.1% |
[ 2.0% - 2.5% ] 2.32% | 24,785 | 4.7% |
[ 2.0% - 2.5% ] 2.35% | 1,790 | 3.5% |
[ 2.0% - 2.5% ] 2.36% | 38,077 | 4.7% |
[ 2.0% - 2.5% ] 2.46% | 26,573 | 4.1% |
[ 2.5% - 3.0% ] 2.52% | 58,872 | 3.2% |
[ 2.5% - 3.0% ] 2.54% | 58,775 | 6.3% |
[ 2.5% - 3.0% ] 2.65% | 15,459 | 6.1% |
[ 2.5% - 3.0% ] 2.68% | 43,882 | 6.5% |
[ 2.5% - 3.0% ] 2.76% | 52,359 | 4.2% |
[ 2.5% - 3.0% ] 2.91% | 19,812 | 5.8% |
[ 2.5% - 3.0% ] 2.94% | 16,827 | 1.8% |
[ 3.0% - 3.5% ] 3.06% | 4,218 | 1.2% |
[ 3.0% - 3.5% ] 3.09% | 6,510 | 2.6% |
[ 3.0% - 3.5% ] 3.29% | 49,246 | 2.9% |
[ 3.5% - 4.0% ] 3.66% | 6,500 | 3.6% |
[ 4.0% - 4.5% ] 4.33% | 1,202 | 12.3% |
[ 4.0% - 4.5% ] 4.35% | 46 | 10.0% |
[ 4.5% - 5.0% ] 4.90% | 4,024 | 1.8% |
[ 5.5% - 6.0% ] 5.59% | 34,860 | 2.3% |
[ 6.0% - 6.5% ] 6.27% | 31,121 | 2.4% |