Immigrants from China Disability Age 5 to 17
COMPARE
Immigrants from China
Select to Compare
Disability Age 5 to 17
Immigrants from China Disability Age 5 to 17
4.5%
DISABILITY | AGE 5 TO 17
100.0/ 100
METRIC RATING
7th/ 347
METRIC RANK
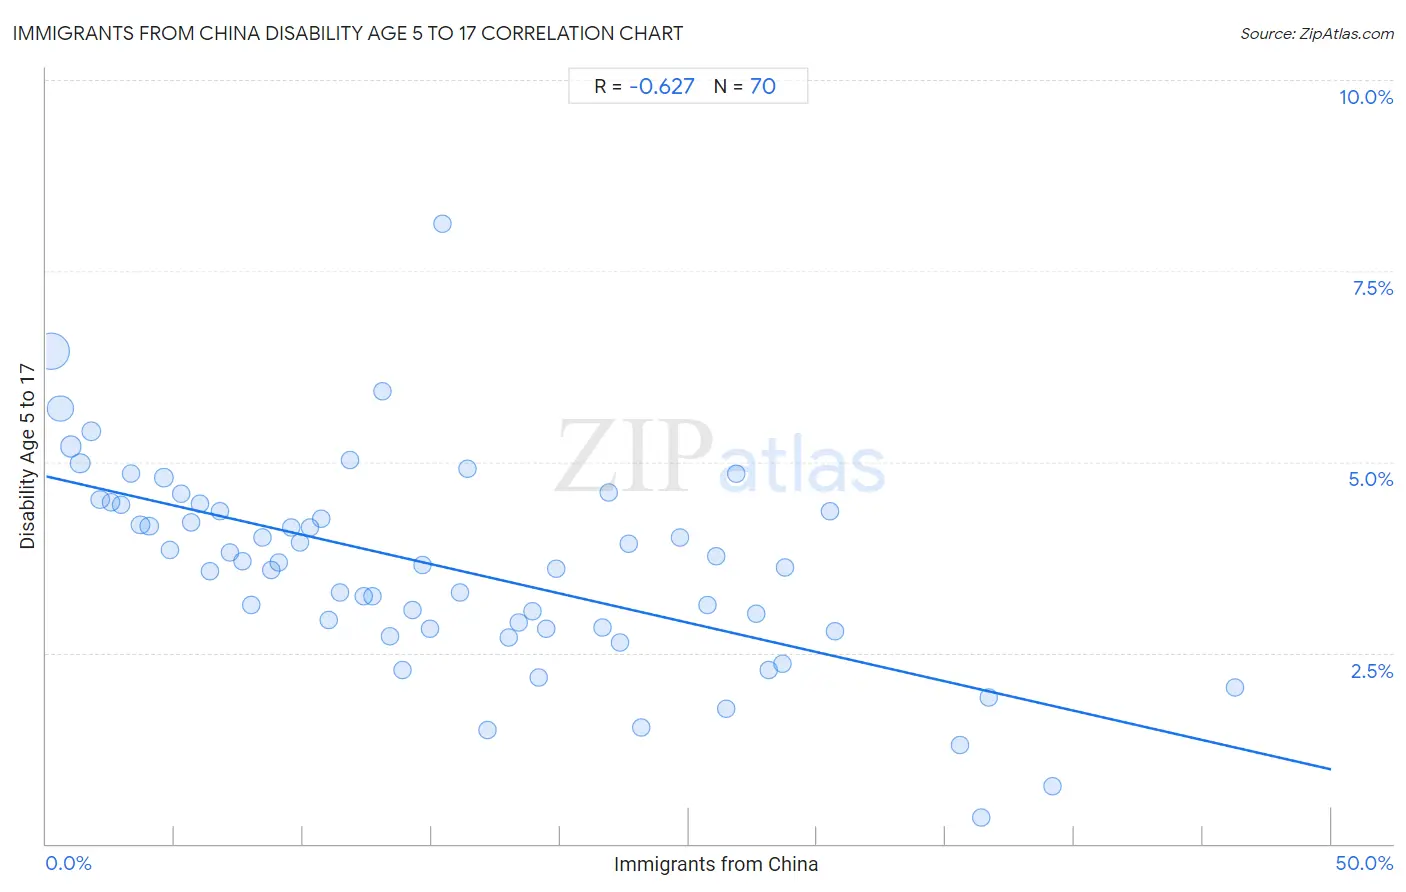
Immigrants from China Disability Age 5 to 17 Correlation Chart
The statistical analysis conducted on geographies consisting of 452,068,027 people shows a significant negative correlation between the proportion of Immigrants from China and percentage of population with a disability between the ages 5 and 17 in the United States with a correlation coefficient (R) of -0.627 and weighted average of 4.5%. On average, for every 1% (one percent) increase in Immigrants from China within a typical geography, there is a decrease of 0.077% in percentage of population with a disability between the ages 5 and 17.
It is essential to understand that the correlation between the percentage of Immigrants from China and percentage of population with a disability between the ages 5 and 17 does not imply a direct cause-and-effect relationship. It remains uncertain whether the presence of Immigrants from China influences an upward or downward trend in the level of percentage of population with a disability between the ages 5 and 17 within an area, or if Immigrants from China simply ended up residing in those areas with higher or lower levels of percentage of population with a disability between the ages 5 and 17 due to other factors.
Demographics Similar to Immigrants from China by Disability Age 5 to 17
In terms of disability age 5 to 17, the demographic groups most similar to Immigrants from China are Immigrants from Israel (4.5%, a difference of 0.31%), Indian (Asian) (4.6%, a difference of 0.93%), Immigrants from Eastern Asia (4.6%, a difference of 1.3%), Immigrants from India (4.6%, a difference of 1.3%), and Armenian (4.6%, a difference of 1.5%).
| Demographics | Rating | Rank | Disability Age 5 to 17 |
| Immigrants from Armenia | 100.0 /100 | #1 | Exceptional 4.1% |
| Immigrants from Taiwan | 100.0 /100 | #2 | Exceptional 4.2% |
| Immigrants from Hong Kong | 100.0 /100 | #3 | Exceptional 4.3% |
| Filipinos | 100.0 /100 | #4 | Exceptional 4.3% |
| Immigrants from Iran | 100.0 /100 | #5 | Exceptional 4.4% |
| Immigrants from Israel | 100.0 /100 | #6 | Exceptional 4.5% |
| Immigrants from China | 100.0 /100 | #7 | Exceptional 4.5% |
| Indians (Asian) | 100.0 /100 | #8 | Exceptional 4.6% |
| Immigrants from Eastern Asia | 100.0 /100 | #9 | Exceptional 4.6% |
| Immigrants from India | 100.0 /100 | #10 | Exceptional 4.6% |
| Armenians | 100.0 /100 | #11 | Exceptional 4.6% |
| Iranians | 100.0 /100 | #12 | Exceptional 4.6% |
| Thais | 100.0 /100 | #13 | Exceptional 4.7% |
| Immigrants from Korea | 100.0 /100 | #14 | Exceptional 4.7% |
| Chinese | 100.0 /100 | #15 | Exceptional 4.7% |
Immigrants from China Disability Age 5 to 17 Correlation Summary
| Measurement | Immigrants from China Data | Disability Age 5 to 17 Data |
| Minimum | 0.17% | 0.35% |
| Maximum | 46.3% | 8.1% |
| Range | 46.1% | 7.8% |
| Mean | 15.5% | 3.6% |
| Median | 13.6% | 3.7% |
| Interquartile 25% (IQ1) | 6.8% | 2.8% |
| Interquartile 75% (IQ3) | 22.7% | 4.4% |
| Interquartile Range (IQR) | 15.9% | 1.6% |
| Standard Deviation (Sample) | 10.7% | 1.3% |
| Standard Deviation (Population) | 10.7% | 1.3% |
Correlation Details
| Immigrants from China Percentile | Sample Size | Disability Age 5 to 17 |
[ 0.0% - 0.5% ] 0.17% | 218,743,703 | 6.4% |
[ 0.5% - 1.0% ] 0.54% | 92,602,903 | 5.7% |
[ 0.5% - 1.0% ] 0.95% | 38,137,774 | 5.2% |
[ 1.0% - 1.5% ] 1.33% | 25,040,720 | 5.0% |
[ 1.5% - 2.0% ] 1.73% | 13,775,491 | 5.4% |
[ 2.0% - 2.5% ] 2.10% | 10,104,869 | 4.5% |
[ 2.5% - 3.0% ] 2.52% | 4,982,844 | 4.5% |
[ 2.5% - 3.0% ] 2.91% | 5,760,393 | 4.4% |
[ 3.0% - 3.5% ] 3.29% | 5,087,054 | 4.8% |
[ 3.5% - 4.0% ] 3.67% | 3,055,315 | 4.2% |
[ 4.0% - 4.5% ] 4.01% | 2,735,384 | 4.2% |
[ 4.5% - 5.0% ] 4.58% | 11,854,909 | 4.8% |
[ 4.5% - 5.0% ] 4.83% | 1,629,641 | 3.9% |
[ 5.0% - 5.5% ] 5.24% | 1,088,519 | 4.6% |
[ 5.5% - 6.0% ] 5.64% | 2,233,717 | 4.2% |
[ 6.0% - 6.5% ] 6.00% | 699,004 | 4.4% |
[ 6.0% - 6.5% ] 6.39% | 1,024,719 | 3.6% |
[ 6.5% - 7.0% ] 6.77% | 1,053,586 | 4.4% |
[ 7.0% - 7.5% ] 7.15% | 1,037,902 | 3.8% |
[ 7.5% - 8.0% ] 7.62% | 677,466 | 3.7% |
[ 7.5% - 8.0% ] 7.99% | 975,234 | 3.1% |
[ 8.0% - 8.5% ] 8.40% | 837,865 | 4.0% |
[ 8.5% - 9.0% ] 8.75% | 292,178 | 3.6% |
[ 9.0% - 9.5% ] 9.04% | 670,744 | 3.7% |
[ 9.5% - 10.0% ] 9.56% | 426,209 | 4.1% |
[ 9.5% - 10.0% ] 9.88% | 605,605 | 3.9% |
[ 10.0% - 10.5% ] 10.25% | 272,827 | 4.1% |
[ 10.5% - 11.0% ] 10.70% | 344,810 | 4.3% |
[ 10.5% - 11.0% ] 10.99% | 435,582 | 2.9% |
[ 11.0% - 11.5% ] 11.41% | 529,269 | 3.3% |
[ 11.5% - 12.0% ] 11.81% | 164,665 | 5.0% |
[ 12.0% - 12.5% ] 12.35% | 1,056,987 | 3.2% |
[ 12.5% - 13.0% ] 12.68% | 388,969 | 3.2% |
[ 13.0% - 13.5% ] 13.06% | 273,045 | 5.9% |
[ 13.0% - 13.5% ] 13.39% | 360,552 | 2.7% |
[ 13.5% - 14.0% ] 13.86% | 120,353 | 2.3% |
[ 14.0% - 14.5% ] 14.27% | 47,202 | 3.1% |
[ 14.5% - 15.0% ] 14.63% | 93,103 | 3.7% |
[ 14.5% - 15.0% ] 14.93% | 110,434 | 2.8% |
[ 15.0% - 15.5% ] 15.43% | 33,715 | 8.1% |
[ 16.0% - 16.5% ] 16.11% | 183,427 | 3.3% |
[ 16.0% - 16.5% ] 16.37% | 22,996 | 4.9% |
[ 17.0% - 17.5% ] 17.19% | 148,790 | 1.5% |
[ 18.0% - 18.5% ] 18.02% | 110,950 | 2.7% |
[ 18.0% - 18.5% ] 18.40% | 312,200 | 2.9% |
[ 18.5% - 19.0% ] 18.92% | 110,416 | 3.0% |
[ 19.0% - 19.5% ] 19.18% | 235,005 | 2.2% |
[ 19.0% - 19.5% ] 19.44% | 45,650 | 2.8% |
[ 19.5% - 20.0% ] 19.85% | 131,923 | 3.6% |
[ 21.5% - 22.0% ] 21.65% | 89,075 | 2.8% |
[ 21.5% - 22.0% ] 21.87% | 143,740 | 4.6% |
[ 22.0% - 22.5% ] 22.31% | 102,223 | 2.6% |
[ 22.5% - 23.0% ] 22.68% | 85,306 | 3.9% |
[ 23.0% - 23.5% ] 23.13% | 24,169 | 1.5% |
[ 24.5% - 25.0% ] 24.65% | 76,518 | 4.0% |
[ 25.5% - 26.0% ] 25.74% | 134,385 | 3.1% |
[ 26.0% - 26.5% ] 26.09% | 151,983 | 3.8% |
[ 26.0% - 26.5% ] 26.46% | 28,212 | 1.8% |
[ 26.5% - 27.0% ] 26.87% | 68,923 | 4.8% |
[ 27.5% - 28.0% ] 27.63% | 36,165 | 3.0% |
[ 28.0% - 28.5% ] 28.13% | 37,340 | 2.3% |
[ 28.5% - 29.0% ] 28.66% | 52,268 | 2.4% |
[ 28.5% - 29.0% ] 28.73% | 87,947 | 3.6% |
[ 30.5% - 31.0% ] 30.51% | 25,460 | 4.4% |
[ 30.5% - 31.0% ] 30.69% | 61,340 | 2.8% |
[ 35.5% - 36.0% ] 35.57% | 12,070 | 1.3% |
[ 36.0% - 36.5% ] 36.36% | 25,001 | 0.35% |
[ 36.5% - 37.0% ] 36.69% | 26,418 | 1.9% |
[ 39.0% - 39.5% ] 39.16% | 53,371 | 0.75% |
[ 46.0% - 46.5% ] 46.27% | 79,495 | 2.0% |