Hopi Disability Age 5 to 17

COMPARE

Hopi
Race
Ancestry
AfghanAfricanAlaska NativeAlaskan AthabascanAlbanianAleutAlsatianAmericanApacheArabArapahoArgentineanArmenianAssyrian/Chaldean/SyriacAustralianAustrianBahamianBangladeshiBarbadianBasqueBelgianBelizeanBermudanBhutaneseBlackfeetBolivianBrazilianBritishBritish West IndianBulgarianBurmeseCajunCambodianCanadianCape VerdeanCarpatho RusynCelticCentral AmericanCentral American IndianCherokeeCheyenneChickasawChileanChineseChippewaChoctawColombianColvilleComancheCosta RicanCreeCreekCroatianCrowCubanCypriotCzechCzechoslovakianDanishDelawareDominicanDutchDutch West IndianEastern EuropeanEcuadorianEgyptianEnglishEstonianEthiopianEuropeanFijianFilipinoFinnishFrenchFrench American IndianFrench CanadianGermanGerman RussianGhanaianGreekGuamanian/ChamorroGuatemalanGuyaneseHaitianHmongHonduranHopiHoumaHungarianIcelanderIndian (Asian)IndonesianInupiatIranianIraqiIrishIroquoisIsraeliItalianJamaicanJapaneseJordanianKenyanKiowaKoreanLaotianLatvianLebaneseLiberianLithuanianLumbeeLuxembourgerMacedonianMalaysianMalteseMarshalleseMenomineeMexicanMexican American IndianMongolianMoroccanNative HawaiianNavajoNepaleseNew ZealanderNicaraguanNigerianNorthern EuropeanNorwegianOkinawanOsageOttawaPaiutePakistaniPalestinianPanamanianParaguayanPennsylvania GermanPeruvianPimaPolishPortuguesePotawatomiPuebloPuerto RicanPuget Sound SalishRomanianRussianSalvadoranSamoanScandinavianScotch-IrishScottishSeminoleSenegaleseSerbianShoshoneSierra LeoneanSiouxSlavicSlovakSloveneSomaliSouth AfricanSouth AmericanSouth American IndianSoviet UnionSpaniardSpanishSpanish AmericanSpanish American IndianSri LankanSubsaharan AfricanSudaneseSwedishSwissSyrianTaiwaneseThaiTlingit-HaidaTohono O'OdhamTonganTrinidadian and TobagonianTsimshianTurkishU.S. Virgin IslanderUgandanUkrainianUruguayanUteVenezuelanVietnameseWelshWest IndianYakamaYaquiYugoslavianYumanYup'ikZimbabwean
Immigration
NonimmigrantsImmigrantsAfghanistanAfricaAlbaniaArgentinaArmeniaAsiaAustraliaAustriaBahamasBangladeshBarbadosBelarusBelgiumBelizeBoliviaBosnia and HerzegovinaBrazilBulgariaBurma/MyanmarCabo VerdeCambodiaCameroonCanadaCaribbeanCentral AmericaChileChinaColombiaCongoCosta RicaCroatiaCubaCzechoslovakiaDenmarkDominicaDominican RepublicEastern AfricaEastern AsiaEastern EuropeEcuadorEgyptEl SalvadorEnglandEritreaEthiopiaEuropeFijiFranceGermanyGhanaGreeceGrenadaGuatemalaGuyanaHaitiHondurasHong KongHungaryIndiaIndonesiaIranIraqIrelandIsraelItalyJamaicaJapanJordanKazakhstanKenyaKoreaKuwaitLaosLatin AmericaLatviaLebanonLiberiaLithuaniaMalaysiaMexicoMicronesiaMiddle AfricaMoldovaMoroccoNepalNetherlandsNicaraguaNigeriaNorth AmericaNorth MacedoniaNorthern AfricaNorthern EuropeNorwayOceaniaPakistanPanamaPeruPhilippinesPolandPortugalRomaniaRussiaSaudi ArabiaScotlandSenegalSerbiaSierra LeoneSingaporeSomaliaSouth AfricaSouth AmericaSouth Central AsiaSouth Eastern AsiaSouthern EuropeSpainSri LankaSt. Vincent and the GrenadinesSudanSwedenSwitzerlandSyriaTaiwanThailandTrinidad and TobagoTurkeyUgandaUkraineUruguayUzbekistanVenezuelaVietnamWest IndiesWestern AfricaWestern AsiaWestern EuropeYemenZaireZimbabweAzores
Select to Compare
Race
Ancestry
AfghanAfricanAlaska NativeAlaskan AthabascanAlbanianAleutAlsatianAmericanApacheArabArapahoArgentineanArmenianAssyrian/Chaldean/SyriacAustralianAustrianBahamianBangladeshiBarbadianBasqueBelgianBelizeanBermudanBhutaneseBlackfeetBolivianBrazilianBritishBritish West IndianBulgarianBurmeseCajunCambodianCanadianCape VerdeanCarpatho RusynCelticCentral AmericanCentral American IndianCherokeeCheyenneChickasawChileanChineseChippewaChoctawColombianColvilleComancheCosta RicanCreeCreekCroatianCrowCubanCypriotCzechCzechoslovakianDanishDelawareDominicanDutchDutch West IndianEastern EuropeanEcuadorianEgyptianEnglishEstonianEthiopianEuropeanFijianFilipinoFinnishFrenchFrench American IndianFrench CanadianGermanGerman RussianGhanaianGreekGuamanian/ChamorroGuatemalanGuyaneseHaitianHmongHonduranHoumaHungarianIcelanderIndian (Asian)IndonesianInupiatIranianIraqiIrishIroquoisIsraeliItalianJamaicanJapaneseJordanianKenyanKiowaKoreanLaotianLatvianLebaneseLiberianLithuanianLumbeeLuxembourgerMacedonianMalaysianMalteseMarshalleseMenomineeMexicanMexican American IndianMongolianMoroccanNative HawaiianNavajoNepaleseNew ZealanderNicaraguanNigerianNorthern EuropeanNorwegianOkinawanOsageOttawaPaiutePakistaniPalestinianPanamanianParaguayanPennsylvania GermanPeruvianPimaPolishPortuguesePotawatomiPuebloPuerto RicanPuget Sound SalishRomanianRussianSalvadoranSamoanScandinavianScotch-IrishScottishSeminoleSenegaleseSerbianShoshoneSierra LeoneanSiouxSlavicSlovakSloveneSomaliSouth AfricanSouth AmericanSouth American IndianSoviet UnionSpaniardSpanishSpanish AmericanSpanish American IndianSri LankanSubsaharan AfricanSudaneseSwedishSwissSyrianTaiwaneseThaiTlingit-HaidaTohono O'OdhamTonganTrinidadian and TobagonianTsimshianTurkishU.S. Virgin IslanderUgandanUkrainianUruguayanUteVenezuelanVietnameseWelshWest IndianYakamaYaquiYugoslavianYumanYup'ikZimbabwean
Immigration
NonimmigrantsImmigrantsAfghanistanAfricaAlbaniaArgentinaArmeniaAsiaAustraliaAustriaBahamasBangladeshBarbadosBelarusBelgiumBelizeBoliviaBosnia and HerzegovinaBrazilBulgariaBurma/MyanmarCabo VerdeCambodiaCameroonCanadaCaribbeanCentral AmericaChileChinaColombiaCongoCosta RicaCroatiaCubaCzechoslovakiaDenmarkDominicaDominican RepublicEastern AfricaEastern AsiaEastern EuropeEcuadorEgyptEl SalvadorEnglandEritreaEthiopiaEuropeFijiFranceGermanyGhanaGreeceGrenadaGuatemalaGuyanaHaitiHondurasHong KongHungaryIndiaIndonesiaIranIraqIrelandIsraelItalyJamaicaJapanJordanKazakhstanKenyaKoreaKuwaitLaosLatin AmericaLatviaLebanonLiberiaLithuaniaMalaysiaMexicoMicronesiaMiddle AfricaMoldovaMoroccoNepalNetherlandsNicaraguaNigeriaNorth AmericaNorth MacedoniaNorthern AfricaNorthern EuropeNorwayOceaniaPakistanPanamaPeruPhilippinesPolandPortugalRomaniaRussiaSaudi ArabiaScotlandSenegalSerbiaSierra LeoneSingaporeSomaliaSouth AfricaSouth AmericaSouth Central AsiaSouth Eastern AsiaSouthern EuropeSpainSri LankaSt. Vincent and the GrenadinesSudanSwedenSwitzerlandSyriaTaiwanThailandTrinidad and TobagoTurkeyUgandaUkraineUruguayUzbekistanVenezuelaVietnamWest IndiesWestern AfricaWestern AsiaWestern EuropeYemenZaireZimbabweAzores
Disability Age 5 to 17
Income
Poverty
Unemployment
Labor Participation
Family Structure
Vehicle Availability
Education Level
Disability

Hopi Disability Age 5 to 17
Tragic

5.9%
DISABILITY | AGE 5 TO 17
1.0/ 100
METRIC RATING
256th/ 347
METRIC RANK

Hopi Disability Age 5 to 17 Correlation Chart

The statistical analysis conducted on geographies consisting of 74,609,437 people shows a poor positive correlation between the proportion of Hopi and percentage of population with a disability between the ages 5 and 17 in the United States with a correlation coefficient (R) of 0.159 and weighted average of 5.9%. On average, for every 1% (one percent) increase in Hopi within a typical geography, there is an increase of 0.015% in percentage of population with a disability between the ages 5 and 17.
Hopi Disability Age 5 to 17
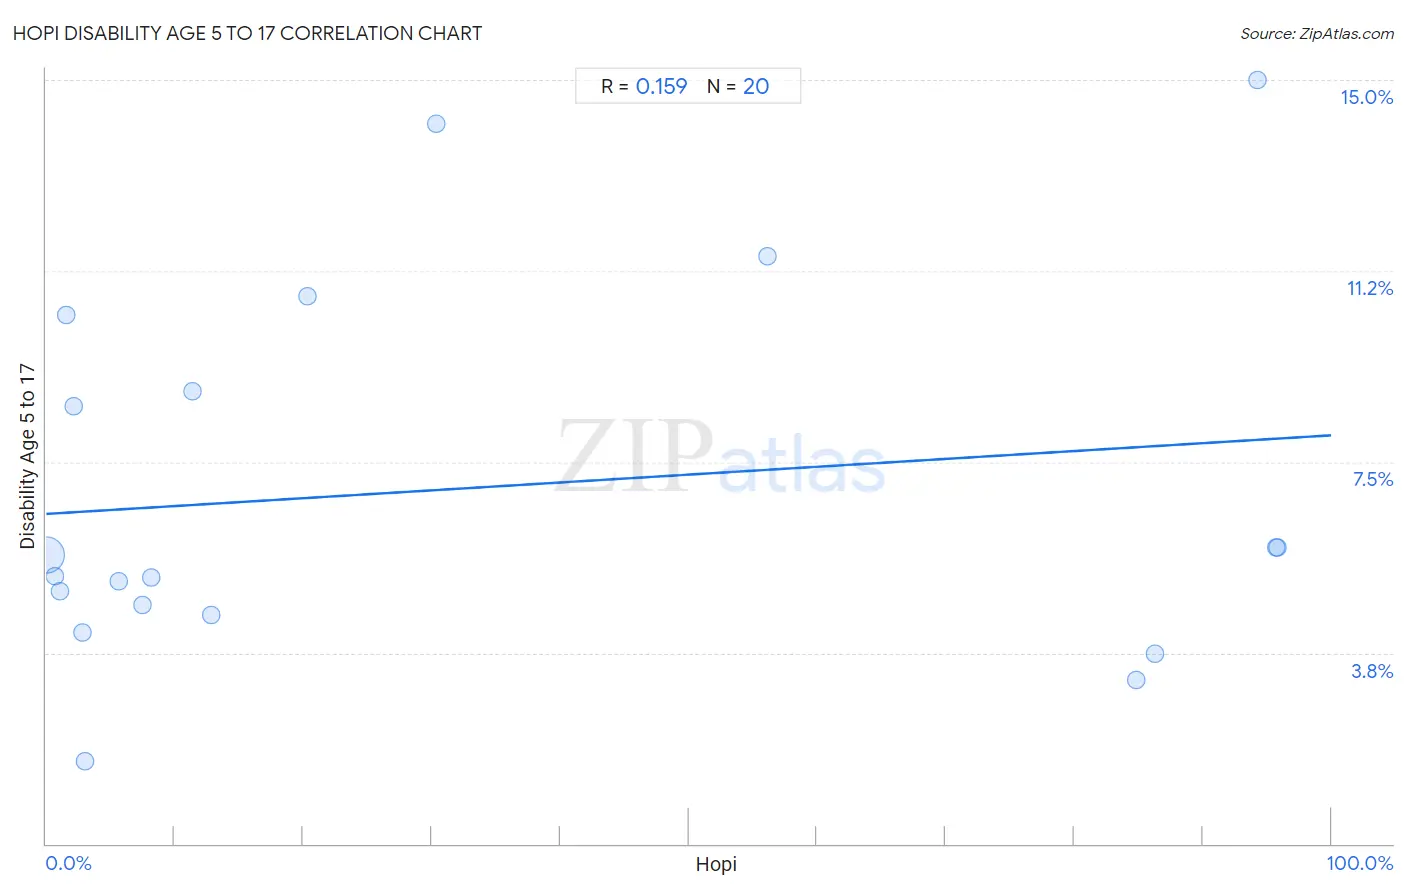
It is essential to understand that the correlation between the percentage of Hopi and percentage of population with a disability between the ages 5 and 17 does not imply a direct cause-and-effect relationship. It remains uncertain whether the presence of Hopi influences an upward or downward trend in the level of percentage of population with a disability between the ages 5 and 17 within an area, or if Hopi simply ended up residing in those areas with higher or lower levels of percentage of population with a disability between the ages 5 and 17 due to other factors.

Demographics Similar to Hopi by Disability Age 5 to 17

In terms of disability age 5 to 17, the demographic groups most similar to Hopi are Hispanic or Latino (5.9%, a difference of 0.090%), Brazilian (5.9%, a difference of 0.13%), Slavic (5.9%, a difference of 0.18%), Italian (5.9%, a difference of 0.20%), and Barbadian (5.9%, a difference of 0.27%).
DemographicsRating | RankDisability Age 5 to 17
Immigrants from Ghana
1.7
/100
|
#249
Tragic
5.9%
Poles
1.5
/100
|
#250
Tragic
5.9%
Immigrants from Cambodia
1.5
/100
|
#251
Tragic
5.9%
Hondurans
1.5
/100
|
#252
Tragic
5.9%
Scandinavians
1.4
/100
|
#253
Tragic
5.9%
Barbadians
1.3
/100
|
#254
Tragic
5.9%
Italians
1.2
/100
|
#255
Tragic
5.9%
Hopi
1.0
/100
|
#256
Tragic
5.9%
Hispanics or Latinos
1.0
/100
|
#257
Tragic
5.9%
Brazilians
0.9
/100
|
#258
Tragic
5.9%
Slavs
0.9
/100
|
#259
Tragic
5.9%
Somalis
0.8
/100
|
#260
Tragic
5.9%
Immigrants from Middle Africa
0.7
/100
|
#261
Tragic
5.9%
Immigrants from Western Africa
0.7
/100
|
#262
Tragic
5.9%
Czechoslovakians
0.7
/100
|
#263
Tragic
5.9%

Hopi Disability Age 5 to 17 Correlation Summary

MeasurementHopi DataDisability Age 5 to 17 Data
Minimum0.030%1.6%
Maximum95.9%15.0%
Range95.8%13.4%
Mean31.0%7.0%
Median9.8%5.5%
Interquartile 25% (IQ1)2.4%4.6%
Interquartile 75% (IQ3)70.5%9.6%
Interquartile Range (IQR)68.0%5.0%
Standard Deviation (Sample)38.1%3.7%
Standard Deviation (Population)37.1%3.6%

Correlation Details

Hopi PercentileSample SizeDisability Age 5 to 17
[
0.0%
-
0.5%
]
0.030%
73,859,5825.7%
[
0.5%
-
1.0%
]
0.66%
415,7695.3%
[
1.0%
-
1.5%
]
1.09%
200,6015.0%
[
1.5%
-
2.0%
]
1.58%
44,07710.4%
[
2.0%
-
2.5%
]
2.09%
21,6798.6%
[
2.5%
-
3.0%
]
2.78%
19,4644.2%
[
3.0%
-
3.5%
]
3.01%
6,9191.6%
[
5.5%
-
6.0%
]
5.63%
8,3725.1%
[
7.0%
-
7.5%
]
7.49%
5,3174.7%
[
8.0%
-
8.5%
]
8.22%
4,8425.2%
[
11.0%
-
11.5%
]
11.37%
2118.9%
[
12.5%
-
13.0%
]
12.87%
11,1544.5%
[
20.0%
-
20.5%
]
20.32%
3,91810.8%
[
30.0%
-
30.5%
]
30.32%
34314.2%
[
56.0%
-
56.5%
]
56.12%
1,50411.5%
[
84.5%
-
85.0%
]
84.79%
1,9663.2%
[
86.0%
-
86.5%
]
86.24%
1,4543.7%
[
94.0%
-
94.5%
]
94.25%
88715.0%
[
95.5%
-
96.0%
]
95.72%
6785.8%
[
95.5%
-
96.0%
]
95.86%
7005.8%