Ecuadorian Disability Age 5 to 17
COMPARE
Ecuadorian
Select to Compare
Disability Age 5 to 17
Ecuadorian Disability Age 5 to 17
5.5%
DISABILITY | AGE 5 TO 17
79.7/ 100
METRIC RATING
153rd/ 347
METRIC RANK
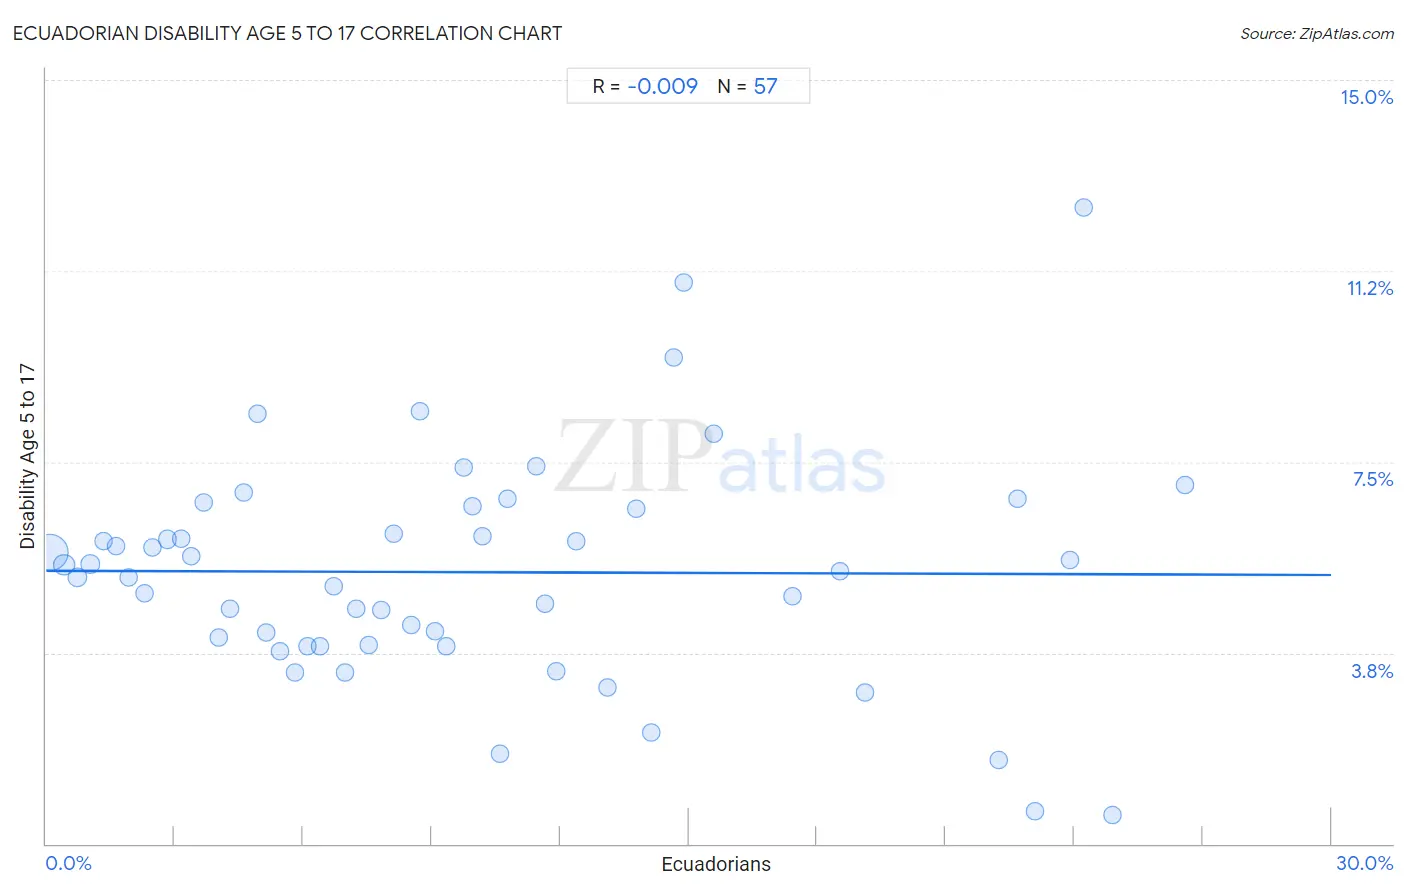
Ecuadorian Disability Age 5 to 17 Correlation Chart
The statistical analysis conducted on geographies consisting of 315,899,023 people shows no correlation between the proportion of Ecuadorians and percentage of population with a disability between the ages 5 and 17 in the United States with a correlation coefficient (R) of -0.009 and weighted average of 5.5%. On average, for every 1% (one percent) increase in Ecuadorians within a typical geography, there is a decrease of 0.0027% in percentage of population with a disability between the ages 5 and 17.
It is essential to understand that the correlation between the percentage of Ecuadorians and percentage of population with a disability between the ages 5 and 17 does not imply a direct cause-and-effect relationship. It remains uncertain whether the presence of Ecuadorians influences an upward or downward trend in the level of percentage of population with a disability between the ages 5 and 17 within an area, or if Ecuadorians simply ended up residing in those areas with higher or lower levels of percentage of population with a disability between the ages 5 and 17 due to other factors.
Demographics Similar to Ecuadorians by Disability Age 5 to 17
In terms of disability age 5 to 17, the demographic groups most similar to Ecuadorians are Ute (5.5%, a difference of 0.070%), Australian (5.5%, a difference of 0.070%), Estonian (5.5%, a difference of 0.080%), Immigrants from Ecuador (5.5%, a difference of 0.11%), and Hawaiian (5.5%, a difference of 0.13%).
| Demographics | Rating | Rank | Disability Age 5 to 17 |
| Albanians | 83.7 /100 | #146 | Excellent 5.5% |
| Immigrants from Albania | 83.1 /100 | #147 | Excellent 5.5% |
| Samoans | 81.9 /100 | #148 | Excellent 5.5% |
| Central Americans | 81.6 /100 | #149 | Excellent 5.5% |
| Guatemalans | 81.5 /100 | #150 | Excellent 5.5% |
| Estonians | 80.8 /100 | #151 | Excellent 5.5% |
| Ute | 80.6 /100 | #152 | Excellent 5.5% |
| Ecuadorians | 79.7 /100 | #153 | Good 5.5% |
| Australians | 78.8 /100 | #154 | Good 5.5% |
| Immigrants from Ecuador | 78.3 /100 | #155 | Good 5.5% |
| Hawaiians | 78.0 /100 | #156 | Good 5.5% |
| Immigrants from Costa Rica | 77.9 /100 | #157 | Good 5.5% |
| Immigrants from Nepal | 77.1 /100 | #158 | Good 5.5% |
| Immigrants from Zimbabwe | 75.3 /100 | #159 | Good 5.5% |
| South Africans | 73.3 /100 | #160 | Good 5.5% |
Ecuadorian Disability Age 5 to 17 Correlation Summary
| Measurement | Ecuadorian Data | Disability Age 5 to 17 Data |
| Minimum | 0.10% | 0.57% |
| Maximum | 26.6% | 12.5% |
| Range | 26.5% | 11.9% |
| Mean | 9.8% | 5.3% |
| Median | 8.5% | 5.4% |
| Interquartile 25% (IQ1) | 4.2% | 3.9% |
| Interquartile 75% (IQ3) | 13.9% | 6.6% |
| Interquartile Range (IQR) | 9.8% | 2.7% |
| Standard Deviation (Sample) | 7.1% | 2.2% |
| Standard Deviation (Population) | 7.1% | 2.2% |
Correlation Details
| Ecuadorian Percentile | Sample Size | Disability Age 5 to 17 |
[ 0.0% - 0.5% ] 0.10% | 225,112,041 | 5.7% |
[ 0.0% - 0.5% ] 0.42% | 35,004,318 | 5.5% |
[ 0.5% - 1.0% ] 0.74% | 18,079,509 | 5.2% |
[ 1.0% - 1.5% ] 1.03% | 7,816,024 | 5.5% |
[ 1.0% - 1.5% ] 1.33% | 4,744,154 | 5.9% |
[ 1.5% - 2.0% ] 1.64% | 3,828,456 | 5.8% |
[ 1.5% - 2.0% ] 1.93% | 1,886,136 | 5.2% |
[ 2.0% - 2.5% ] 2.29% | 10,110,061 | 4.9% |
[ 2.0% - 2.5% ] 2.49% | 1,853,392 | 5.8% |
[ 2.5% - 3.0% ] 2.82% | 1,004,977 | 6.0% |
[ 3.0% - 3.5% ] 3.16% | 997,689 | 6.0% |
[ 3.0% - 3.5% ] 3.39% | 697,292 | 5.6% |
[ 3.5% - 4.0% ] 3.68% | 270,555 | 6.7% |
[ 4.0% - 4.5% ] 4.04% | 205,454 | 4.1% |
[ 4.0% - 4.5% ] 4.28% | 369,136 | 4.6% |
[ 4.5% - 5.0% ] 4.62% | 286,854 | 6.9% |
[ 4.5% - 5.0% ] 4.94% | 74,254 | 8.4% |
[ 5.0% - 5.5% ] 5.13% | 292,360 | 4.1% |
[ 5.0% - 5.5% ] 5.45% | 96,507 | 3.8% |
[ 5.5% - 6.0% ] 5.79% | 75,504 | 3.4% |
[ 6.0% - 6.5% ] 6.10% | 158,067 | 3.9% |
[ 6.0% - 6.5% ] 6.41% | 105,683 | 3.9% |
[ 6.5% - 7.0% ] 6.71% | 196,892 | 5.1% |
[ 6.5% - 7.0% ] 6.96% | 100,875 | 3.4% |
[ 7.0% - 7.5% ] 7.25% | 221,846 | 4.6% |
[ 7.5% - 8.0% ] 7.52% | 181,924 | 3.9% |
[ 7.5% - 8.0% ] 7.83% | 150,353 | 4.6% |
[ 8.0% - 8.5% ] 8.12% | 106,593 | 6.1% |
[ 8.5% - 9.0% ] 8.53% | 155,339 | 4.3% |
[ 8.5% - 9.0% ] 8.72% | 334,815 | 8.5% |
[ 9.0% - 9.5% ] 9.07% | 31,554 | 4.2% |
[ 9.0% - 9.5% ] 9.34% | 12,343 | 3.9% |
[ 9.5% - 10.0% ] 9.74% | 50,351 | 7.4% |
[ 9.5% - 10.0% ] 9.96% | 219,557 | 6.6% |
[ 10.0% - 10.5% ] 10.20% | 32,963 | 6.0% |
[ 10.5% - 11.0% ] 10.58% | 91,516 | 1.8% |
[ 10.5% - 11.0% ] 10.78% | 86,456 | 6.8% |
[ 11.0% - 11.5% ] 11.43% | 22,800 | 7.4% |
[ 11.5% - 12.0% ] 11.65% | 127,356 | 4.7% |
[ 11.5% - 12.0% ] 11.90% | 111,707 | 3.4% |
[ 12.0% - 12.5% ] 12.37% | 100,539 | 5.9% |
[ 13.0% - 13.5% ] 13.11% | 9,461 | 3.1% |
[ 13.5% - 14.0% ] 13.78% | 108,046 | 6.6% |
[ 14.0% - 14.5% ] 14.12% | 70,070 | 2.2% |
[ 14.5% - 15.0% ] 14.65% | 42,547 | 9.6% |
[ 14.5% - 15.0% ] 14.89% | 27,708 | 11.0% |
[ 15.5% - 16.0% ] 15.59% | 9,126 | 8.0% |
[ 17.0% - 17.5% ] 17.43% | 11,777 | 4.9% |
[ 18.5% - 19.0% ] 18.55% | 275 | 5.4% |
[ 19.0% - 19.5% ] 19.11% | 21,040 | 3.0% |
[ 22.0% - 22.5% ] 22.25% | 5,164 | 1.7% |
[ 22.5% - 23.0% ] 22.68% | 5,587 | 6.8% |
[ 23.0% - 23.5% ] 23.08% | 1,005 | 0.64% |
[ 23.5% - 24.0% ] 23.90% | 112,750 | 5.6% |
[ 24.0% - 24.5% ] 24.24% | 56,696 | 12.5% |
[ 24.5% - 25.0% ] 24.90% | 9,162 | 0.57% |
[ 26.5% - 27.0% ] 26.59% | 4,407 | 7.0% |