Tlingit-Haida Female Poverty

COMPARE

Tlingit-Haida
Race
Ancestry
AfghanAfricanAlaska NativeAlaskan AthabascanAlbanianAleutAlsatianAmericanApacheArabArapahoArgentineanArmenianAssyrian/Chaldean/SyriacAustralianAustrianBahamianBangladeshiBarbadianBasqueBelgianBelizeanBermudanBhutaneseBlackfeetBolivianBrazilianBritishBritish West IndianBulgarianBurmeseCajunCambodianCanadianCape VerdeanCarpatho RusynCelticCentral AmericanCentral American IndianCherokeeCheyenneChickasawChileanChineseChippewaChoctawColombianColvilleComancheCosta RicanCreeCreekCroatianCrowCubanCypriotCzechCzechoslovakianDanishDelawareDominicanDutchDutch West IndianEastern EuropeanEcuadorianEgyptianEnglishEstonianEthiopianEuropeanFijianFilipinoFinnishFrenchFrench American IndianFrench CanadianGermanGerman RussianGhanaianGreekGuamanian/ChamorroGuatemalanGuyaneseHaitianHmongHonduranHopiHoumaHungarianIcelanderIndian (Asian)IndonesianInupiatIranianIraqiIrishIroquoisIsraeliItalianJamaicanJapaneseJordanianKenyanKiowaKoreanLaotianLatvianLebaneseLiberianLithuanianLumbeeLuxembourgerMacedonianMalaysianMalteseMarshalleseMenomineeMexicanMexican American IndianMongolianMoroccanNative HawaiianNavajoNepaleseNew ZealanderNicaraguanNigerianNorthern EuropeanNorwegianOkinawanOsageOttawaPaiutePakistaniPalestinianPanamanianParaguayanPennsylvania GermanPeruvianPimaPolishPortuguesePotawatomiPuebloPuerto RicanPuget Sound SalishRomanianRussianSalvadoranSamoanScandinavianScotch-IrishScottishSeminoleSenegaleseSerbianShoshoneSierra LeoneanSiouxSlavicSlovakSloveneSomaliSouth AfricanSouth AmericanSouth American IndianSoviet UnionSpaniardSpanishSpanish AmericanSpanish American IndianSri LankanSubsaharan AfricanSudaneseSwedishSwissSyrianTaiwaneseThaiTlingit-HaidaTohono O'OdhamTonganTrinidadian and TobagonianTsimshianTurkishU.S. Virgin IslanderUgandanUkrainianUruguayanUteVenezuelanVietnameseWelshWest IndianYakamaYaquiYugoslavianYumanYup'ikZimbabwean
Immigration
NonimmigrantsImmigrantsAfghanistanAfricaAlbaniaArgentinaArmeniaAsiaAustraliaAustriaBahamasBangladeshBarbadosBelarusBelgiumBelizeBoliviaBosnia and HerzegovinaBrazilBulgariaBurma/MyanmarCabo VerdeCambodiaCameroonCanadaCaribbeanCentral AmericaChileChinaColombiaCongoCosta RicaCroatiaCubaCzechoslovakiaDenmarkDominicaDominican RepublicEastern AfricaEastern AsiaEastern EuropeEcuadorEgyptEl SalvadorEnglandEritreaEthiopiaEuropeFijiFranceGermanyGhanaGreeceGrenadaGuatemalaGuyanaHaitiHondurasHong KongHungaryIndiaIndonesiaIranIraqIrelandIsraelItalyJamaicaJapanJordanKazakhstanKenyaKoreaKuwaitLaosLatin AmericaLatviaLebanonLiberiaLithuaniaMalaysiaMexicoMicronesiaMiddle AfricaMoldovaMoroccoNepalNetherlandsNicaraguaNigeriaNorth AmericaNorth MacedoniaNorthern AfricaNorthern EuropeNorwayOceaniaPakistanPanamaPeruPhilippinesPolandPortugalRomaniaRussiaSaudi ArabiaScotlandSenegalSerbiaSierra LeoneSingaporeSomaliaSouth AfricaSouth AmericaSouth Central AsiaSouth Eastern AsiaSouthern EuropeSpainSri LankaSt. Vincent and the GrenadinesSudanSwedenSwitzerlandSyriaTaiwanThailandTrinidad and TobagoTurkeyUgandaUkraineUruguayUzbekistanVenezuelaVietnamWest IndiesWestern AfricaWestern AsiaWestern EuropeYemenZaireZimbabweAzores
Select to Compare
Race
Ancestry
AfghanAfricanAlaska NativeAlaskan AthabascanAlbanianAleutAlsatianAmericanApacheArabArapahoArgentineanArmenianAssyrian/Chaldean/SyriacAustralianAustrianBahamianBangladeshiBarbadianBasqueBelgianBelizeanBermudanBhutaneseBlackfeetBolivianBrazilianBritishBritish West IndianBulgarianBurmeseCajunCambodianCanadianCape VerdeanCarpatho RusynCelticCentral AmericanCentral American IndianCherokeeCheyenneChickasawChileanChineseChippewaChoctawColombianColvilleComancheCosta RicanCreeCreekCroatianCrowCubanCypriotCzechCzechoslovakianDanishDelawareDominicanDutchDutch West IndianEastern EuropeanEcuadorianEgyptianEnglishEstonianEthiopianEuropeanFijianFilipinoFinnishFrenchFrench American IndianFrench CanadianGermanGerman RussianGhanaianGreekGuamanian/ChamorroGuatemalanGuyaneseHaitianHmongHonduranHopiHoumaHungarianIcelanderIndian (Asian)IndonesianInupiatIranianIraqiIrishIroquoisIsraeliItalianJamaicanJapaneseJordanianKenyanKiowaKoreanLaotianLatvianLebaneseLiberianLithuanianLumbeeLuxembourgerMacedonianMalaysianMalteseMarshalleseMenomineeMexicanMexican American IndianMongolianMoroccanNative HawaiianNavajoNepaleseNew ZealanderNicaraguanNigerianNorthern EuropeanNorwegianOkinawanOsageOttawaPaiutePakistaniPalestinianPanamanianParaguayanPennsylvania GermanPeruvianPimaPolishPortuguesePotawatomiPuebloPuerto RicanPuget Sound SalishRomanianRussianSalvadoranSamoanScandinavianScotch-IrishScottishSeminoleSenegaleseSerbianShoshoneSierra LeoneanSiouxSlavicSlovakSloveneSomaliSouth AfricanSouth AmericanSouth American IndianSoviet UnionSpaniardSpanishSpanish AmericanSpanish American IndianSri LankanSubsaharan AfricanSudaneseSwedishSwissSyrianTaiwaneseThaiTohono O'OdhamTonganTrinidadian and TobagonianTsimshianTurkishU.S. Virgin IslanderUgandanUkrainianUruguayanUteVenezuelanVietnameseWelshWest IndianYakamaYaquiYugoslavianYumanYup'ikZimbabwean
Immigration
NonimmigrantsImmigrantsAfghanistanAfricaAlbaniaArgentinaArmeniaAsiaAustraliaAustriaBahamasBangladeshBarbadosBelarusBelgiumBelizeBoliviaBosnia and HerzegovinaBrazilBulgariaBurma/MyanmarCabo VerdeCambodiaCameroonCanadaCaribbeanCentral AmericaChileChinaColombiaCongoCosta RicaCroatiaCubaCzechoslovakiaDenmarkDominicaDominican RepublicEastern AfricaEastern AsiaEastern EuropeEcuadorEgyptEl SalvadorEnglandEritreaEthiopiaEuropeFijiFranceGermanyGhanaGreeceGrenadaGuatemalaGuyanaHaitiHondurasHong KongHungaryIndiaIndonesiaIranIraqIrelandIsraelItalyJamaicaJapanJordanKazakhstanKenyaKoreaKuwaitLaosLatin AmericaLatviaLebanonLiberiaLithuaniaMalaysiaMexicoMicronesiaMiddle AfricaMoldovaMoroccoNepalNetherlandsNicaraguaNigeriaNorth AmericaNorth MacedoniaNorthern AfricaNorthern EuropeNorwayOceaniaPakistanPanamaPeruPhilippinesPolandPortugalRomaniaRussiaSaudi ArabiaScotlandSenegalSerbiaSierra LeoneSingaporeSomaliaSouth AfricaSouth AmericaSouth Central AsiaSouth Eastern AsiaSouthern EuropeSpainSri LankaSt. Vincent and the GrenadinesSudanSwedenSwitzerlandSyriaTaiwanThailandTrinidad and TobagoTurkeyUgandaUkraineUruguayUzbekistanVenezuelaVietnamWest IndiesWestern AfricaWestern AsiaWestern EuropeYemenZaireZimbabweAzores
Female Poverty
Income
Poverty
Unemployment
Labor Participation
Family Structure
Vehicle Availability
Education Level
Disability

Tlingit-Haida Female Poverty
Exceptional

12.5%
POVERTY | FEMALES
94.8/ 100
METRIC RATING
101st/ 347
METRIC RANK

Tlingit-Haida Female Poverty Correlation Chart

The statistical analysis conducted on geographies consisting of 60,854,909 people shows a weak positive correlation between the proportion of Tlingit-Haida and poverty level among females in the United States with a correlation coefficient (R) of 0.293 and weighted average of 12.5%. On average, for every 1% (one percent) increase in Tlingit-Haida within a typical geography, there is an increase of 0.097% in poverty level among females.
Tlingit-Haida Female Poverty
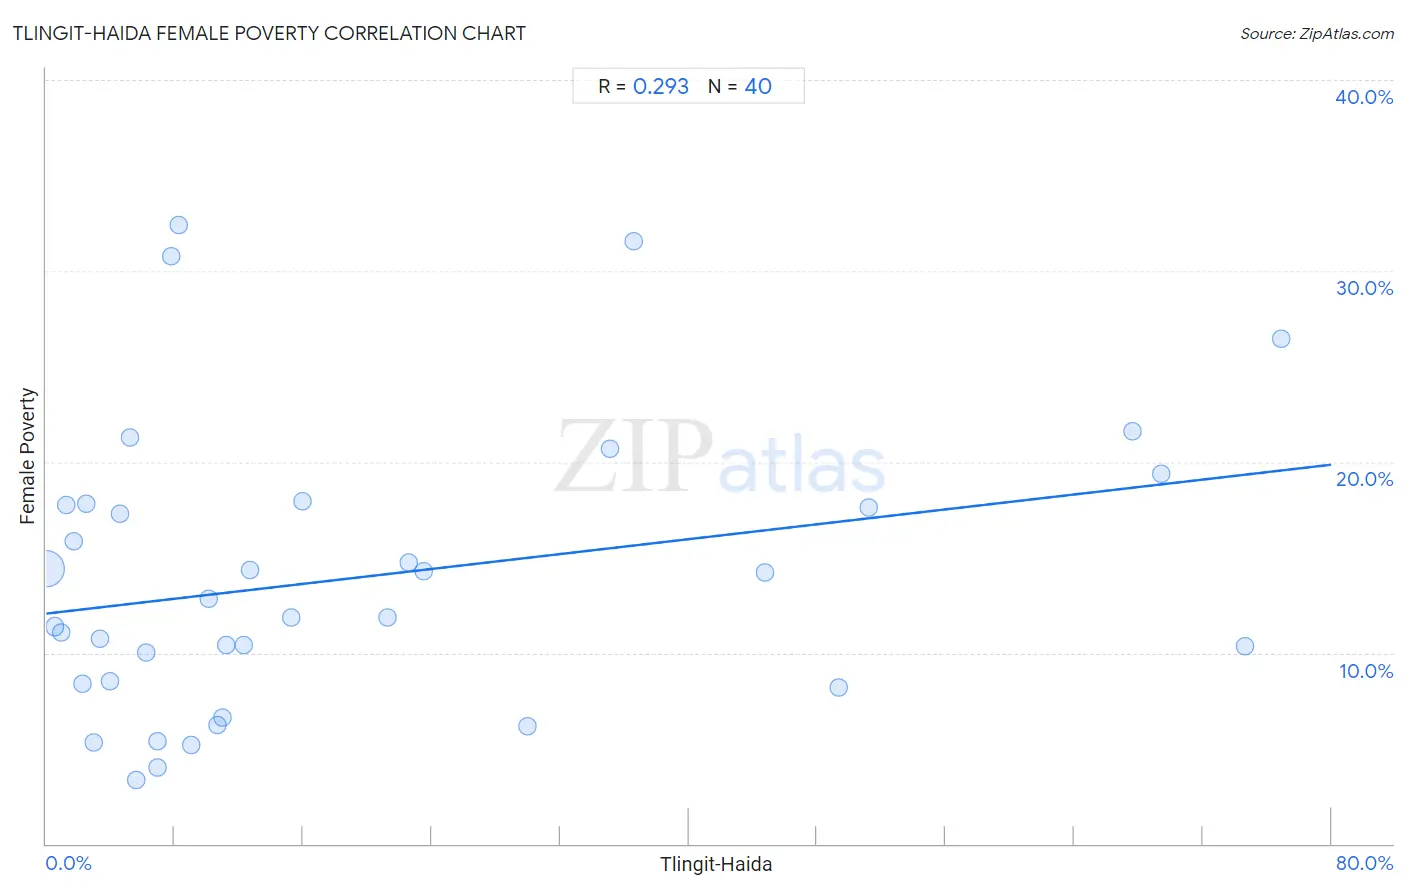
It is essential to understand that the correlation between the percentage of Tlingit-Haida and poverty level among females does not imply a direct cause-and-effect relationship. It remains uncertain whether the presence of Tlingit-Haida influences an upward or downward trend in the level of poverty level among females within an area, or if Tlingit-Haida simply ended up residing in those areas with higher or lower levels of poverty level among females due to other factors.

Demographics Similar to Tlingit-Haida by Female Poverty

In terms of female poverty, the demographic groups most similar to Tlingit-Haida are Immigrants from Latvia (12.5%, a difference of 0.0%), Romanian (12.5%, a difference of 0.15%), Immigrants from China (12.5%, a difference of 0.15%), Native Hawaiian (12.5%, a difference of 0.17%), and Slavic (12.5%, a difference of 0.17%).
DemographicsRating | RankFemale Poverty
Immigrants from Indonesia
95.4
/100
|
#94
Exceptional
12.5%
Immigrants from South Africa
95.4
/100
|
#95
Exceptional
12.5%
British
95.2
/100
|
#96
Exceptional
12.5%
Australians
95.2
/100
|
#97
Exceptional
12.5%
Native Hawaiians
95.1
/100
|
#98
Exceptional
12.5%
Romanians
95.1
/100
|
#99
Exceptional
12.5%
Immigrants from Latvia
94.8
/100
|
#100
Exceptional
12.5%
Tlingit-Haida
94.8
/100
|
#101
Exceptional
12.5%
Immigrants from China
94.5
/100
|
#102
Exceptional
12.5%
Slavs
94.5
/100
|
#103
Exceptional
12.5%
Palestinians
94.3
/100
|
#104
Exceptional
12.5%
Scottish
94.1
/100
|
#105
Exceptional
12.5%
Immigrants from Turkey
93.8
/100
|
#106
Exceptional
12.6%
Laotians
93.4
/100
|
#107
Exceptional
12.6%
Portuguese
93.1
/100
|
#108
Exceptional
12.6%

Tlingit-Haida Female Poverty Correlation Summary

MeasurementTlingit-Haida DataFemale Poverty Data
Minimum0.036%3.4%
Maximum76.8%32.4%
Range76.8%29.1%
Mean19.5%14.0%
Median10.4%12.3%
Interquartile 25% (IQ1)4.3%8.4%
Interquartile 75% (IQ3)26.7%17.8%
Interquartile Range (IQR)22.4%9.3%
Standard Deviation (Sample)22.3%7.4%
Standard Deviation (Population)22.0%7.3%

Correlation Details

Tlingit-Haida PercentileSample SizeFemale Poverty
[
0.0%
-
0.5%
]
0.036%
59,016,73514.4%
[
0.5%
-
1.0%
]
0.54%
1,312,33911.4%
[
0.5%
-
1.0%
]
0.91%
247,81811.1%
[
1.0%
-
1.5%
]
1.24%
85,68717.8%
[
1.5%
-
2.0%
]
1.71%
25,68515.8%
[
2.0%
-
2.5%
]
2.28%
8,4478.4%
[
2.0%
-
2.5%
]
2.46%
3,65517.8%
[
2.5%
-
3.0%
]
2.92%
6,2315.3%
[
3.0%
-
3.5%
]
3.33%
10,32610.7%
[
3.5%
-
4.0%
]
3.97%
1,9648.5%
[
4.5%
-
5.0%
]
4.62%
82217.3%
[
5.0%
-
5.5%
]
5.24%
42021.3%
[
5.5%
-
6.0%
]
5.62%
1,7623.4%
[
6.0%
-
6.5%
]
6.21%
17710.0%
[
6.5%
-
7.0%
]
6.91%
5645.3%
[
6.5%
-
7.0%
]
6.94%
2,1464.0%
[
7.5%
-
8.0%
]
7.80%
1,25730.7%
[
8.0%
-
8.5%
]
8.22%
14632.4%
[
8.5%
-
9.0%
]
9.00%
6,6915.2%
[
10.0%
-
10.5%
]
10.13%
2,90212.8%
[
10.5%
-
11.0%
]
10.70%
29,9336.2%
[
11.0%
-
11.5%
]
11.00%
32,1086.6%
[
11.0%
-
11.5%
]
11.18%
13,91310.4%
[
12.0%
-
12.5%
]
12.26%
18,04110.4%
[
12.5%
-
13.0%
]
12.67%
8,16814.3%
[
15.0%
-
15.5%
]
15.26%
2,16911.8%
[
15.5%
-
16.0%
]
15.92%
1,72718.0%
[
21.0%
-
21.5%
]
21.23%
4,26711.9%
[
22.5%
-
23.0%
]
22.55%
1,07314.7%
[
23.5%
-
24.0%
]
23.53%
8514.3%
[
29.5%
-
30.0%
]
29.96%
1,1286.1%
[
35.0%
-
35.5%
]
35.09%
5720.7%
[
36.5%
-
37.0%
]
36.59%
8231.6%
[
44.5%
-
45.0%
]
44.78%
92014.2%
[
49.0%
-
49.5%
]
49.33%
1,7928.2%
[
51.0%
-
51.5%
]
51.24%
80417.6%
[
67.5%
-
68.0%
]
67.59%
36121.6%
[
69.0%
-
69.5%
]
69.41%
1,60219.4%
[
74.5%
-
75.0%
]
74.63%
6710.3%
[
76.5%
-
77.0%
]
76.85%
83826.4%