Immigrants from Zaire Disability Age 5 to 17

COMPARE

Immigrants from Zaire
Race
Ancestry
AfghanAfricanAlaska NativeAlaskan AthabascanAlbanianAleutAlsatianAmericanApacheArabArapahoArgentineanArmenianAssyrian/Chaldean/SyriacAustralianAustrianBahamianBangladeshiBarbadianBasqueBelgianBelizeanBermudanBhutaneseBlackfeetBolivianBrazilianBritishBritish West IndianBulgarianBurmeseCajunCambodianCanadianCape VerdeanCarpatho RusynCelticCentral AmericanCentral American IndianCherokeeCheyenneChickasawChileanChineseChippewaChoctawColombianColvilleComancheCosta RicanCreeCreekCroatianCrowCubanCypriotCzechCzechoslovakianDanishDelawareDominicanDutchDutch West IndianEastern EuropeanEcuadorianEgyptianEnglishEstonianEthiopianEuropeanFijianFilipinoFinnishFrenchFrench American IndianFrench CanadianGermanGerman RussianGhanaianGreekGuamanian/ChamorroGuatemalanGuyaneseHaitianHmongHonduranHopiHoumaHungarianIcelanderIndian (Asian)IndonesianInupiatIranianIraqiIrishIroquoisIsraeliItalianJamaicanJapaneseJordanianKenyanKiowaKoreanLaotianLatvianLebaneseLiberianLithuanianLumbeeLuxembourgerMacedonianMalaysianMalteseMarshalleseMenomineeMexicanMexican American IndianMongolianMoroccanNative HawaiianNavajoNepaleseNew ZealanderNicaraguanNigerianNorthern EuropeanNorwegianOkinawanOsageOttawaPaiutePakistaniPalestinianPanamanianParaguayanPennsylvania GermanPeruvianPimaPolishPortuguesePotawatomiPuebloPuerto RicanPuget Sound SalishRomanianRussianSalvadoranSamoanScandinavianScotch-IrishScottishSeminoleSenegaleseSerbianShoshoneSierra LeoneanSiouxSlavicSlovakSloveneSomaliSouth AfricanSouth AmericanSouth American IndianSoviet UnionSpaniardSpanishSpanish AmericanSpanish American IndianSri LankanSubsaharan AfricanSudaneseSwedishSwissSyrianTaiwaneseThaiTlingit-HaidaTohono O'OdhamTonganTrinidadian and TobagonianTsimshianTurkishU.S. Virgin IslanderUgandanUkrainianUruguayanUteVenezuelanVietnameseWelshWest IndianYakamaYaquiYugoslavianYumanYup'ikZimbabwean
Immigration
NonimmigrantsImmigrantsAfghanistanAfricaAlbaniaArgentinaArmeniaAsiaAustraliaAustriaBahamasBangladeshBarbadosBelarusBelgiumBelizeBoliviaBosnia and HerzegovinaBrazilBulgariaBurma/MyanmarCabo VerdeCambodiaCameroonCanadaCaribbeanCentral AmericaChileChinaColombiaCongoCosta RicaCroatiaCubaCzechoslovakiaDenmarkDominicaDominican RepublicEastern AfricaEastern AsiaEastern EuropeEcuadorEgyptEl SalvadorEnglandEritreaEthiopiaEuropeFijiFranceGermanyGhanaGreeceGrenadaGuatemalaGuyanaHaitiHondurasHong KongHungaryIndiaIndonesiaIranIraqIrelandIsraelItalyJamaicaJapanJordanKazakhstanKenyaKoreaKuwaitLaosLatin AmericaLatviaLebanonLiberiaLithuaniaMalaysiaMexicoMicronesiaMiddle AfricaMoldovaMoroccoNepalNetherlandsNicaraguaNigeriaNorth AmericaNorth MacedoniaNorthern AfricaNorthern EuropeNorwayOceaniaPakistanPanamaPeruPhilippinesPolandPortugalRomaniaRussiaSaudi ArabiaScotlandSenegalSerbiaSierra LeoneSingaporeSomaliaSouth AfricaSouth AmericaSouth Central AsiaSouth Eastern AsiaSouthern EuropeSpainSri LankaSt. Vincent and the GrenadinesSudanSwedenSwitzerlandSyriaTaiwanThailandTrinidad and TobagoTurkeyUgandaUkraineUruguayUzbekistanVenezuelaVietnamWest IndiesWestern AfricaWestern AsiaWestern EuropeYemenZaireZimbabweAzores
Select to Compare
Race
Ancestry
AfghanAfricanAlaska NativeAlaskan AthabascanAlbanianAleutAlsatianAmericanApacheArabArapahoArgentineanArmenianAssyrian/Chaldean/SyriacAustralianAustrianBahamianBangladeshiBarbadianBasqueBelgianBelizeanBermudanBhutaneseBlackfeetBolivianBrazilianBritishBritish West IndianBulgarianBurmeseCajunCambodianCanadianCape VerdeanCarpatho RusynCelticCentral AmericanCentral American IndianCherokeeCheyenneChickasawChileanChineseChippewaChoctawColombianColvilleComancheCosta RicanCreeCreekCroatianCrowCubanCypriotCzechCzechoslovakianDanishDelawareDominicanDutchDutch West IndianEastern EuropeanEcuadorianEgyptianEnglishEstonianEthiopianEuropeanFijianFilipinoFinnishFrenchFrench American IndianFrench CanadianGermanGerman RussianGhanaianGreekGuamanian/ChamorroGuatemalanGuyaneseHaitianHmongHonduranHopiHoumaHungarianIcelanderIndian (Asian)IndonesianInupiatIranianIraqiIrishIroquoisIsraeliItalianJamaicanJapaneseJordanianKenyanKiowaKoreanLaotianLatvianLebaneseLiberianLithuanianLumbeeLuxembourgerMacedonianMalaysianMalteseMarshalleseMenomineeMexicanMexican American IndianMongolianMoroccanNative HawaiianNavajoNepaleseNew ZealanderNicaraguanNigerianNorthern EuropeanNorwegianOkinawanOsageOttawaPaiutePakistaniPalestinianPanamanianParaguayanPennsylvania GermanPeruvianPimaPolishPortuguesePotawatomiPuebloPuerto RicanPuget Sound SalishRomanianRussianSalvadoranSamoanScandinavianScotch-IrishScottishSeminoleSenegaleseSerbianShoshoneSierra LeoneanSiouxSlavicSlovakSloveneSomaliSouth AfricanSouth AmericanSouth American IndianSoviet UnionSpaniardSpanishSpanish AmericanSpanish American IndianSri LankanSubsaharan AfricanSudaneseSwedishSwissSyrianTaiwaneseThaiTlingit-HaidaTohono O'OdhamTonganTrinidadian and TobagonianTsimshianTurkishU.S. Virgin IslanderUgandanUkrainianUruguayanUteVenezuelanVietnameseWelshWest IndianYakamaYaquiYugoslavianYumanYup'ikZimbabwean
Immigration
NonimmigrantsImmigrantsAfghanistanAfricaAlbaniaArgentinaArmeniaAsiaAustraliaAustriaBahamasBangladeshBarbadosBelarusBelgiumBelizeBoliviaBosnia and HerzegovinaBrazilBulgariaBurma/MyanmarCabo VerdeCambodiaCameroonCanadaCaribbeanCentral AmericaChileChinaColombiaCongoCosta RicaCroatiaCubaCzechoslovakiaDenmarkDominicaDominican RepublicEastern AfricaEastern AsiaEastern EuropeEcuadorEgyptEl SalvadorEnglandEritreaEthiopiaEuropeFijiFranceGermanyGhanaGreeceGrenadaGuatemalaGuyanaHaitiHondurasHong KongHungaryIndiaIndonesiaIranIraqIrelandIsraelItalyJamaicaJapanJordanKazakhstanKenyaKoreaKuwaitLaosLatin AmericaLatviaLebanonLiberiaLithuaniaMalaysiaMexicoMicronesiaMiddle AfricaMoldovaMoroccoNepalNetherlandsNicaraguaNigeriaNorth AmericaNorth MacedoniaNorthern AfricaNorthern EuropeNorwayOceaniaPakistanPanamaPeruPhilippinesPolandPortugalRomaniaRussiaSaudi ArabiaScotlandSenegalSerbiaSierra LeoneSingaporeSomaliaSouth AfricaSouth AmericaSouth Central AsiaSouth Eastern AsiaSouthern EuropeSpainSri LankaSt. Vincent and the GrenadinesSudanSwedenSwitzerlandSyriaTaiwanThailandTrinidad and TobagoTurkeyUgandaUkraineUruguayUzbekistanVenezuelaVietnamWest IndiesWestern AfricaWestern AsiaWestern EuropeYemenZimbabweAzores
Disability Age 5 to 17
Income
Poverty
Unemployment
Labor Participation
Family Structure
Vehicle Availability
Education Level
Disability

Immigrants from Zaire Disability Age 5 to 17
Tragic

6.0%
DISABILITY | AGE 5 TO 17
0.2/ 100
METRIC RATING
271st/ 347
METRIC RANK

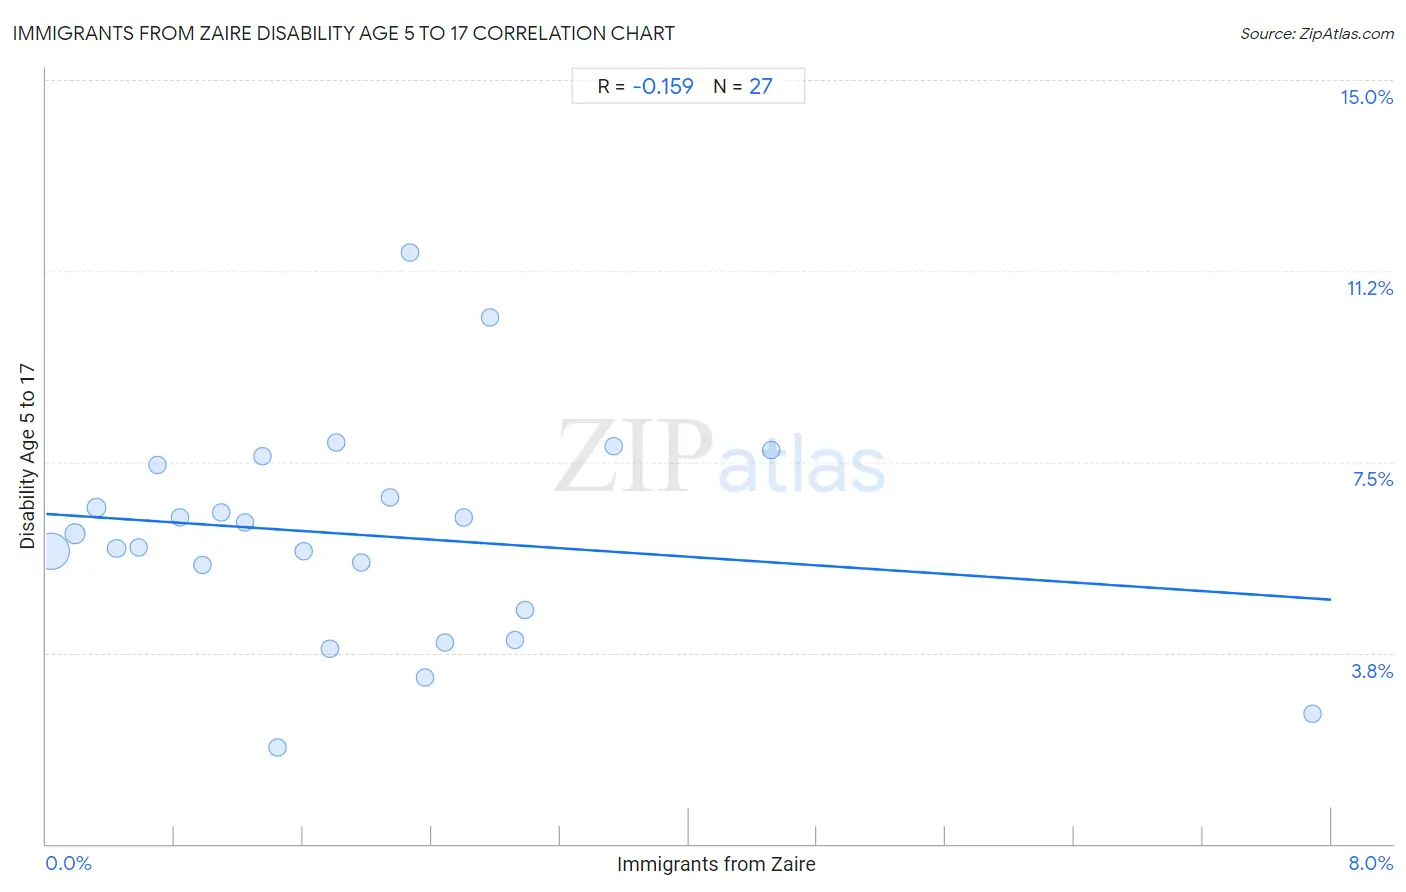
Immigrants from Zaire Disability Age 5 to 17 Correlation Chart

The statistical analysis conducted on geographies consisting of 107,054,393 people shows a poor negative correlation between the proportion of Immigrants from Zaire and percentage of population with a disability between the ages 5 and 17 in the United States with a correlation coefficient (R) of -0.159 and weighted average of 6.0%. On average, for every 1% (one percent) increase in Immigrants from Zaire within a typical geography, there is a decrease of 0.21% in percentage of population with a disability between the ages 5 and 17.
Immigrants from Zaire Disability Age 5 to 17
It is essential to understand that the correlation between the percentage of Immigrants from Zaire and percentage of population with a disability between the ages 5 and 17 does not imply a direct cause-and-effect relationship. It remains uncertain whether the presence of Immigrants from Zaire influences an upward or downward trend in the level of percentage of population with a disability between the ages 5 and 17 within an area, or if Immigrants from Zaire simply ended up residing in those areas with higher or lower levels of percentage of population with a disability between the ages 5 and 17 due to other factors.

Demographics Similar to Immigrants from Zaire by Disability Age 5 to 17

In terms of disability age 5 to 17, the demographic groups most similar to Immigrants from Zaire are Finnish (6.0%, a difference of 0.030%), Alaska Native (6.0%, a difference of 0.080%), Cheyenne (6.0%, a difference of 0.19%), Dutch (6.0%, a difference of 0.30%), and Japanese (6.1%, a difference of 0.40%).
DemographicsRating | RankDisability Age 5 to 17
Canadians
0.6
/100
|
#264
Tragic
6.0%
Panamanians
0.6
/100
|
#265
Tragic
6.0%
Slovenes
0.6
/100
|
#266
Tragic
6.0%
Spanish
0.5
/100
|
#267
Tragic
6.0%
Sioux
0.4
/100
|
#268
Tragic
6.0%
Liberians
0.4
/100
|
#269
Tragic
6.0%
Immigrants from Somalia
0.4
/100
|
#270
Tragic
6.0%
Immigrants from Zaire
0.2
/100
|
#271
Tragic
6.0%
Finns
0.2
/100
|
#272
Tragic
6.0%
Alaska Natives
0.2
/100
|
#273
Tragic
6.0%
Cheyenne
0.2
/100
|
#274
Tragic
6.0%
Dutch
0.2
/100
|
#275
Tragic
6.0%
Japanese
0.1
/100
|
#276
Tragic
6.1%
Puget Sound Salish
0.1
/100
|
#277
Tragic
6.1%
Immigrants from Liberia
0.1
/100
|
#278
Tragic
6.1%

Immigrants from Zaire Disability Age 5 to 17 Correlation Summary

MeasurementImmigrants from Zaire DataDisability Age 5 to 17 Data
Minimum0.034%1.9%
Maximum7.9%11.6%
Range7.8%9.7%
Mean2.0%6.1%
Median1.8%6.1%
Interquartile 25% (IQ1)0.83%4.6%
Interquartile 75% (IQ3)2.6%7.4%
Interquartile Range (IQR)1.8%2.8%
Standard Deviation (Sample)1.6%2.1%
Standard Deviation (Population)1.6%2.1%

Correlation Details

Immigrants from Zaire PercentileSample SizeDisability Age 5 to 17
[
0.0%
-
0.5%
]
0.034%
85,876,3935.8%
[
0.0%
-
0.5%
]
0.18%
11,550,3146.1%
[
0.0%
-
0.5%
]
0.31%
3,917,4066.6%
[
0.0%
-
0.5%
]
0.44%
2,397,4445.8%
[
0.5%
-
1.0%
]
0.58%
921,3395.8%
[
0.5%
-
1.0%
]
0.69%
445,4307.4%
[
0.5%
-
1.0%
]
0.83%
451,7876.4%
[
0.5%
-
1.0%
]
0.97%
318,0405.5%
[
1.0%
-
1.5%
]
1.09%
351,5806.5%
[
1.0%
-
1.5%
]
1.24%
175,7486.3%
[
1.0%
-
1.5%
]
1.34%
142,4687.6%
[
1.0%
-
1.5%
]
1.44%
48,3551.9%
[
1.5%
-
2.0%
]
1.61%
91,4935.8%
[
1.5%
-
2.0%
]
1.77%
2,7683.8%
[
1.5%
-
2.0%
]
1.81%
22,8607.9%
[
1.5%
-
2.0%
]
1.96%
49,1995.5%
[
2.0%
-
2.5%
]
2.14%
37,9266.8%
[
2.0%
-
2.5%
]
2.26%
20,81811.6%
[
2.0%
-
2.5%
]
2.36%
36,3903.3%
[
2.0%
-
2.5%
]
2.48%
63,3944.0%
[
2.5%
-
3.0%
]
2.60%
10,5366.4%
[
2.5%
-
3.0%
]
2.76%
72410.3%
[
2.5%
-
3.0%
]
2.92%
64,5184.0%
[
2.5%
-
3.0%
]
2.98%
8,6814.6%
[
3.5%
-
4.0%
]
3.54%
4,8097.8%
[
4.5%
-
5.0%
]
4.52%
43,1107.7%
[
7.5%
-
8.0%
]
7.88%
8632.6%