Tlingit-Haida College, Under 1 year

COMPARE

Tlingit-Haida
Race
Ancestry
AfghanAfricanAlaska NativeAlaskan AthabascanAlbanianAleutAlsatianAmericanApacheArabArapahoArgentineanArmenianAssyrian/Chaldean/SyriacAustralianAustrianBahamianBangladeshiBarbadianBasqueBelgianBelizeanBermudanBhutaneseBlackfeetBolivianBrazilianBritishBritish West IndianBulgarianBurmeseCajunCambodianCanadianCape VerdeanCarpatho RusynCelticCentral AmericanCentral American IndianCherokeeCheyenneChickasawChileanChineseChippewaChoctawColombianColvilleComancheCosta RicanCreeCreekCroatianCrowCubanCypriotCzechCzechoslovakianDanishDelawareDominicanDutchDutch West IndianEastern EuropeanEcuadorianEgyptianEnglishEstonianEthiopianEuropeanFijianFilipinoFinnishFrenchFrench American IndianFrench CanadianGermanGerman RussianGhanaianGreekGuamanian/ChamorroGuatemalanGuyaneseHaitianHmongHonduranHopiHoumaHungarianIcelanderIndian (Asian)IndonesianInupiatIranianIraqiIrishIroquoisIsraeliItalianJamaicanJapaneseJordanianKenyanKiowaKoreanLaotianLatvianLebaneseLiberianLithuanianLumbeeLuxembourgerMacedonianMalaysianMalteseMarshalleseMenomineeMexicanMexican American IndianMongolianMoroccanNative HawaiianNavajoNepaleseNew ZealanderNicaraguanNigerianNorthern EuropeanNorwegianOkinawanOsageOttawaPaiutePakistaniPalestinianPanamanianParaguayanPennsylvania GermanPeruvianPimaPolishPortuguesePotawatomiPuebloPuerto RicanPuget Sound SalishRomanianRussianSalvadoranSamoanScandinavianScotch-IrishScottishSeminoleSenegaleseSerbianShoshoneSierra LeoneanSiouxSlavicSlovakSloveneSomaliSouth AfricanSouth AmericanSouth American IndianSoviet UnionSpaniardSpanishSpanish AmericanSpanish American IndianSri LankanSubsaharan AfricanSudaneseSwedishSwissSyrianTaiwaneseThaiTlingit-HaidaTohono O'OdhamTonganTrinidadian and TobagonianTsimshianTurkishU.S. Virgin IslanderUgandanUkrainianUruguayanUteVenezuelanVietnameseWelshWest IndianYakamaYaquiYugoslavianYumanYup'ikZimbabwean
Immigration
NonimmigrantsImmigrantsAfghanistanAfricaAlbaniaArgentinaArmeniaAsiaAustraliaAustriaBahamasBangladeshBarbadosBelarusBelgiumBelizeBoliviaBosnia and HerzegovinaBrazilBulgariaBurma/MyanmarCabo VerdeCambodiaCameroonCanadaCaribbeanCentral AmericaChileChinaColombiaCongoCosta RicaCroatiaCubaCzechoslovakiaDenmarkDominicaDominican RepublicEastern AfricaEastern AsiaEastern EuropeEcuadorEgyptEl SalvadorEnglandEritreaEthiopiaEuropeFijiFranceGermanyGhanaGreeceGrenadaGuatemalaGuyanaHaitiHondurasHong KongHungaryIndiaIndonesiaIranIraqIrelandIsraelItalyJamaicaJapanJordanKazakhstanKenyaKoreaKuwaitLaosLatin AmericaLatviaLebanonLiberiaLithuaniaMalaysiaMexicoMicronesiaMiddle AfricaMoldovaMoroccoNepalNetherlandsNicaraguaNigeriaNorth AmericaNorth MacedoniaNorthern AfricaNorthern EuropeNorwayOceaniaPakistanPanamaPeruPhilippinesPolandPortugalRomaniaRussiaSaudi ArabiaScotlandSenegalSerbiaSierra LeoneSingaporeSomaliaSouth AfricaSouth AmericaSouth Central AsiaSouth Eastern AsiaSouthern EuropeSpainSri LankaSt. Vincent and the GrenadinesSudanSwedenSwitzerlandSyriaTaiwanThailandTrinidad and TobagoTurkeyUgandaUkraineUruguayUzbekistanVenezuelaVietnamWest IndiesWestern AfricaWestern AsiaWestern EuropeYemenZaireZimbabweAzores
Select to Compare
Race
Ancestry
AfghanAfricanAlaska NativeAlaskan AthabascanAlbanianAleutAlsatianAmericanApacheArabArapahoArgentineanArmenianAssyrian/Chaldean/SyriacAustralianAustrianBahamianBangladeshiBarbadianBasqueBelgianBelizeanBermudanBhutaneseBlackfeetBolivianBrazilianBritishBritish West IndianBulgarianBurmeseCajunCambodianCanadianCape VerdeanCarpatho RusynCelticCentral AmericanCentral American IndianCherokeeCheyenneChickasawChileanChineseChippewaChoctawColombianColvilleComancheCosta RicanCreeCreekCroatianCrowCubanCypriotCzechCzechoslovakianDanishDelawareDominicanDutchDutch West IndianEastern EuropeanEcuadorianEgyptianEnglishEstonianEthiopianEuropeanFijianFilipinoFinnishFrenchFrench American IndianFrench CanadianGermanGerman RussianGhanaianGreekGuamanian/ChamorroGuatemalanGuyaneseHaitianHmongHonduranHopiHoumaHungarianIcelanderIndian (Asian)IndonesianInupiatIranianIraqiIrishIroquoisIsraeliItalianJamaicanJapaneseJordanianKenyanKiowaKoreanLaotianLatvianLebaneseLiberianLithuanianLumbeeLuxembourgerMacedonianMalaysianMalteseMarshalleseMenomineeMexicanMexican American IndianMongolianMoroccanNative HawaiianNavajoNepaleseNew ZealanderNicaraguanNigerianNorthern EuropeanNorwegianOkinawanOsageOttawaPaiutePakistaniPalestinianPanamanianParaguayanPennsylvania GermanPeruvianPimaPolishPortuguesePotawatomiPuebloPuerto RicanPuget Sound SalishRomanianRussianSalvadoranSamoanScandinavianScotch-IrishScottishSeminoleSenegaleseSerbianShoshoneSierra LeoneanSiouxSlavicSlovakSloveneSomaliSouth AfricanSouth AmericanSouth American IndianSoviet UnionSpaniardSpanishSpanish AmericanSpanish American IndianSri LankanSubsaharan AfricanSudaneseSwedishSwissSyrianTaiwaneseThaiTohono O'OdhamTonganTrinidadian and TobagonianTsimshianTurkishU.S. Virgin IslanderUgandanUkrainianUruguayanUteVenezuelanVietnameseWelshWest IndianYakamaYaquiYugoslavianYumanYup'ikZimbabwean
Immigration
NonimmigrantsImmigrantsAfghanistanAfricaAlbaniaArgentinaArmeniaAsiaAustraliaAustriaBahamasBangladeshBarbadosBelarusBelgiumBelizeBoliviaBosnia and HerzegovinaBrazilBulgariaBurma/MyanmarCabo VerdeCambodiaCameroonCanadaCaribbeanCentral AmericaChileChinaColombiaCongoCosta RicaCroatiaCubaCzechoslovakiaDenmarkDominicaDominican RepublicEastern AfricaEastern AsiaEastern EuropeEcuadorEgyptEl SalvadorEnglandEritreaEthiopiaEuropeFijiFranceGermanyGhanaGreeceGrenadaGuatemalaGuyanaHaitiHondurasHong KongHungaryIndiaIndonesiaIranIraqIrelandIsraelItalyJamaicaJapanJordanKazakhstanKenyaKoreaKuwaitLaosLatin AmericaLatviaLebanonLiberiaLithuaniaMalaysiaMexicoMicronesiaMiddle AfricaMoldovaMoroccoNepalNetherlandsNicaraguaNigeriaNorth AmericaNorth MacedoniaNorthern AfricaNorthern EuropeNorwayOceaniaPakistanPanamaPeruPhilippinesPolandPortugalRomaniaRussiaSaudi ArabiaScotlandSenegalSerbiaSierra LeoneSingaporeSomaliaSouth AfricaSouth AmericaSouth Central AsiaSouth Eastern AsiaSouthern EuropeSpainSri LankaSt. Vincent and the GrenadinesSudanSwedenSwitzerlandSyriaTaiwanThailandTrinidad and TobagoTurkeyUgandaUkraineUruguayUzbekistanVenezuelaVietnamWest IndiesWestern AfricaWestern AsiaWestern EuropeYemenZaireZimbabweAzores
College, Under 1 year
Income
Poverty
Unemployment
Labor Participation
Family Structure
Vehicle Availability
Education Level
Disability

Tlingit-Haida College, Under 1 year
Good

65.9%
COLLEGE, UNDER 1 YEAR
66.4/ 100
METRIC RATING
159th/ 347
METRIC RANK

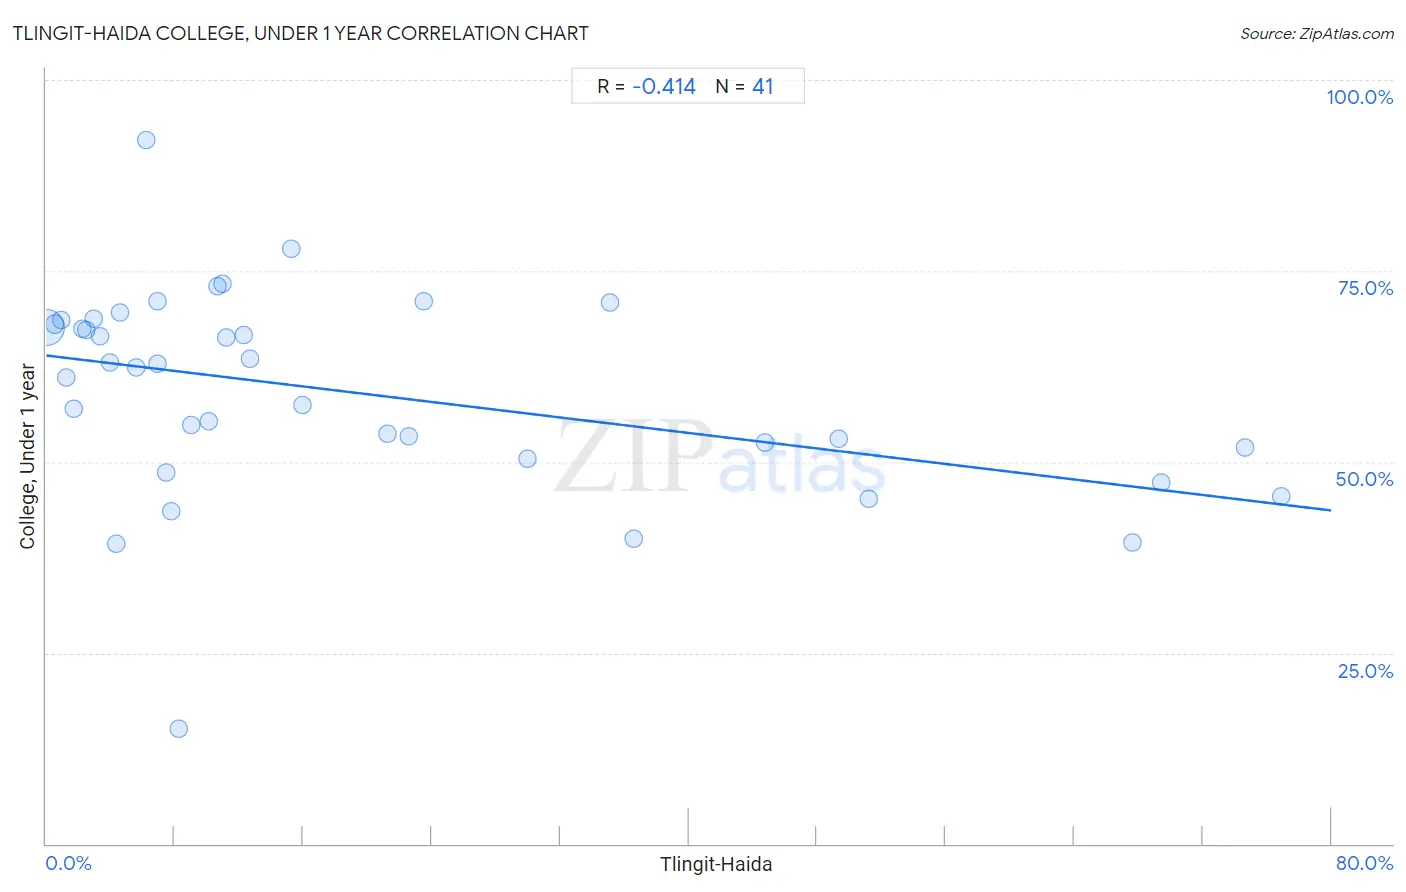
Tlingit-Haida College, Under 1 year Correlation Chart

The statistical analysis conducted on geographies consisting of 60,871,919 people shows a moderate negative correlation between the proportion of Tlingit-Haida and percentage of population with at least college, under 1 year education in the United States with a correlation coefficient (R) of -0.414 and weighted average of 65.9%. On average, for every 1% (one percent) increase in Tlingit-Haida within a typical geography, there is a decrease of 0.25% in percentage of population with at least college, under 1 year education.
Tlingit-Haida College, Under 1 year
It is essential to understand that the correlation between the percentage of Tlingit-Haida and percentage of population with at least college, under 1 year education does not imply a direct cause-and-effect relationship. It remains uncertain whether the presence of Tlingit-Haida influences an upward or downward trend in the level of percentage of population with at least college, under 1 year education within an area, or if Tlingit-Haida simply ended up residing in those areas with higher or lower levels of percentage of population with at least college, under 1 year education due to other factors.

Demographics Similar to Tlingit-Haida by College, Under 1 year

In terms of college, under 1 year, the demographic groups most similar to Tlingit-Haida are Albanian (65.9%, a difference of 0.010%), Brazilian (65.9%, a difference of 0.020%), Celtic (65.9%, a difference of 0.050%), Korean (65.9%, a difference of 0.050%), and Sierra Leonean (66.0%, a difference of 0.070%).
DemographicsRating | RankCollege, Under 1 year
Sudanese
74.1
/100
|
#152
Good
66.2%
Belgians
73.7
/100
|
#153
Good
66.2%
Immigrants from Eritrea
71.9
/100
|
#154
Good
66.1%
Irish
70.3
/100
|
#155
Good
66.0%
Welsh
69.9
/100
|
#156
Good
66.0%
Sierra Leoneans
67.8
/100
|
#157
Good
66.0%
Celtics
67.3
/100
|
#158
Good
65.9%
Tlingit-Haida
66.4
/100
|
#159
Good
65.9%
Albanians
66.1
/100
|
#160
Good
65.9%
Brazilians
66.0
/100
|
#161
Good
65.9%
Koreans
65.3
/100
|
#162
Good
65.9%
Somalis
62.7
/100
|
#163
Good
65.8%
Czechoslovakians
62.6
/100
|
#164
Good
65.8%
Immigrants from Uzbekistan
61.6
/100
|
#165
Good
65.8%
Moroccans
56.7
/100
|
#166
Average
65.6%

Tlingit-Haida College, Under 1 year Correlation Summary

MeasurementTlingit-Haida DataCollege, Under 1 year Data
Minimum0.036%15.0%
Maximum76.8%92.1%
Range76.8%77.1%
Mean19.2%59.1%
Median10.1%62.3%
Interquartile 25% (IQ1)4.2%51.2%
Interquartile 75% (IQ3)26.7%68.3%
Interquartile Range (IQR)22.6%17.2%
Standard Deviation (Sample)22.1%13.5%
Standard Deviation (Population)21.8%13.4%

Correlation Details

Tlingit-Haida PercentileSample SizeCollege, Under 1 year
[
0.0%
-
0.5%
]
0.036%
59,033,06267.6%
[
0.5%
-
1.0%
]
0.54%
1,312,33968.0%
[
0.5%
-
1.0%
]
0.91%
247,81868.6%
[
1.0%
-
1.5%
]
1.24%
85,68761.0%
[
1.5%
-
2.0%
]
1.71%
25,68556.9%
[
2.0%
-
2.5%
]
2.28%
8,44767.5%
[
2.0%
-
2.5%
]
2.46%
3,82167.2%
[
2.5%
-
3.0%
]
2.92%
6,47268.7%
[
3.0%
-
3.5%
]
3.33%
10,38866.4%
[
3.5%
-
4.0%
]
3.97%
1,96463.0%
[
4.0%
-
4.5%
]
4.35%
11539.3%
[
4.5%
-
5.0%
]
4.62%
82269.5%
[
5.5%
-
6.0%
]
5.62%
1,76262.3%
[
6.0%
-
6.5%
]
6.21%
17792.1%
[
6.5%
-
7.0%
]
6.91%
56471.0%
[
6.5%
-
7.0%
]
6.94%
2,14662.8%
[
7.0%
-
7.5%
]
7.50%
4048.6%
[
7.5%
-
8.0%
]
7.80%
1,25743.6%
[
8.0%
-
8.5%
]
8.22%
14615.0%
[
8.5%
-
9.0%
]
9.00%
6,69154.8%
[
10.0%
-
10.5%
]
10.13%
2,90255.2%
[
10.5%
-
11.0%
]
10.70%
29,93373.0%
[
11.0%
-
11.5%
]
11.00%
32,10873.3%
[
11.0%
-
11.5%
]
11.18%
13,91366.2%
[
12.0%
-
12.5%
]
12.26%
18,04166.5%
[
12.5%
-
13.0%
]
12.66%
8,64763.5%
[
15.0%
-
15.5%
]
15.26%
2,16977.9%
[
15.5%
-
16.0%
]
15.92%
1,72757.4%
[
21.0%
-
21.5%
]
21.23%
4,26753.7%
[
22.5%
-
23.0%
]
22.55%
1,07353.3%
[
23.5%
-
24.0%
]
23.53%
8571.1%
[
29.5%
-
30.0%
]
29.96%
1,12850.4%
[
35.0%
-
35.5%
]
35.09%
5770.8%
[
36.5%
-
37.0%
]
36.59%
8240.0%
[
44.5%
-
45.0%
]
44.78%
92052.5%
[
49.0%
-
49.5%
]
49.33%
1,79253.1%
[
51.0%
-
51.5%
]
51.24%
80445.1%
[
67.5%
-
68.0%
]
67.59%
36139.5%
[
69.0%
-
69.5%
]
69.41%
1,60247.3%
[
74.5%
-
75.0%
]
74.63%
6751.9%
[
76.5%
-
77.0%
]
76.85%
83845.5%