Tlingit-Haida Single Female Poverty

COMPARE

Tlingit-Haida
Race
Ancestry
AfghanAfricanAlaska NativeAlaskan AthabascanAlbanianAleutAlsatianAmericanApacheArabArapahoArgentineanArmenianAssyrian/Chaldean/SyriacAustralianAustrianBahamianBangladeshiBarbadianBasqueBelgianBelizeanBermudanBhutaneseBlackfeetBolivianBrazilianBritishBritish West IndianBulgarianBurmeseCajunCambodianCanadianCape VerdeanCarpatho RusynCelticCentral AmericanCentral American IndianCherokeeCheyenneChickasawChileanChineseChippewaChoctawColombianColvilleComancheCosta RicanCreeCreekCroatianCrowCubanCypriotCzechCzechoslovakianDanishDelawareDominicanDutchDutch West IndianEastern EuropeanEcuadorianEgyptianEnglishEstonianEthiopianEuropeanFijianFilipinoFinnishFrenchFrench American IndianFrench CanadianGermanGerman RussianGhanaianGreekGuamanian/ChamorroGuatemalanGuyaneseHaitianHmongHonduranHopiHoumaHungarianIcelanderIndian (Asian)IndonesianInupiatIranianIraqiIrishIroquoisIsraeliItalianJamaicanJapaneseJordanianKenyanKiowaKoreanLaotianLatvianLebaneseLiberianLithuanianLumbeeLuxembourgerMacedonianMalaysianMalteseMarshalleseMenomineeMexicanMexican American IndianMongolianMoroccanNative HawaiianNavajoNepaleseNew ZealanderNicaraguanNigerianNorthern EuropeanNorwegianOkinawanOsageOttawaPaiutePakistaniPalestinianPanamanianParaguayanPennsylvania GermanPeruvianPimaPolishPortuguesePotawatomiPuebloPuerto RicanPuget Sound SalishRomanianRussianSalvadoranSamoanScandinavianScotch-IrishScottishSeminoleSenegaleseSerbianShoshoneSierra LeoneanSiouxSlavicSlovakSloveneSomaliSouth AfricanSouth AmericanSouth American IndianSoviet UnionSpaniardSpanishSpanish AmericanSpanish American IndianSri LankanSubsaharan AfricanSudaneseSwedishSwissSyrianTaiwaneseThaiTlingit-HaidaTohono O'OdhamTonganTrinidadian and TobagonianTsimshianTurkishU.S. Virgin IslanderUgandanUkrainianUruguayanUteVenezuelanVietnameseWelshWest IndianYakamaYaquiYugoslavianYumanYup'ikZimbabwean
Immigration
NonimmigrantsImmigrantsAfghanistanAfricaAlbaniaArgentinaArmeniaAsiaAustraliaAustriaBahamasBangladeshBarbadosBelarusBelgiumBelizeBoliviaBosnia and HerzegovinaBrazilBulgariaBurma/MyanmarCabo VerdeCambodiaCameroonCanadaCaribbeanCentral AmericaChileChinaColombiaCongoCosta RicaCroatiaCubaCzechoslovakiaDenmarkDominicaDominican RepublicEastern AfricaEastern AsiaEastern EuropeEcuadorEgyptEl SalvadorEnglandEritreaEthiopiaEuropeFijiFranceGermanyGhanaGreeceGrenadaGuatemalaGuyanaHaitiHondurasHong KongHungaryIndiaIndonesiaIranIraqIrelandIsraelItalyJamaicaJapanJordanKazakhstanKenyaKoreaKuwaitLaosLatin AmericaLatviaLebanonLiberiaLithuaniaMalaysiaMexicoMicronesiaMiddle AfricaMoldovaMoroccoNepalNetherlandsNicaraguaNigeriaNorth AmericaNorth MacedoniaNorthern AfricaNorthern EuropeNorwayOceaniaPakistanPanamaPeruPhilippinesPolandPortugalRomaniaRussiaSaudi ArabiaScotlandSenegalSerbiaSierra LeoneSingaporeSomaliaSouth AfricaSouth AmericaSouth Central AsiaSouth Eastern AsiaSouthern EuropeSpainSri LankaSt. Vincent and the GrenadinesSudanSwedenSwitzerlandSyriaTaiwanThailandTrinidad and TobagoTurkeyUgandaUkraineUruguayUzbekistanVenezuelaVietnamWest IndiesWestern AfricaWestern AsiaWestern EuropeYemenZaireZimbabweAzores
Select to Compare
Race
Ancestry
AfghanAfricanAlaska NativeAlaskan AthabascanAlbanianAleutAlsatianAmericanApacheArabArapahoArgentineanArmenianAssyrian/Chaldean/SyriacAustralianAustrianBahamianBangladeshiBarbadianBasqueBelgianBelizeanBermudanBhutaneseBlackfeetBolivianBrazilianBritishBritish West IndianBulgarianBurmeseCajunCambodianCanadianCape VerdeanCarpatho RusynCelticCentral AmericanCentral American IndianCherokeeCheyenneChickasawChileanChineseChippewaChoctawColombianColvilleComancheCosta RicanCreeCreekCroatianCrowCubanCypriotCzechCzechoslovakianDanishDelawareDominicanDutchDutch West IndianEastern EuropeanEcuadorianEgyptianEnglishEstonianEthiopianEuropeanFijianFilipinoFinnishFrenchFrench American IndianFrench CanadianGermanGerman RussianGhanaianGreekGuamanian/ChamorroGuatemalanGuyaneseHaitianHmongHonduranHopiHoumaHungarianIcelanderIndian (Asian)IndonesianInupiatIranianIraqiIrishIroquoisIsraeliItalianJamaicanJapaneseJordanianKenyanKiowaKoreanLaotianLatvianLebaneseLiberianLithuanianLumbeeLuxembourgerMacedonianMalaysianMalteseMarshalleseMenomineeMexicanMexican American IndianMongolianMoroccanNative HawaiianNavajoNepaleseNew ZealanderNicaraguanNigerianNorthern EuropeanNorwegianOkinawanOsageOttawaPaiutePakistaniPalestinianPanamanianParaguayanPennsylvania GermanPeruvianPimaPolishPortuguesePotawatomiPuebloPuerto RicanPuget Sound SalishRomanianRussianSalvadoranSamoanScandinavianScotch-IrishScottishSeminoleSenegaleseSerbianShoshoneSierra LeoneanSiouxSlavicSlovakSloveneSomaliSouth AfricanSouth AmericanSouth American IndianSoviet UnionSpaniardSpanishSpanish AmericanSpanish American IndianSri LankanSubsaharan AfricanSudaneseSwedishSwissSyrianTaiwaneseThaiTohono O'OdhamTonganTrinidadian and TobagonianTsimshianTurkishU.S. Virgin IslanderUgandanUkrainianUruguayanUteVenezuelanVietnameseWelshWest IndianYakamaYaquiYugoslavianYumanYup'ikZimbabwean
Immigration
NonimmigrantsImmigrantsAfghanistanAfricaAlbaniaArgentinaArmeniaAsiaAustraliaAustriaBahamasBangladeshBarbadosBelarusBelgiumBelizeBoliviaBosnia and HerzegovinaBrazilBulgariaBurma/MyanmarCabo VerdeCambodiaCameroonCanadaCaribbeanCentral AmericaChileChinaColombiaCongoCosta RicaCroatiaCubaCzechoslovakiaDenmarkDominicaDominican RepublicEastern AfricaEastern AsiaEastern EuropeEcuadorEgyptEl SalvadorEnglandEritreaEthiopiaEuropeFijiFranceGermanyGhanaGreeceGrenadaGuatemalaGuyanaHaitiHondurasHong KongHungaryIndiaIndonesiaIranIraqIrelandIsraelItalyJamaicaJapanJordanKazakhstanKenyaKoreaKuwaitLaosLatin AmericaLatviaLebanonLiberiaLithuaniaMalaysiaMexicoMicronesiaMiddle AfricaMoldovaMoroccoNepalNetherlandsNicaraguaNigeriaNorth AmericaNorth MacedoniaNorthern AfricaNorthern EuropeNorwayOceaniaPakistanPanamaPeruPhilippinesPolandPortugalRomaniaRussiaSaudi ArabiaScotlandSenegalSerbiaSierra LeoneSingaporeSomaliaSouth AfricaSouth AmericaSouth Central AsiaSouth Eastern AsiaSouthern EuropeSpainSri LankaSt. Vincent and the GrenadinesSudanSwedenSwitzerlandSyriaTaiwanThailandTrinidad and TobagoTurkeyUgandaUkraineUruguayUzbekistanVenezuelaVietnamWest IndiesWestern AfricaWestern AsiaWestern EuropeYemenZaireZimbabweAzores
Single Female Poverty
Income
Poverty
Unemployment
Labor Participation
Family Structure
Vehicle Availability
Education Level
Disability

Tlingit-Haida Single Female Poverty
Tragic

21.9%
POVERTY | SINGLE FEMALES
5.4/ 100
METRIC RATING
229th/ 347
METRIC RANK

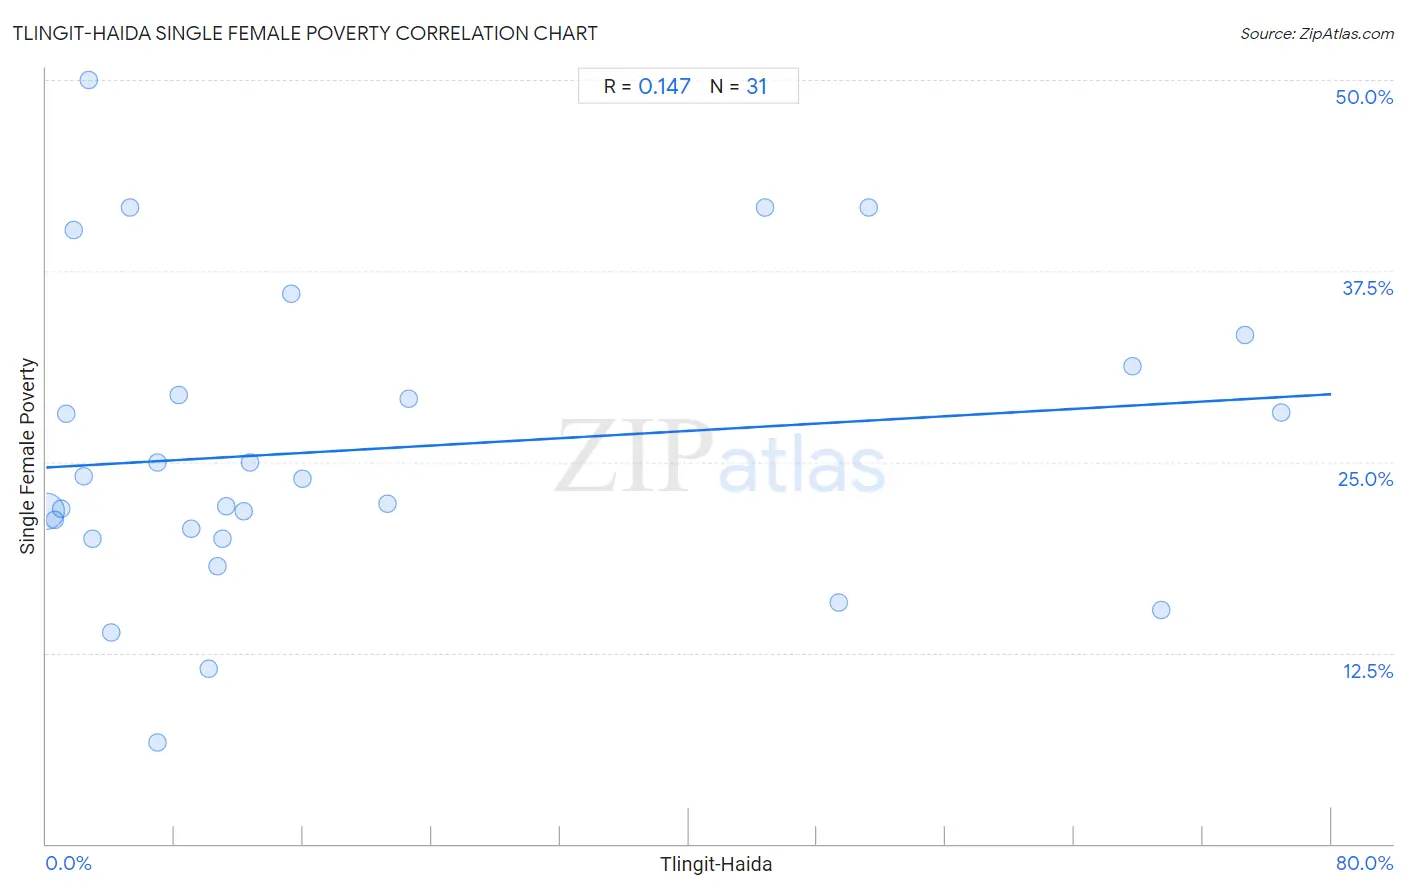
Tlingit-Haida Single Female Poverty Correlation Chart

The statistical analysis conducted on geographies consisting of 60,536,912 people shows a poor positive correlation between the proportion of Tlingit-Haida and poverty level among single females in the United States with a correlation coefficient (R) of 0.147 and weighted average of 21.9%. On average, for every 1% (one percent) increase in Tlingit-Haida within a typical geography, there is an increase of 0.060% in poverty level among single females.
Tlingit-Haida Single Female Poverty
It is essential to understand that the correlation between the percentage of Tlingit-Haida and poverty level among single females does not imply a direct cause-and-effect relationship. It remains uncertain whether the presence of Tlingit-Haida influences an upward or downward trend in the level of poverty level among single females within an area, or if Tlingit-Haida simply ended up residing in those areas with higher or lower levels of poverty level among single females due to other factors.

Demographics Similar to Tlingit-Haida by Single Female Poverty

In terms of single female poverty, the demographic groups most similar to Tlingit-Haida are Immigrants from Western Africa (22.0%, a difference of 0.020%), Salvadoran (21.9%, a difference of 0.030%), Welsh (22.0%, a difference of 0.11%), Immigrants from Ghana (21.9%, a difference of 0.12%), and Immigrants from Thailand (22.0%, a difference of 0.12%).
DemographicsRating | RankSingle Female Poverty
Immigrants from Eritrea
7.9
/100
|
#222
Tragic
21.8%
Scottish
7.3
/100
|
#223
Tragic
21.8%
Barbadians
7.2
/100
|
#224
Tragic
21.8%
English
6.4
/100
|
#225
Tragic
21.9%
Immigrants from Portugal
5.8
/100
|
#226
Tragic
21.9%
Immigrants from Ghana
5.8
/100
|
#227
Tragic
21.9%
Salvadorans
5.5
/100
|
#228
Tragic
21.9%
Tlingit-Haida
5.4
/100
|
#229
Tragic
21.9%
Immigrants from Western Africa
5.3
/100
|
#230
Tragic
22.0%
Welsh
5.0
/100
|
#231
Tragic
22.0%
Immigrants from Thailand
5.0
/100
|
#232
Tragic
22.0%
Spaniards
4.7
/100
|
#233
Tragic
22.0%
Spanish
4.7
/100
|
#234
Tragic
22.0%
Dutch
4.6
/100
|
#235
Tragic
22.0%
Immigrants from Ecuador
4.2
/100
|
#236
Tragic
22.0%

Tlingit-Haida Single Female Poverty Correlation Summary

MeasurementTlingit-Haida DataSingle Female Poverty Data
Minimum0.036%6.7%
Maximum76.8%50.0%
Range76.8%43.3%
Mean20.3%25.9%
Median10.7%23.9%
Interquartile 25% (IQ1)2.9%20.0%
Interquartile 75% (IQ3)22.6%31.2%
Interquartile Range (IQR)19.7%11.2%
Standard Deviation (Sample)24.3%9.9%
Standard Deviation (Population)23.9%9.8%

Correlation Details

Tlingit-Haida PercentileSample SizeSingle Female Poverty
[
0.0%
-
0.5%
]
0.036%
58,838,10221.8%
[
0.5%
-
1.0%
]
0.54%
1,242,04921.2%
[
0.5%
-
1.0%
]
0.92%
218,45921.9%
[
1.0%
-
1.5%
]
1.23%
79,67728.1%
[
1.5%
-
2.0%
]
1.68%
18,74140.2%
[
2.0%
-
2.5%
]
2.30%
7,38224.1%
[
2.5%
-
3.0%
]
2.63%
60850.0%
[
2.5%
-
3.0%
]
2.87%
69820.0%
[
4.0%
-
4.5%
]
4.04%
54413.8%
[
5.0%
-
5.5%
]
5.24%
42041.7%
[
6.5%
-
7.0%
]
6.91%
56425.0%
[
6.5%
-
7.0%
]
6.94%
2,1466.7%
[
8.0%
-
8.5%
]
8.22%
14629.4%
[
8.5%
-
9.0%
]
9.00%
6,69120.7%
[
10.0%
-
10.5%
]
10.13%
2,90211.4%
[
10.5%
-
11.0%
]
10.70%
29,93318.2%
[
11.0%
-
11.5%
]
11.00%
32,10819.9%
[
11.0%
-
11.5%
]
11.18%
13,91322.1%
[
12.0%
-
12.5%
]
12.26%
18,04121.8%
[
12.5%
-
13.0%
]
12.67%
8,16825.0%
[
15.0%
-
15.5%
]
15.26%
2,16936.0%
[
15.5%
-
16.0%
]
15.92%
1,72723.9%
[
21.0%
-
21.5%
]
21.23%
4,26722.2%
[
22.5%
-
23.0%
]
22.55%
1,07329.2%
[
44.5%
-
45.0%
]
44.78%
92041.7%
[
49.0%
-
49.5%
]
49.33%
1,79215.8%
[
51.0%
-
51.5%
]
51.24%
80441.7%
[
67.5%
-
68.0%
]
67.59%
36131.2%
[
69.0%
-
69.5%
]
69.41%
1,60215.3%
[
74.5%
-
75.0%
]
74.63%
6733.3%
[
76.5%
-
77.0%
]
76.85%
83828.2%