Immigrants from Oceania Disability Age 5 to 17

COMPARE

Immigrants from Oceania
Race
Ancestry
AfghanAfricanAlaska NativeAlaskan AthabascanAlbanianAleutAlsatianAmericanApacheArabArapahoArgentineanArmenianAssyrian/Chaldean/SyriacAustralianAustrianBahamianBangladeshiBarbadianBasqueBelgianBelizeanBermudanBhutaneseBlackfeetBolivianBrazilianBritishBritish West IndianBulgarianBurmeseCajunCambodianCanadianCape VerdeanCarpatho RusynCelticCentral AmericanCentral American IndianCherokeeCheyenneChickasawChileanChineseChippewaChoctawColombianColvilleComancheCosta RicanCreeCreekCroatianCrowCubanCypriotCzechCzechoslovakianDanishDelawareDominicanDutchDutch West IndianEastern EuropeanEcuadorianEgyptianEnglishEstonianEthiopianEuropeanFijianFilipinoFinnishFrenchFrench American IndianFrench CanadianGermanGerman RussianGhanaianGreekGuamanian/ChamorroGuatemalanGuyaneseHaitianHmongHonduranHopiHoumaHungarianIcelanderIndian (Asian)IndonesianInupiatIranianIraqiIrishIroquoisIsraeliItalianJamaicanJapaneseJordanianKenyanKiowaKoreanLaotianLatvianLebaneseLiberianLithuanianLumbeeLuxembourgerMacedonianMalaysianMalteseMarshalleseMenomineeMexicanMexican American IndianMongolianMoroccanNative HawaiianNavajoNepaleseNew ZealanderNicaraguanNigerianNorthern EuropeanNorwegianOkinawanOsageOttawaPaiutePakistaniPalestinianPanamanianParaguayanPennsylvania GermanPeruvianPimaPolishPortuguesePotawatomiPuebloPuerto RicanPuget Sound SalishRomanianRussianSalvadoranSamoanScandinavianScotch-IrishScottishSeminoleSenegaleseSerbianShoshoneSierra LeoneanSiouxSlavicSlovakSloveneSomaliSouth AfricanSouth AmericanSouth American IndianSoviet UnionSpaniardSpanishSpanish AmericanSpanish American IndianSri LankanSubsaharan AfricanSudaneseSwedishSwissSyrianTaiwaneseThaiTlingit-HaidaTohono O'OdhamTonganTrinidadian and TobagonianTsimshianTurkishU.S. Virgin IslanderUgandanUkrainianUruguayanUteVenezuelanVietnameseWelshWest IndianYakamaYaquiYugoslavianYumanYup'ikZimbabwean
Immigration
NonimmigrantsImmigrantsAfghanistanAfricaAlbaniaArgentinaArmeniaAsiaAustraliaAustriaBahamasBangladeshBarbadosBelarusBelgiumBelizeBoliviaBosnia and HerzegovinaBrazilBulgariaBurma/MyanmarCabo VerdeCambodiaCameroonCanadaCaribbeanCentral AmericaChileChinaColombiaCongoCosta RicaCroatiaCubaCzechoslovakiaDenmarkDominicaDominican RepublicEastern AfricaEastern AsiaEastern EuropeEcuadorEgyptEl SalvadorEnglandEritreaEthiopiaEuropeFijiFranceGermanyGhanaGreeceGrenadaGuatemalaGuyanaHaitiHondurasHong KongHungaryIndiaIndonesiaIranIraqIrelandIsraelItalyJamaicaJapanJordanKazakhstanKenyaKoreaKuwaitLaosLatin AmericaLatviaLebanonLiberiaLithuaniaMalaysiaMexicoMicronesiaMiddle AfricaMoldovaMoroccoNepalNetherlandsNicaraguaNigeriaNorth AmericaNorth MacedoniaNorthern AfricaNorthern EuropeNorwayOceaniaPakistanPanamaPeruPhilippinesPolandPortugalRomaniaRussiaSaudi ArabiaScotlandSenegalSerbiaSierra LeoneSingaporeSomaliaSouth AfricaSouth AmericaSouth Central AsiaSouth Eastern AsiaSouthern EuropeSpainSri LankaSt. Vincent and the GrenadinesSudanSwedenSwitzerlandSyriaTaiwanThailandTrinidad and TobagoTurkeyUgandaUkraineUruguayUzbekistanVenezuelaVietnamWest IndiesWestern AfricaWestern AsiaWestern EuropeYemenZaireZimbabweAzores
Select to Compare
Race
Ancestry
AfghanAfricanAlaska NativeAlaskan AthabascanAlbanianAleutAlsatianAmericanApacheArabArapahoArgentineanArmenianAssyrian/Chaldean/SyriacAustralianAustrianBahamianBangladeshiBarbadianBasqueBelgianBelizeanBermudanBhutaneseBlackfeetBolivianBrazilianBritishBritish West IndianBulgarianBurmeseCajunCambodianCanadianCape VerdeanCarpatho RusynCelticCentral AmericanCentral American IndianCherokeeCheyenneChickasawChileanChineseChippewaChoctawColombianColvilleComancheCosta RicanCreeCreekCroatianCrowCubanCypriotCzechCzechoslovakianDanishDelawareDominicanDutchDutch West IndianEastern EuropeanEcuadorianEgyptianEnglishEstonianEthiopianEuropeanFijianFilipinoFinnishFrenchFrench American IndianFrench CanadianGermanGerman RussianGhanaianGreekGuamanian/ChamorroGuatemalanGuyaneseHaitianHmongHonduranHopiHoumaHungarianIcelanderIndian (Asian)IndonesianInupiatIranianIraqiIrishIroquoisIsraeliItalianJamaicanJapaneseJordanianKenyanKiowaKoreanLaotianLatvianLebaneseLiberianLithuanianLumbeeLuxembourgerMacedonianMalaysianMalteseMarshalleseMenomineeMexicanMexican American IndianMongolianMoroccanNative HawaiianNavajoNepaleseNew ZealanderNicaraguanNigerianNorthern EuropeanNorwegianOkinawanOsageOttawaPaiutePakistaniPalestinianPanamanianParaguayanPennsylvania GermanPeruvianPimaPolishPortuguesePotawatomiPuebloPuerto RicanPuget Sound SalishRomanianRussianSalvadoranSamoanScandinavianScotch-IrishScottishSeminoleSenegaleseSerbianShoshoneSierra LeoneanSiouxSlavicSlovakSloveneSomaliSouth AfricanSouth AmericanSouth American IndianSoviet UnionSpaniardSpanishSpanish AmericanSpanish American IndianSri LankanSubsaharan AfricanSudaneseSwedishSwissSyrianTaiwaneseThaiTlingit-HaidaTohono O'OdhamTonganTrinidadian and TobagonianTsimshianTurkishU.S. Virgin IslanderUgandanUkrainianUruguayanUteVenezuelanVietnameseWelshWest IndianYakamaYaquiYugoslavianYumanYup'ikZimbabwean
Immigration
NonimmigrantsImmigrantsAfghanistanAfricaAlbaniaArgentinaArmeniaAsiaAustraliaAustriaBahamasBangladeshBarbadosBelarusBelgiumBelizeBoliviaBosnia and HerzegovinaBrazilBulgariaBurma/MyanmarCabo VerdeCambodiaCameroonCanadaCaribbeanCentral AmericaChileChinaColombiaCongoCosta RicaCroatiaCubaCzechoslovakiaDenmarkDominicaDominican RepublicEastern AfricaEastern AsiaEastern EuropeEcuadorEgyptEl SalvadorEnglandEritreaEthiopiaEuropeFijiFranceGermanyGhanaGreeceGrenadaGuatemalaGuyanaHaitiHondurasHong KongHungaryIndiaIndonesiaIranIraqIrelandIsraelItalyJamaicaJapanJordanKazakhstanKenyaKoreaKuwaitLaosLatin AmericaLatviaLebanonLiberiaLithuaniaMalaysiaMexicoMicronesiaMiddle AfricaMoldovaMoroccoNepalNetherlandsNicaraguaNigeriaNorth AmericaNorth MacedoniaNorthern AfricaNorthern EuropeNorwayPakistanPanamaPeruPhilippinesPolandPortugalRomaniaRussiaSaudi ArabiaScotlandSenegalSerbiaSierra LeoneSingaporeSomaliaSouth AfricaSouth AmericaSouth Central AsiaSouth Eastern AsiaSouthern EuropeSpainSri LankaSt. Vincent and the GrenadinesSudanSwedenSwitzerlandSyriaTaiwanThailandTrinidad and TobagoTurkeyUgandaUkraineUruguayUzbekistanVenezuelaVietnamWest IndiesWestern AfricaWestern AsiaWestern EuropeYemenZaireZimbabweAzores
Disability Age 5 to 17
Income
Poverty
Unemployment
Labor Participation
Family Structure
Vehicle Availability
Education Level
Disability

Immigrants from Oceania Disability Age 5 to 17
Exceptional

5.4%
DISABILITY | AGE 5 TO 17
90.8/ 100
METRIC RATING
138th/ 347
METRIC RANK

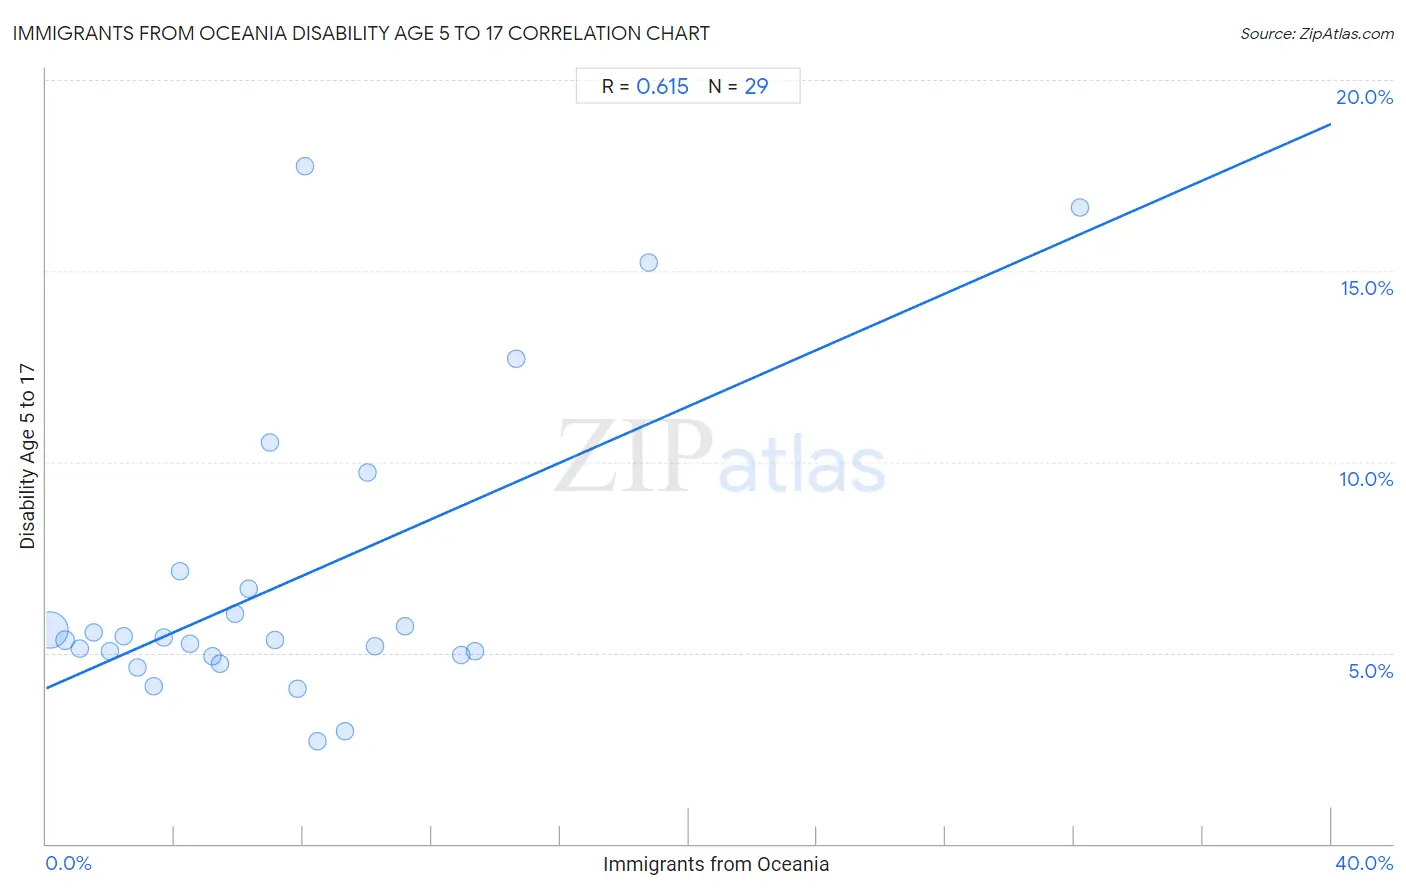
Immigrants from Oceania Disability Age 5 to 17 Correlation Chart

The statistical analysis conducted on geographies consisting of 303,486,257 people shows a significant positive correlation between the proportion of Immigrants from Oceania and percentage of population with a disability between the ages 5 and 17 in the United States with a correlation coefficient (R) of 0.615 and weighted average of 5.4%. On average, for every 1% (one percent) increase in Immigrants from Oceania within a typical geography, there is an increase of 0.37% in percentage of population with a disability between the ages 5 and 17.
Immigrants from Oceania Disability Age 5 to 17
It is essential to understand that the correlation between the percentage of Immigrants from Oceania and percentage of population with a disability between the ages 5 and 17 does not imply a direct cause-and-effect relationship. It remains uncertain whether the presence of Immigrants from Oceania influences an upward or downward trend in the level of percentage of population with a disability between the ages 5 and 17 within an area, or if Immigrants from Oceania simply ended up residing in those areas with higher or lower levels of percentage of population with a disability between the ages 5 and 17 due to other factors.

Demographics Similar to Immigrants from Oceania by Disability Age 5 to 17

In terms of disability age 5 to 17, the demographic groups most similar to Immigrants from Oceania are Navajo (5.4%, a difference of 0.0%), Belizean (5.4%, a difference of 0.0%), Immigrants from Netherlands (5.4%, a difference of 0.050%), Immigrants from Denmark (5.4%, a difference of 0.090%), and Immigrants from Belize (5.4%, a difference of 0.14%).
DemographicsRating | RankDisability Age 5 to 17
Arabs
92.9
/100
|
#131
Exceptional
5.4%
Immigrants from Colombia
92.9
/100
|
#132
Exceptional
5.4%
Venezuelans
92.7
/100
|
#133
Exceptional
5.4%
Yuman
92.3
/100
|
#134
Exceptional
5.4%
Immigrants from Belize
91.7
/100
|
#135
Exceptional
5.4%
Immigrants from Denmark
91.4
/100
|
#136
Exceptional
5.4%
Navajo
90.9
/100
|
#137
Exceptional
5.4%
Immigrants from Oceania
90.8
/100
|
#138
Exceptional
5.4%
Belizeans
90.8
/100
|
#139
Exceptional
5.4%
Immigrants from Netherlands
90.5
/100
|
#140
Exceptional
5.4%
South American Indians
89.3
/100
|
#141
Excellent
5.5%
Colombians
88.0
/100
|
#142
Excellent
5.5%
Immigrants from Hungary
87.9
/100
|
#143
Excellent
5.5%
Pakistanis
87.3
/100
|
#144
Excellent
5.5%
Immigrants from Guatemala
86.6
/100
|
#145
Excellent
5.5%

Immigrants from Oceania Disability Age 5 to 17 Correlation Summary

MeasurementImmigrants from Oceania DataDisability Age 5 to 17 Data
Minimum0.10%2.7%
Maximum32.2%17.7%
Range32.1%15.1%
Mean7.6%6.9%
Median6.3%5.3%
Interquartile 25% (IQ1)3.1%4.9%
Interquartile 75% (IQ3)10.1%6.9%
Interquartile Range (IQR)7.0%2.0%
Standard Deviation (Sample)6.6%3.9%
Standard Deviation (Population)6.4%3.9%

Correlation Details

Immigrants from Oceania PercentileSample SizeDisability Age 5 to 17
[
0.0%
-
0.5%
]
0.10%
280,031,9525.6%
[
0.5%
-
1.0%
]
0.60%
13,798,8055.3%
[
1.0%
-
1.5%
]
1.06%
4,623,4395.1%
[
1.0%
-
1.5%
]
1.49%
2,191,0855.5%
[
1.5%
-
2.0%
]
1.97%
766,9585.0%
[
2.0%
-
2.5%
]
2.42%
489,4455.4%
[
2.5%
-
3.0%
]
2.84%
625,9274.6%
[
3.0%
-
3.5%
]
3.36%
172,3724.1%
[
3.5%
-
4.0%
]
3.65%
254,1535.4%
[
4.0%
-
4.5%
]
4.16%
79,6377.1%
[
4.0%
-
4.5%
]
4.49%
78,1065.2%
[
5.0%
-
5.5%
]
5.17%
208,6274.9%
[
5.0%
-
5.5%
]
5.43%
41,6564.7%
[
5.5%
-
6.0%
]
5.89%
3,9936.0%
[
6.0%
-
6.5%
]
6.31%
6,1956.7%
[
6.5%
-
7.0%
]
6.95%
3,97010.5%
[
7.0%
-
7.5%
]
7.12%
63,0955.3%
[
7.5%
-
8.0%
]
7.83%
14,9874.1%
[
8.0%
-
8.5%
]
8.04%
5,65017.7%
[
8.0%
-
8.5%
]
8.45%
4,8422.7%
[
9.0%
-
9.5%
]
9.31%
2902.9%
[
10.0%
-
10.5%
]
10.02%
1,2789.7%
[
10.0%
-
10.5%
]
10.25%
4,1855.2%
[
11.0%
-
11.5%
]
11.17%
1,6745.7%
[
12.5%
-
13.0%
]
12.94%
7,2364.9%
[
13.0%
-
13.5%
]
13.36%
5,4115.0%
[
14.5%
-
15.0%
]
14.65%
19812.7%
[
18.5%
-
19.0%
]
18.76%
69315.2%
[
32.0%
-
32.5%
]
32.16%
39816.7%