Yaqui Disability Age 5 to 17
COMPARE
Yaqui
Select to Compare
Disability Age 5 to 17
Yaqui Disability Age 5 to 17
6.2%
DISABILITY | AGE 5 TO 17
0.0/ 100
METRIC RATING
289th/ 347
METRIC RANK
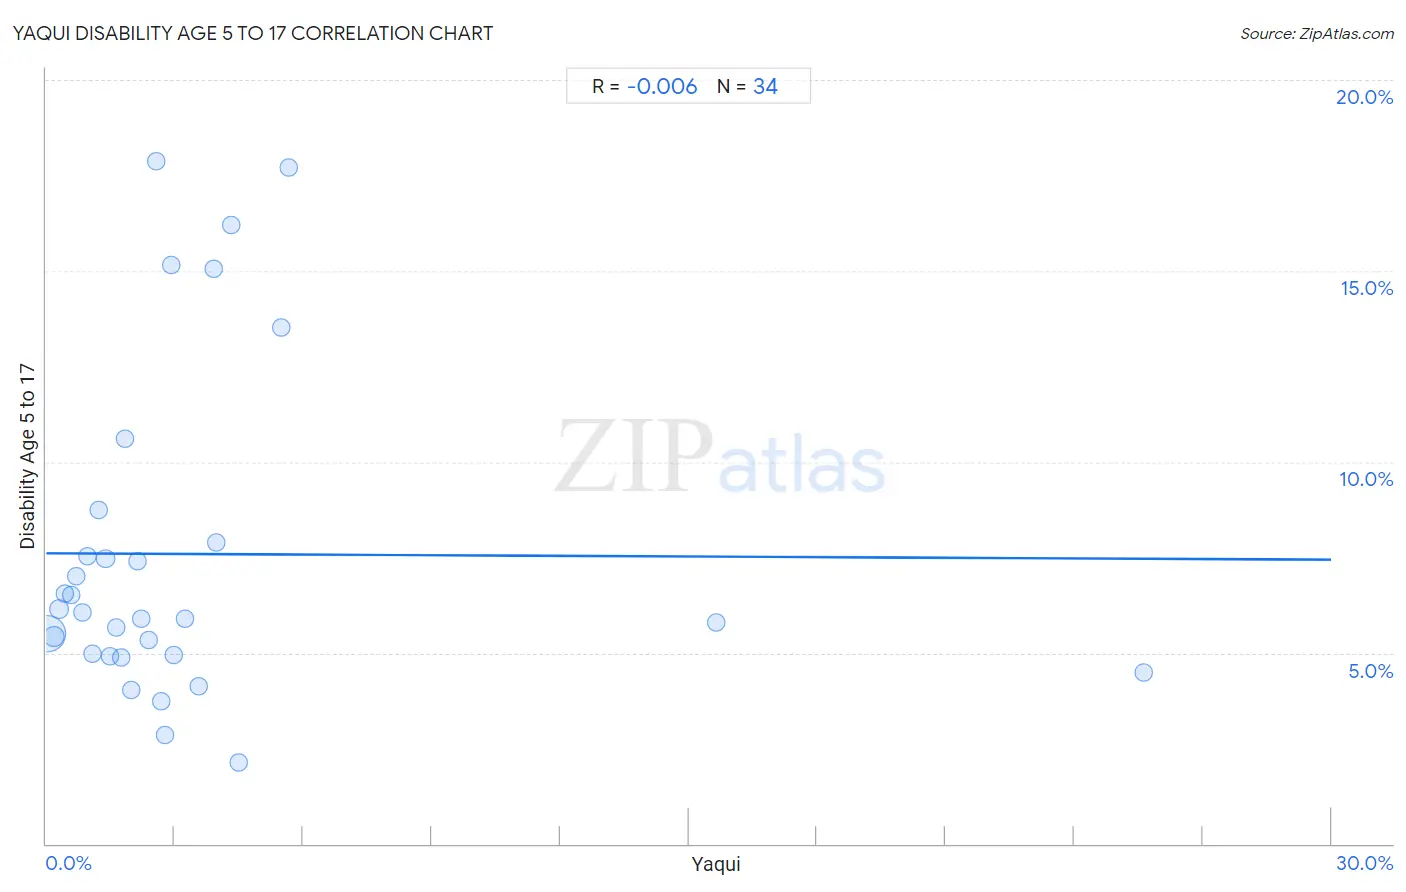
Yaqui Disability Age 5 to 17 Correlation Chart
The statistical analysis conducted on geographies consisting of 107,446,571 people shows no correlation between the proportion of Yaqui and percentage of population with a disability between the ages 5 and 17 in the United States with a correlation coefficient (R) of -0.006 and weighted average of 6.2%. On average, for every 1% (one percent) increase in Yaqui within a typical geography, there is a decrease of 0.0055% in percentage of population with a disability between the ages 5 and 17.
It is essential to understand that the correlation between the percentage of Yaqui and percentage of population with a disability between the ages 5 and 17 does not imply a direct cause-and-effect relationship. It remains uncertain whether the presence of Yaqui influences an upward or downward trend in the level of percentage of population with a disability between the ages 5 and 17 within an area, or if Yaqui simply ended up residing in those areas with higher or lower levels of percentage of population with a disability between the ages 5 and 17 due to other factors.
Demographics Similar to Yaqui by Disability Age 5 to 17
In terms of disability age 5 to 17, the demographic groups most similar to Yaqui are Immigrants from Congo (6.2%, a difference of 0.0%), Jamaican (6.2%, a difference of 0.010%), White/Caucasian (6.2%, a difference of 0.15%), Pima (6.2%, a difference of 0.27%), and Immigrants from Senegal (6.2%, a difference of 0.39%).
| Demographics | Rating | Rank | Disability Age 5 to 17 |
| Germans | 0.0 /100 | #282 | Tragic 6.1% |
| Ugandans | 0.0 /100 | #283 | Tragic 6.2% |
| Sub-Saharan Africans | 0.0 /100 | #284 | Tragic 6.2% |
| English | 0.0 /100 | #285 | Tragic 6.2% |
| Colville | 0.0 /100 | #286 | Tragic 6.2% |
| Pima | 0.0 /100 | #287 | Tragic 6.2% |
| Jamaicans | 0.0 /100 | #288 | Tragic 6.2% |
| Yaqui | 0.0 /100 | #289 | Tragic 6.2% |
| Immigrants from Congo | 0.0 /100 | #290 | Tragic 6.2% |
| Whites/Caucasians | 0.0 /100 | #291 | Tragic 6.2% |
| Immigrants from Senegal | 0.0 /100 | #292 | Tragic 6.2% |
| Central American Indians | 0.0 /100 | #293 | Tragic 6.2% |
| Irish | 0.0 /100 | #294 | Tragic 6.2% |
| Cree | 0.0 /100 | #295 | Tragic 6.2% |
| Spanish Americans | 0.0 /100 | #296 | Tragic 6.2% |
Yaqui Disability Age 5 to 17 Correlation Summary
| Measurement | Yaqui Data | Disability Age 5 to 17 Data |
| Minimum | 0.033% | 2.1% |
| Maximum | 25.6% | 17.9% |
| Range | 25.6% | 15.7% |
| Mean | 3.3% | 7.6% |
| Median | 2.2% | 6.0% |
| Interquartile 25% (IQ1) | 1.1% | 4.9% |
| Interquartile 75% (IQ3) | 3.5% | 7.9% |
| Interquartile Range (IQR) | 2.5% | 2.9% |
| Standard Deviation (Sample) | 4.8% | 4.3% |
| Standard Deviation (Population) | 4.7% | 4.2% |
Correlation Details
| Yaqui Percentile | Sample Size | Disability Age 5 to 17 |
[ 0.0% - 0.5% ] 0.033% | 90,823,752 | 5.5% |
[ 0.0% - 0.5% ] 0.18% | 9,530,339 | 5.4% |
[ 0.0% - 0.5% ] 0.30% | 2,919,859 | 6.1% |
[ 0.0% - 0.5% ] 0.44% | 1,575,646 | 6.6% |
[ 0.5% - 1.0% ] 0.58% | 436,197 | 6.5% |
[ 0.5% - 1.0% ] 0.69% | 347,965 | 7.0% |
[ 0.5% - 1.0% ] 0.83% | 296,178 | 6.1% |
[ 0.5% - 1.0% ] 0.96% | 221,763 | 7.5% |
[ 1.0% - 1.5% ] 1.08% | 77,660 | 5.0% |
[ 1.0% - 1.5% ] 1.22% | 162,236 | 8.7% |
[ 1.0% - 1.5% ] 1.39% | 580,009 | 7.5% |
[ 1.0% - 1.5% ] 1.48% | 25,375 | 4.9% |
[ 1.5% - 2.0% ] 1.65% | 6,066 | 5.7% |
[ 1.5% - 2.0% ] 1.76% | 15,529 | 4.9% |
[ 1.5% - 2.0% ] 1.83% | 60,476 | 10.6% |
[ 1.5% - 2.0% ] 1.97% | 8,016 | 4.0% |
[ 2.0% - 2.5% ] 2.13% | 23,885 | 7.4% |
[ 2.0% - 2.5% ] 2.21% | 93,744 | 5.9% |
[ 2.0% - 2.5% ] 2.41% | 36,650 | 5.3% |
[ 2.5% - 3.0% ] 2.56% | 626 | 17.9% |
[ 2.5% - 3.0% ] 2.68% | 1,454 | 3.7% |
[ 2.5% - 3.0% ] 2.78% | 144 | 2.9% |
[ 2.5% - 3.0% ] 2.92% | 788 | 15.2% |
[ 2.5% - 3.0% ] 2.96% | 2,936 | 4.9% |
[ 3.0% - 3.5% ] 3.23% | 36,828 | 5.9% |
[ 3.5% - 4.0% ] 3.55% | 45,881 | 4.1% |
[ 3.5% - 4.0% ] 3.90% | 15,909 | 15.1% |
[ 3.5% - 4.0% ] 3.98% | 57,897 | 7.9% |
[ 4.0% - 4.5% ] 4.31% | 5,125 | 16.2% |
[ 4.0% - 4.5% ] 4.50% | 1,845 | 2.1% |
[ 5.0% - 5.5% ] 5.49% | 5,100 | 13.5% |
[ 5.5% - 6.0% ] 5.65% | 4,337 | 17.7% |
[ 15.5% - 16.0% ] 15.65% | 21,021 | 5.8% |
[ 25.5% - 26.0% ] 25.62% | 5,335 | 4.5% |