Nicaraguan Disability Age 5 to 17
COMPARE
Nicaraguan
Select to Compare
Disability Age 5 to 17
Nicaraguan Disability Age 5 to 17
5.3%
DISABILITY | AGE 5 TO 17
98.6/ 100
METRIC RATING
102nd/ 347
METRIC RANK
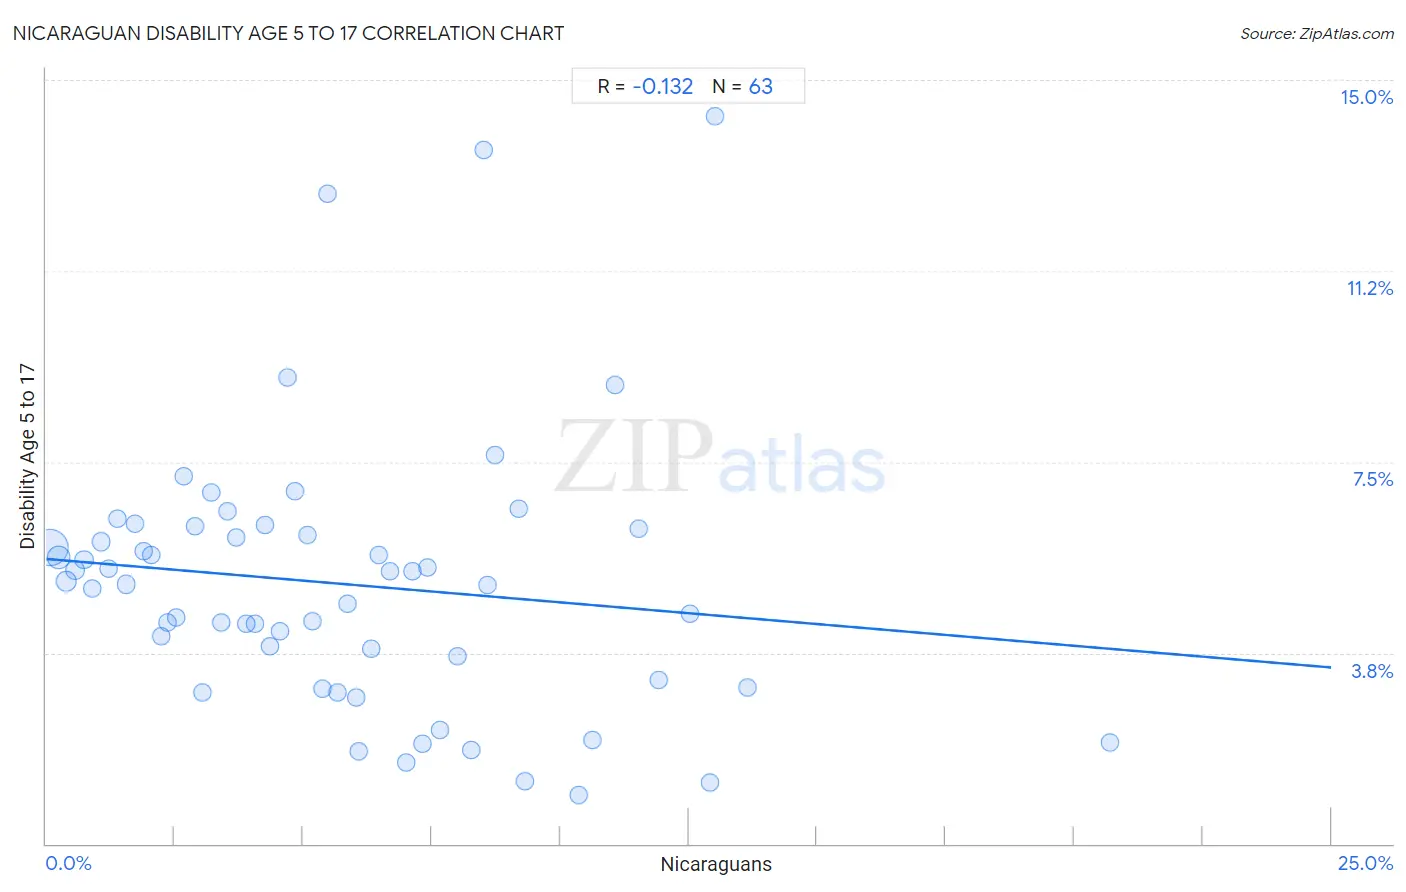
Nicaraguan Disability Age 5 to 17 Correlation Chart
The statistical analysis conducted on geographies consisting of 284,558,915 people shows a poor negative correlation between the proportion of Nicaraguans and percentage of population with a disability between the ages 5 and 17 in the United States with a correlation coefficient (R) of -0.132 and weighted average of 5.3%. On average, for every 1% (one percent) increase in Nicaraguans within a typical geography, there is a decrease of 0.085% in percentage of population with a disability between the ages 5 and 17.
It is essential to understand that the correlation between the percentage of Nicaraguans and percentage of population with a disability between the ages 5 and 17 does not imply a direct cause-and-effect relationship. It remains uncertain whether the presence of Nicaraguans influences an upward or downward trend in the level of percentage of population with a disability between the ages 5 and 17 within an area, or if Nicaraguans simply ended up residing in those areas with higher or lower levels of percentage of population with a disability between the ages 5 and 17 due to other factors.
Demographics Similar to Nicaraguans by Disability Age 5 to 17
In terms of disability age 5 to 17, the demographic groups most similar to Nicaraguans are Salvadoran (5.3%, a difference of 0.030%), Menominee (5.3%, a difference of 0.080%), Nepalese (5.3%, a difference of 0.10%), Peruvian (5.3%, a difference of 0.10%), and Immigrants from Italy (5.3%, a difference of 0.19%).
| Demographics | Rating | Rank | Disability Age 5 to 17 |
| Immigrants from Grenada | 99.1 /100 | #95 | Exceptional 5.3% |
| Immigrants from El Salvador | 99.0 /100 | #96 | Exceptional 5.3% |
| Immigrants from Europe | 99.0 /100 | #97 | Exceptional 5.3% |
| Immigrants from Austria | 98.9 /100 | #98 | Exceptional 5.3% |
| Cambodians | 98.8 /100 | #99 | Exceptional 5.3% |
| Nepalese | 98.7 /100 | #100 | Exceptional 5.3% |
| Menominee | 98.7 /100 | #101 | Exceptional 5.3% |
| Nicaraguans | 98.6 /100 | #102 | Exceptional 5.3% |
| Salvadorans | 98.6 /100 | #103 | Exceptional 5.3% |
| Peruvians | 98.5 /100 | #104 | Exceptional 5.3% |
| Immigrants from Italy | 98.4 /100 | #105 | Exceptional 5.3% |
| Immigrants from Yemen | 98.2 /100 | #106 | Exceptional 5.3% |
| Russians | 98.2 /100 | #107 | Exceptional 5.3% |
| Immigrants from South Africa | 98.1 /100 | #108 | Exceptional 5.3% |
| Immigrants from Northern Africa | 98.1 /100 | #109 | Exceptional 5.3% |
Nicaraguan Disability Age 5 to 17 Correlation Summary
| Measurement | Nicaraguan Data | Disability Age 5 to 17 Data |
| Minimum | 0.071% | 0.96% |
| Maximum | 20.7% | 14.3% |
| Range | 20.6% | 13.3% |
| Mean | 5.8% | 5.1% |
| Median | 5.2% | 5.1% |
| Interquartile 25% (IQ1) | 2.5% | 3.2% |
| Interquartile 75% (IQ3) | 8.3% | 6.2% |
| Interquartile Range (IQR) | 5.7% | 3.0% |
| Standard Deviation (Sample) | 4.1% | 2.7% |
| Standard Deviation (Population) | 4.1% | 2.6% |
Correlation Details
| Nicaraguan Percentile | Sample Size | Disability Age 5 to 17 |
[ 0.0% - 0.5% ] 0.071% | 178,340,370 | 5.8% |
[ 0.0% - 0.5% ] 0.24% | 48,893,796 | 5.6% |
[ 0.0% - 0.5% ] 0.40% | 23,617,404 | 5.2% |
[ 0.5% - 1.0% ] 0.56% | 9,738,234 | 5.4% |
[ 0.5% - 1.0% ] 0.73% | 5,823,231 | 5.6% |
[ 0.5% - 1.0% ] 0.90% | 4,590,877 | 5.0% |
[ 1.0% - 1.5% ] 1.07% | 2,186,043 | 5.9% |
[ 1.0% - 1.5% ] 1.22% | 2,051,974 | 5.4% |
[ 1.0% - 1.5% ] 1.39% | 1,535,338 | 6.4% |
[ 1.5% - 2.0% ] 1.56% | 991,881 | 5.1% |
[ 1.5% - 2.0% ] 1.74% | 466,714 | 6.3% |
[ 1.5% - 2.0% ] 1.89% | 910,843 | 5.8% |
[ 2.0% - 2.5% ] 2.04% | 414,804 | 5.7% |
[ 2.0% - 2.5% ] 2.24% | 495,837 | 4.1% |
[ 2.0% - 2.5% ] 2.36% | 405,663 | 4.3% |
[ 2.5% - 3.0% ] 2.53% | 411,448 | 4.4% |
[ 2.5% - 3.0% ] 2.67% | 192,508 | 7.2% |
[ 2.5% - 3.0% ] 2.89% | 123,060 | 6.2% |
[ 3.0% - 3.5% ] 3.05% | 54,906 | 3.0% |
[ 3.0% - 3.5% ] 3.20% | 217,124 | 6.9% |
[ 3.0% - 3.5% ] 3.41% | 111,207 | 4.4% |
[ 3.5% - 4.0% ] 3.53% | 266,662 | 6.5% |
[ 3.5% - 4.0% ] 3.69% | 72,714 | 6.0% |
[ 3.5% - 4.0% ] 3.88% | 159,927 | 4.3% |
[ 4.0% - 4.5% ] 4.06% | 114,387 | 4.3% |
[ 4.0% - 4.5% ] 4.25% | 51,979 | 6.3% |
[ 4.0% - 4.5% ] 4.36% | 150,561 | 3.9% |
[ 4.5% - 5.0% ] 4.54% | 376,688 | 4.2% |
[ 4.5% - 5.0% ] 4.69% | 81,385 | 9.2% |
[ 4.5% - 5.0% ] 4.84% | 52,719 | 6.9% |
[ 5.0% - 5.5% ] 5.08% | 34,057 | 6.1% |
[ 5.0% - 5.5% ] 5.18% | 80,975 | 4.4% |
[ 5.0% - 5.5% ] 5.37% | 39,581 | 3.0% |
[ 5.0% - 5.5% ] 5.48% | 292 | 12.8% |
[ 5.5% - 6.0% ] 5.66% | 70,014 | 3.0% |
[ 5.5% - 6.0% ] 5.85% | 49,851 | 4.7% |
[ 6.0% - 6.5% ] 6.02% | 82,658 | 2.9% |
[ 6.0% - 6.5% ] 6.09% | 59,115 | 1.8% |
[ 6.0% - 6.5% ] 6.32% | 94,134 | 3.8% |
[ 6.0% - 6.5% ] 6.48% | 443,665 | 5.7% |
[ 6.5% - 7.0% ] 6.69% | 81,226 | 5.3% |
[ 7.0% - 7.5% ] 7.00% | 13,606 | 1.6% |
[ 7.0% - 7.5% ] 7.12% | 1,194 | 5.3% |
[ 7.0% - 7.5% ] 7.32% | 18,719 | 2.0% |
[ 7.0% - 7.5% ] 7.42% | 57,662 | 5.4% |
[ 7.5% - 8.0% ] 7.65% | 34,500 | 2.2% |
[ 8.0% - 8.5% ] 8.01% | 100,985 | 3.7% |
[ 8.0% - 8.5% ] 8.27% | 73,842 | 1.8% |
[ 8.5% - 9.0% ] 8.52% | 270 | 13.6% |
[ 8.5% - 9.0% ] 8.58% | 46,123 | 5.1% |
[ 8.5% - 9.0% ] 8.74% | 14,698 | 7.6% |
[ 9.0% - 9.5% ] 9.19% | 59,121 | 6.6% |
[ 9.0% - 9.5% ] 9.33% | 34,335 | 1.2% |
[ 10.0% - 10.5% ] 10.36% | 2,549 | 0.96% |
[ 10.5% - 11.0% ] 10.62% | 1,083 | 2.0% |
[ 11.0% - 11.5% ] 11.07% | 867 | 9.0% |
[ 11.5% - 12.0% ] 11.53% | 34,742 | 6.2% |
[ 11.5% - 12.0% ] 11.93% | 41,056 | 3.2% |
[ 12.5% - 13.0% ] 12.54% | 54,873 | 4.5% |
[ 12.5% - 13.0% ] 12.92% | 12,069 | 1.2% |
[ 13.0% - 13.5% ] 13.02% | 630 | 14.3% |
[ 13.5% - 14.0% ] 13.65% | 740 | 3.1% |
[ 20.5% - 21.0% ] 20.70% | 19,399 | 2.0% |