Egyptian Disability Age 5 to 17

COMPARE

Egyptian
Race
Ancestry
AfghanAfricanAlaska NativeAlaskan AthabascanAlbanianAleutAlsatianAmericanApacheArabArapahoArgentineanArmenianAssyrian/Chaldean/SyriacAustralianAustrianBahamianBangladeshiBarbadianBasqueBelgianBelizeanBermudanBhutaneseBlackfeetBolivianBrazilianBritishBritish West IndianBulgarianBurmeseCajunCambodianCanadianCape VerdeanCarpatho RusynCelticCentral AmericanCentral American IndianCherokeeCheyenneChickasawChileanChineseChippewaChoctawColombianColvilleComancheCosta RicanCreeCreekCroatianCrowCubanCypriotCzechCzechoslovakianDanishDelawareDominicanDutchDutch West IndianEastern EuropeanEcuadorianEgyptianEnglishEstonianEthiopianEuropeanFijianFilipinoFinnishFrenchFrench American IndianFrench CanadianGermanGerman RussianGhanaianGreekGuamanian/ChamorroGuatemalanGuyaneseHaitianHmongHonduranHopiHoumaHungarianIcelanderIndian (Asian)IndonesianInupiatIranianIraqiIrishIroquoisIsraeliItalianJamaicanJapaneseJordanianKenyanKiowaKoreanLaotianLatvianLebaneseLiberianLithuanianLumbeeLuxembourgerMacedonianMalaysianMalteseMarshalleseMenomineeMexicanMexican American IndianMongolianMoroccanNative HawaiianNavajoNepaleseNew ZealanderNicaraguanNigerianNorthern EuropeanNorwegianOkinawanOsageOttawaPaiutePakistaniPalestinianPanamanianParaguayanPennsylvania GermanPeruvianPimaPolishPortuguesePotawatomiPuebloPuerto RicanPuget Sound SalishRomanianRussianSalvadoranSamoanScandinavianScotch-IrishScottishSeminoleSenegaleseSerbianShoshoneSierra LeoneanSiouxSlavicSlovakSloveneSomaliSouth AfricanSouth AmericanSouth American IndianSoviet UnionSpaniardSpanishSpanish AmericanSpanish American IndianSri LankanSubsaharan AfricanSudaneseSwedishSwissSyrianTaiwaneseThaiTlingit-HaidaTohono O'OdhamTonganTrinidadian and TobagonianTsimshianTurkishU.S. Virgin IslanderUgandanUkrainianUruguayanUteVenezuelanVietnameseWelshWest IndianYakamaYaquiYugoslavianYumanYup'ikZimbabwean
Immigration
NonimmigrantsImmigrantsAfghanistanAfricaAlbaniaArgentinaArmeniaAsiaAustraliaAustriaBahamasBangladeshBarbadosBelarusBelgiumBelizeBoliviaBosnia and HerzegovinaBrazilBulgariaBurma/MyanmarCabo VerdeCambodiaCameroonCanadaCaribbeanCentral AmericaChileChinaColombiaCongoCosta RicaCroatiaCubaCzechoslovakiaDenmarkDominicaDominican RepublicEastern AfricaEastern AsiaEastern EuropeEcuadorEgyptEl SalvadorEnglandEritreaEthiopiaEuropeFijiFranceGermanyGhanaGreeceGrenadaGuatemalaGuyanaHaitiHondurasHong KongHungaryIndiaIndonesiaIranIraqIrelandIsraelItalyJamaicaJapanJordanKazakhstanKenyaKoreaKuwaitLaosLatin AmericaLatviaLebanonLiberiaLithuaniaMalaysiaMexicoMicronesiaMiddle AfricaMoldovaMoroccoNepalNetherlandsNicaraguaNigeriaNorth AmericaNorth MacedoniaNorthern AfricaNorthern EuropeNorwayOceaniaPakistanPanamaPeruPhilippinesPolandPortugalRomaniaRussiaSaudi ArabiaScotlandSenegalSerbiaSierra LeoneSingaporeSomaliaSouth AfricaSouth AmericaSouth Central AsiaSouth Eastern AsiaSouthern EuropeSpainSri LankaSt. Vincent and the GrenadinesSudanSwedenSwitzerlandSyriaTaiwanThailandTrinidad and TobagoTurkeyUgandaUkraineUruguayUzbekistanVenezuelaVietnamWest IndiesWestern AfricaWestern AsiaWestern EuropeYemenZaireZimbabweAzores
Select to Compare
Race
Ancestry
AfghanAfricanAlaska NativeAlaskan AthabascanAlbanianAleutAlsatianAmericanApacheArabArapahoArgentineanArmenianAssyrian/Chaldean/SyriacAustralianAustrianBahamianBangladeshiBarbadianBasqueBelgianBelizeanBermudanBhutaneseBlackfeetBolivianBrazilianBritishBritish West IndianBulgarianBurmeseCajunCambodianCanadianCape VerdeanCarpatho RusynCelticCentral AmericanCentral American IndianCherokeeCheyenneChickasawChileanChineseChippewaChoctawColombianColvilleComancheCosta RicanCreeCreekCroatianCrowCubanCypriotCzechCzechoslovakianDanishDelawareDominicanDutchDutch West IndianEastern EuropeanEcuadorianEnglishEstonianEthiopianEuropeanFijianFilipinoFinnishFrenchFrench American IndianFrench CanadianGermanGerman RussianGhanaianGreekGuamanian/ChamorroGuatemalanGuyaneseHaitianHmongHonduranHopiHoumaHungarianIcelanderIndian (Asian)IndonesianInupiatIranianIraqiIrishIroquoisIsraeliItalianJamaicanJapaneseJordanianKenyanKiowaKoreanLaotianLatvianLebaneseLiberianLithuanianLumbeeLuxembourgerMacedonianMalaysianMalteseMarshalleseMenomineeMexicanMexican American IndianMongolianMoroccanNative HawaiianNavajoNepaleseNew ZealanderNicaraguanNigerianNorthern EuropeanNorwegianOkinawanOsageOttawaPaiutePakistaniPalestinianPanamanianParaguayanPennsylvania GermanPeruvianPimaPolishPortuguesePotawatomiPuebloPuerto RicanPuget Sound SalishRomanianRussianSalvadoranSamoanScandinavianScotch-IrishScottishSeminoleSenegaleseSerbianShoshoneSierra LeoneanSiouxSlavicSlovakSloveneSomaliSouth AfricanSouth AmericanSouth American IndianSoviet UnionSpaniardSpanishSpanish AmericanSpanish American IndianSri LankanSubsaharan AfricanSudaneseSwedishSwissSyrianTaiwaneseThaiTlingit-HaidaTohono O'OdhamTonganTrinidadian and TobagonianTsimshianTurkishU.S. Virgin IslanderUgandanUkrainianUruguayanUteVenezuelanVietnameseWelshWest IndianYakamaYaquiYugoslavianYumanYup'ikZimbabwean
Immigration
NonimmigrantsImmigrantsAfghanistanAfricaAlbaniaArgentinaArmeniaAsiaAustraliaAustriaBahamasBangladeshBarbadosBelarusBelgiumBelizeBoliviaBosnia and HerzegovinaBrazilBulgariaBurma/MyanmarCabo VerdeCambodiaCameroonCanadaCaribbeanCentral AmericaChileChinaColombiaCongoCosta RicaCroatiaCubaCzechoslovakiaDenmarkDominicaDominican RepublicEastern AfricaEastern AsiaEastern EuropeEcuadorEgyptEl SalvadorEnglandEritreaEthiopiaEuropeFijiFranceGermanyGhanaGreeceGrenadaGuatemalaGuyanaHaitiHondurasHong KongHungaryIndiaIndonesiaIranIraqIrelandIsraelItalyJamaicaJapanJordanKazakhstanKenyaKoreaKuwaitLaosLatin AmericaLatviaLebanonLiberiaLithuaniaMalaysiaMexicoMicronesiaMiddle AfricaMoldovaMoroccoNepalNetherlandsNicaraguaNigeriaNorth AmericaNorth MacedoniaNorthern AfricaNorthern EuropeNorwayOceaniaPakistanPanamaPeruPhilippinesPolandPortugalRomaniaRussiaSaudi ArabiaScotlandSenegalSerbiaSierra LeoneSingaporeSomaliaSouth AfricaSouth AmericaSouth Central AsiaSouth Eastern AsiaSouthern EuropeSpainSri LankaSt. Vincent and the GrenadinesSudanSwedenSwitzerlandSyriaTaiwanThailandTrinidad and TobagoTurkeyUgandaUkraineUruguayUzbekistanVenezuelaVietnamWest IndiesWestern AfricaWestern AsiaWestern EuropeYemenZaireZimbabweAzores
Disability Age 5 to 17
Income
Poverty
Unemployment
Labor Participation
Family Structure
Vehicle Availability
Education Level
Disability

Egyptian Disability Age 5 to 17
Exceptional

5.0%
DISABILITY | AGE 5 TO 17
100.0/ 100
METRIC RATING
44th/ 347
METRIC RANK

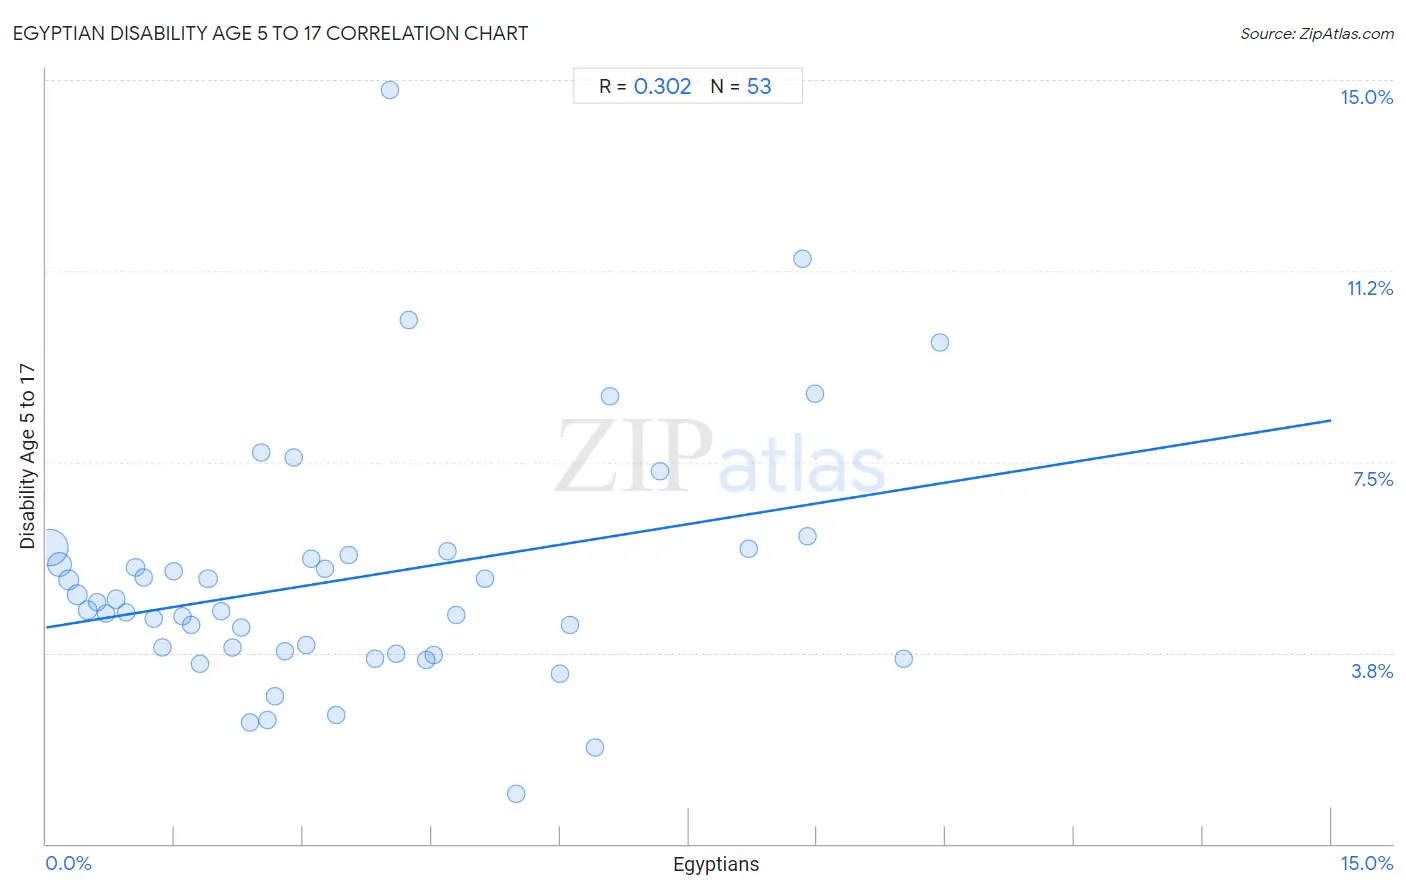
Egyptian Disability Age 5 to 17 Correlation Chart

The statistical analysis conducted on geographies consisting of 275,465,028 people shows a mild positive correlation between the proportion of Egyptians and percentage of population with a disability between the ages 5 and 17 in the United States with a correlation coefficient (R) of 0.302 and weighted average of 5.0%. On average, for every 1% (one percent) increase in Egyptians within a typical geography, there is an increase of 0.27% in percentage of population with a disability between the ages 5 and 17.
Egyptian Disability Age 5 to 17
It is essential to understand that the correlation between the percentage of Egyptians and percentage of population with a disability between the ages 5 and 17 does not imply a direct cause-and-effect relationship. It remains uncertain whether the presence of Egyptians influences an upward or downward trend in the level of percentage of population with a disability between the ages 5 and 17 within an area, or if Egyptians simply ended up residing in those areas with higher or lower levels of percentage of population with a disability between the ages 5 and 17 due to other factors.

Demographics Similar to Egyptians by Disability Age 5 to 17

In terms of disability age 5 to 17, the demographic groups most similar to Egyptians are Immigrants from Russia (5.0%, a difference of 0.040%), Tongan (5.0%, a difference of 0.070%), Assyrian/Chaldean/Syriac (5.0%, a difference of 0.14%), Vietnamese (5.1%, a difference of 0.27%), and Immigrants from Sri Lanka (5.0%, a difference of 0.42%).
DemographicsRating | RankDisability Age 5 to 17
Immigrants from Belarus
100.0
/100
|
#37
Exceptional
5.0%
Immigrants from Philippines
100.0
/100
|
#38
Exceptional
5.0%
Immigrants from Argentina
100.0
/100
|
#39
Exceptional
5.0%
Okinawans
100.0
/100
|
#40
Exceptional
5.0%
Immigrants from Australia
100.0
/100
|
#41
Exceptional
5.0%
Immigrants from Sri Lanka
100.0
/100
|
#42
Exceptional
5.0%
Immigrants from Russia
100.0
/100
|
#43
Exceptional
5.0%
Egyptians
100.0
/100
|
#44
Exceptional
5.0%
Tongans
100.0
/100
|
#45
Exceptional
5.0%
Assyrians/Chaldeans/Syriacs
100.0
/100
|
#46
Exceptional
5.0%
Vietnamese
100.0
/100
|
#47
Exceptional
5.1%
Koreans
100.0
/100
|
#48
Exceptional
5.1%
Immigrants from Western Asia
100.0
/100
|
#49
Exceptional
5.1%
Argentineans
99.9
/100
|
#50
Exceptional
5.1%
Turks
99.9
/100
|
#51
Exceptional
5.1%

Egyptian Disability Age 5 to 17 Correlation Summary

MeasurementEgyptian DataDisability Age 5 to 17 Data
Minimum0.048%0.99%
Maximum10.4%14.8%
Range10.4%13.8%
Mean3.6%5.2%
Median2.9%4.6%
Interquartile 25% (IQ1)1.4%3.8%
Interquartile 75% (IQ3)5.0%5.7%
Interquartile Range (IQR)3.5%1.9%
Standard Deviation (Sample)2.7%2.5%
Standard Deviation (Population)2.7%2.4%

Correlation Details

Egyptian PercentileSample SizeDisability Age 5 to 17
[
0.0%
-
0.5%
]
0.048%
148,354,2825.8%
[
0.0%
-
0.5%
]
0.16%
56,950,6905.5%
[
0.0%
-
0.5%
]
0.27%
19,926,1105.2%
[
0.0%
-
0.5%
]
0.36%
22,652,7134.9%
[
0.0%
-
0.5%
]
0.49%
7,387,6624.6%
[
0.5%
-
1.0%
]
0.60%
4,755,4294.7%
[
0.5%
-
1.0%
]
0.70%
3,185,4134.5%
[
0.5%
-
1.0%
]
0.82%
2,365,2614.8%
[
0.5%
-
1.0%
]
0.93%
1,773,9664.5%
[
1.0%
-
1.5%
]
1.04%
1,935,6895.4%
[
1.0%
-
1.5%
]
1.14%
852,2305.2%
[
1.0%
-
1.5%
]
1.25%
670,8534.4%
[
1.0%
-
1.5%
]
1.35%
763,6033.9%
[
1.0%
-
1.5%
]
1.48%
391,2965.3%
[
1.5%
-
2.0%
]
1.59%
379,2664.5%
[
1.5%
-
2.0%
]
1.69%
507,7424.3%
[
1.5%
-
2.0%
]
1.80%
290,4193.5%
[
1.5%
-
2.0%
]
1.89%
740,6595.2%
[
2.0%
-
2.5%
]
2.04%
260,2204.6%
[
2.0%
-
2.5%
]
2.17%
109,3823.8%
[
2.0%
-
2.5%
]
2.27%
25,9384.3%
[
2.0%
-
2.5%
]
2.38%
75,8332.4%
[
2.5%
-
3.0%
]
2.51%
6,1387.7%
[
2.5%
-
3.0%
]
2.58%
147,1832.4%
[
2.5%
-
3.0%
]
2.66%
143,7342.9%
[
2.5%
-
3.0%
]
2.79%
96,4343.8%
[
2.5%
-
3.0%
]
2.89%
1,8697.6%
[
3.0%
-
3.5%
]
3.03%
76,7283.9%
[
3.0%
-
3.5%
]
3.10%
112,1915.6%
[
3.0%
-
3.5%
]
3.25%
8,8295.4%
[
3.0%
-
3.5%
]
3.38%
4,7002.5%
[
3.5%
-
4.0%
]
3.53%
16,6195.7%
[
3.5%
-
4.0%
]
3.83%
57,8213.6%
[
4.0%
-
4.5%
]
4.01%
29914.8%
[
4.0%
-
4.5%
]
4.09%
60,3033.7%
[
4.0%
-
4.5%
]
4.23%
11,82610.3%
[
4.0%
-
4.5%
]
4.44%
36,8233.6%
[
4.5%
-
5.0%
]
4.52%
1553.7%
[
4.5%
-
5.0%
]
4.68%
45,2925.7%
[
4.5%
-
5.0%
]
4.79%
4,7824.5%
[
5.0%
-
5.5%
]
5.13%
99,8005.2%
[
5.0%
-
5.5%
]
5.49%
6010.99%
[
5.5%
-
6.0%
]
5.99%
3,5533.3%
[
6.0%
-
6.5%
]
6.12%
1,7984.3%
[
6.0%
-
6.5%
]
6.40%
2,3911.9%
[
6.5%
-
7.0%
]
6.59%
8,4108.8%
[
7.0%
-
7.5%
]
7.17%
7,0177.3%
[
8.0%
-
8.5%
]
8.20%
140,9945.8%
[
8.5%
-
9.0%
]
8.83%
1,15511.5%
[
8.5%
-
9.0%
]
8.89%
1,4296.0%
[
8.5%
-
9.0%
]
8.97%
7478.8%
[
10.0%
-
10.5%
]
10.02%
5,7513.6%
[
10.0%
-
10.5%
]
10.44%
5,0009.8%