Guatemalan Disability Age 5 to 17
COMPARE
Guatemalan
Select to Compare
Disability Age 5 to 17
Guatemalan Disability Age 5 to 17
5.5%
DISABILITY | AGE 5 TO 17
81.5/ 100
METRIC RATING
150th/ 347
METRIC RANK
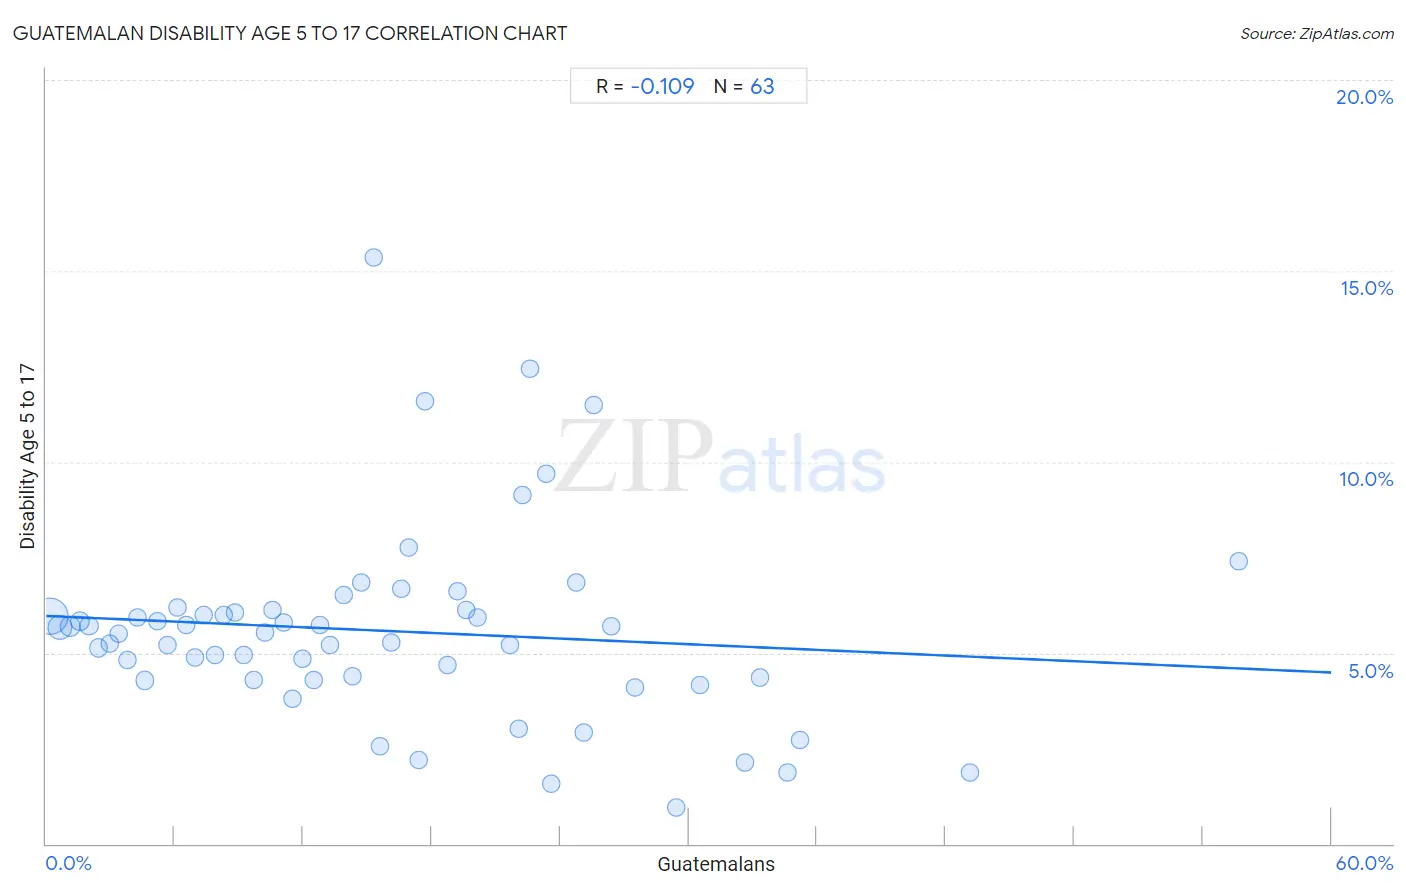
Guatemalan Disability Age 5 to 17 Correlation Chart
The statistical analysis conducted on geographies consisting of 406,988,204 people shows a poor negative correlation between the proportion of Guatemalans and percentage of population with a disability between the ages 5 and 17 in the United States with a correlation coefficient (R) of -0.109 and weighted average of 5.5%. On average, for every 1% (one percent) increase in Guatemalans within a typical geography, there is a decrease of 0.025% in percentage of population with a disability between the ages 5 and 17.
It is essential to understand that the correlation between the percentage of Guatemalans and percentage of population with a disability between the ages 5 and 17 does not imply a direct cause-and-effect relationship. It remains uncertain whether the presence of Guatemalans influences an upward or downward trend in the level of percentage of population with a disability between the ages 5 and 17 within an area, or if Guatemalans simply ended up residing in those areas with higher or lower levels of percentage of population with a disability between the ages 5 and 17 due to other factors.
Demographics Similar to Guatemalans by Disability Age 5 to 17
In terms of disability age 5 to 17, the demographic groups most similar to Guatemalans are Central American (5.5%, a difference of 0.0%), Samoan (5.5%, a difference of 0.030%), Estonian (5.5%, a difference of 0.060%), Ute (5.5%, a difference of 0.070%), and Immigrants from Albania (5.5%, a difference of 0.13%).
| Demographics | Rating | Rank | Disability Age 5 to 17 |
| Immigrants from Hungary | 87.9 /100 | #143 | Excellent 5.5% |
| Pakistanis | 87.3 /100 | #144 | Excellent 5.5% |
| Immigrants from Guatemala | 86.6 /100 | #145 | Excellent 5.5% |
| Albanians | 83.7 /100 | #146 | Excellent 5.5% |
| Immigrants from Albania | 83.1 /100 | #147 | Excellent 5.5% |
| Samoans | 81.9 /100 | #148 | Excellent 5.5% |
| Central Americans | 81.6 /100 | #149 | Excellent 5.5% |
| Guatemalans | 81.5 /100 | #150 | Excellent 5.5% |
| Estonians | 80.8 /100 | #151 | Excellent 5.5% |
| Ute | 80.6 /100 | #152 | Excellent 5.5% |
| Ecuadorians | 79.7 /100 | #153 | Good 5.5% |
| Australians | 78.8 /100 | #154 | Good 5.5% |
| Immigrants from Ecuador | 78.3 /100 | #155 | Good 5.5% |
| Hawaiians | 78.0 /100 | #156 | Good 5.5% |
| Immigrants from Costa Rica | 77.9 /100 | #157 | Good 5.5% |
Guatemalan Disability Age 5 to 17 Correlation Summary
| Measurement | Guatemalan Data | Disability Age 5 to 17 Data |
| Minimum | 0.18% | 0.96% |
| Maximum | 55.7% | 15.4% |
| Range | 55.5% | 14.4% |
| Mean | 15.8% | 5.6% |
| Median | 14.3% | 5.5% |
| Interquartile 25% (IQ1) | 7.0% | 4.3% |
| Interquartile 75% (IQ3) | 22.6% | 6.1% |
| Interquartile Range (IQR) | 15.6% | 1.8% |
| Standard Deviation (Sample) | 11.2% | 2.5% |
| Standard Deviation (Population) | 11.2% | 2.5% |
Correlation Details
| Guatemalan Percentile | Sample Size | Disability Age 5 to 17 |
[ 0.0% - 0.5% ] 0.18% | 242,365,726 | 6.0% |
[ 0.5% - 1.0% ] 0.63% | 82,069,556 | 5.7% |
[ 1.0% - 1.5% ] 1.12% | 27,678,072 | 5.7% |
[ 1.5% - 2.0% ] 1.57% | 17,189,590 | 5.8% |
[ 2.0% - 2.5% ] 2.01% | 9,137,331 | 5.7% |
[ 2.0% - 2.5% ] 2.46% | 5,796,887 | 5.1% |
[ 2.5% - 3.0% ] 2.95% | 4,616,018 | 5.2% |
[ 3.0% - 3.5% ] 3.36% | 2,124,582 | 5.5% |
[ 3.5% - 4.0% ] 3.81% | 1,744,652 | 4.8% |
[ 4.0% - 4.5% ] 4.25% | 1,672,902 | 5.9% |
[ 4.5% - 5.0% ] 4.60% | 4,893,223 | 4.3% |
[ 5.0% - 5.5% ] 5.17% | 1,060,666 | 5.8% |
[ 5.5% - 6.0% ] 5.67% | 598,551 | 5.2% |
[ 6.0% - 6.5% ] 6.12% | 577,428 | 6.2% |
[ 6.5% - 7.0% ] 6.52% | 470,047 | 5.7% |
[ 6.5% - 7.0% ] 6.97% | 441,895 | 4.9% |
[ 7.0% - 7.5% ] 7.38% | 631,376 | 6.0% |
[ 7.5% - 8.0% ] 7.85% | 386,639 | 4.9% |
[ 8.0% - 8.5% ] 8.30% | 437,023 | 6.0% |
[ 8.5% - 9.0% ] 8.82% | 286,441 | 6.0% |
[ 9.0% - 9.5% ] 9.21% | 302,491 | 4.9% |
[ 9.5% - 10.0% ] 9.72% | 261,398 | 4.3% |
[ 10.0% - 10.5% ] 10.22% | 345,029 | 5.5% |
[ 10.5% - 11.0% ] 10.54% | 251,119 | 6.1% |
[ 11.0% - 11.5% ] 11.07% | 353,847 | 5.8% |
[ 11.5% - 12.0% ] 11.50% | 132,659 | 3.8% |
[ 11.5% - 12.0% ] 11.94% | 89,720 | 4.8% |
[ 12.5% - 13.0% ] 12.51% | 114,681 | 4.3% |
[ 12.5% - 13.0% ] 12.81% | 22,839 | 5.7% |
[ 13.0% - 13.5% ] 13.23% | 135,197 | 5.2% |
[ 13.5% - 14.0% ] 13.87% | 101,892 | 6.5% |
[ 14.0% - 14.5% ] 14.27% | 46,669 | 4.4% |
[ 14.5% - 15.0% ] 14.69% | 28,913 | 6.8% |
[ 15.0% - 15.5% ] 15.29% | 1,014 | 15.4% |
[ 15.5% - 16.0% ] 15.56% | 81,504 | 2.5% |
[ 16.0% - 16.5% ] 16.13% | 79,754 | 5.3% |
[ 16.5% - 17.0% ] 16.59% | 38,632 | 6.7% |
[ 16.5% - 17.0% ] 16.94% | 12,802 | 7.8% |
[ 17.0% - 17.5% ] 17.41% | 3,223 | 2.2% |
[ 17.5% - 18.0% ] 17.66% | 9,753 | 11.6% |
[ 18.5% - 19.0% ] 18.73% | 7,495 | 4.7% |
[ 19.0% - 19.5% ] 19.19% | 10,903 | 6.6% |
[ 19.5% - 20.0% ] 19.62% | 102,397 | 6.1% |
[ 20.0% - 20.5% ] 20.16% | 2,485 | 5.9% |
[ 21.5% - 22.0% ] 21.63% | 39,358 | 5.2% |
[ 22.0% - 22.5% ] 22.04% | 19,513 | 3.0% |
[ 22.0% - 22.5% ] 22.25% | 6,624 | 9.1% |
[ 22.5% - 23.0% ] 22.60% | 36,405 | 12.4% |
[ 23.0% - 23.5% ] 23.33% | 553 | 9.7% |
[ 23.5% - 24.0% ] 23.56% | 50,387 | 1.6% |
[ 24.5% - 25.0% ] 24.75% | 6,687 | 6.9% |
[ 25.0% - 25.5% ] 25.11% | 56,969 | 2.9% |
[ 25.5% - 26.0% ] 25.55% | 407 | 11.5% |
[ 26.0% - 26.5% ] 26.37% | 5,468 | 5.7% |
[ 27.0% - 27.5% ] 27.49% | 211 | 4.1% |
[ 29.0% - 29.5% ] 29.43% | 10,418 | 0.96% |
[ 30.5% - 31.0% ] 30.55% | 635 | 4.2% |
[ 32.5% - 33.0% ] 32.60% | 2,506 | 2.1% |
[ 33.0% - 33.5% ] 33.32% | 3,763 | 4.3% |
[ 34.5% - 35.0% ] 34.63% | 10,371 | 1.9% |
[ 35.0% - 35.5% ] 35.17% | 981 | 2.7% |
[ 43.0% - 43.5% ] 43.14% | 21,778 | 1.9% |
[ 55.5% - 56.0% ] 55.70% | 149 | 7.4% |