Immigrants from Pakistan Disability Age 5 to 17
COMPARE
Immigrants from Pakistan
Select to Compare
Disability Age 5 to 17
Immigrants from Pakistan Disability Age 5 to 17
5.0%
DISABILITY | AGE 5 TO 17
100.0/ 100
METRIC RATING
31st/ 347
METRIC RANK
Immigrants from Pakistan Disability Age 5 to 17 Correlation Chart
The statistical analysis conducted on geographies consisting of 282,773,176 people shows a moderate positive correlation between the proportion of Immigrants from Pakistan and percentage of population with a disability between the ages 5 and 17 in the United States with a correlation coefficient (R) of 0.437 and weighted average of 5.0%. On average, for every 1% (one percent) increase in Immigrants from Pakistan within a typical geography, there is an increase of 1.0% in percentage of population with a disability between the ages 5 and 17.
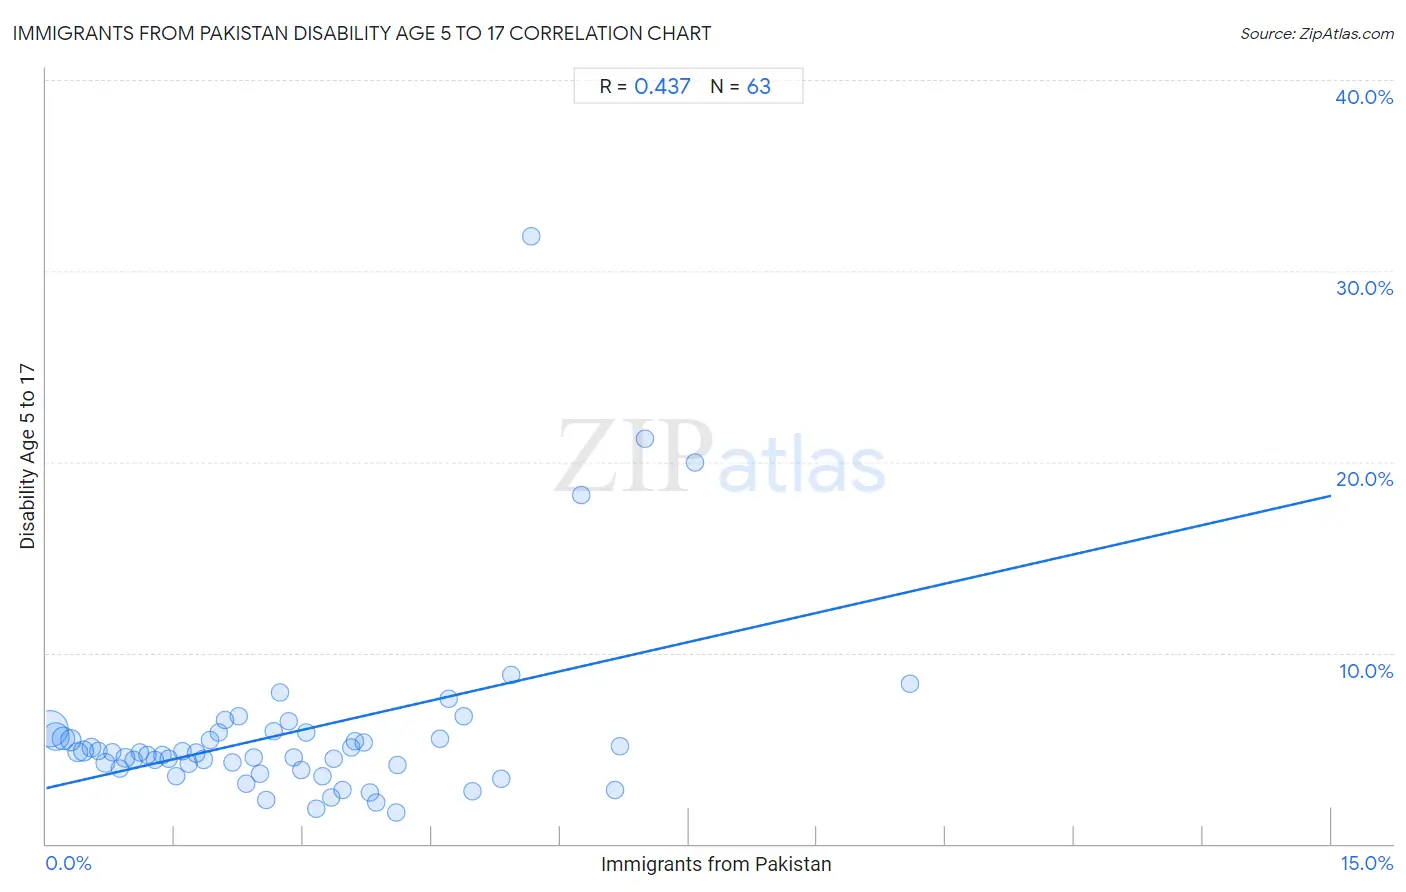
It is essential to understand that the correlation between the percentage of Immigrants from Pakistan and percentage of population with a disability between the ages 5 and 17 does not imply a direct cause-and-effect relationship. It remains uncertain whether the presence of Immigrants from Pakistan influences an upward or downward trend in the level of percentage of population with a disability between the ages 5 and 17 within an area, or if Immigrants from Pakistan simply ended up residing in those areas with higher or lower levels of percentage of population with a disability between the ages 5 and 17 due to other factors.
Demographics Similar to Immigrants from Pakistan by Disability Age 5 to 17
In terms of disability age 5 to 17, the demographic groups most similar to Immigrants from Pakistan are Soviet Union (5.0%, a difference of 0.040%), Immigrants from Malaysia (5.0%, a difference of 0.25%), Immigrants from Indonesia (5.0%, a difference of 0.36%), Immigrants from Serbia (4.9%, a difference of 0.47%), and Israeli (5.0%, a difference of 0.48%).
| Demographics | Rating | Rank | Disability Age 5 to 17 |
| Immigrants from Lebanon | 100.0 /100 | #24 | Exceptional 4.8% |
| Immigrants from Asia | 100.0 /100 | #25 | Exceptional 4.8% |
| Bhutanese | 100.0 /100 | #26 | Exceptional 4.9% |
| Taiwanese | 100.0 /100 | #27 | Exceptional 4.9% |
| Immigrants from Japan | 100.0 /100 | #28 | Exceptional 4.9% |
| Immigrants from Serbia | 100.0 /100 | #29 | Exceptional 4.9% |
| Immigrants from Malaysia | 100.0 /100 | #30 | Exceptional 5.0% |
| Immigrants from Pakistan | 100.0 /100 | #31 | Exceptional 5.0% |
| Soviet Union | 100.0 /100 | #32 | Exceptional 5.0% |
| Immigrants from Indonesia | 100.0 /100 | #33 | Exceptional 5.0% |
| Israelis | 100.0 /100 | #34 | Exceptional 5.0% |
| Bolivians | 100.0 /100 | #35 | Exceptional 5.0% |
| Immigrants from Egypt | 100.0 /100 | #36 | Exceptional 5.0% |
| Immigrants from Belarus | 100.0 /100 | #37 | Exceptional 5.0% |
| Immigrants from Philippines | 100.0 /100 | #38 | Exceptional 5.0% |
Immigrants from Pakistan Disability Age 5 to 17 Correlation Summary
| Measurement | Immigrants from Pakistan Data | Disability Age 5 to 17 Data |
| Minimum | 0.041% | 1.7% |
| Maximum | 10.1% | 31.8% |
| Range | 10.0% | 30.2% |
| Mean | 2.9% | 5.9% |
| Median | 2.6% | 4.8% |
| Interquartile 25% (IQ1) | 1.3% | 3.9% |
| Interquartile 75% (IQ3) | 3.8% | 5.8% |
| Interquartile Range (IQR) | 2.6% | 1.9% |
| Standard Deviation (Sample) | 2.1% | 4.9% |
| Standard Deviation (Population) | 2.1% | 4.8% |
Correlation Details
| Immigrants from Pakistan Percentile | Sample Size | Disability Age 5 to 17 |
[ 0.0% - 0.5% ] 0.041% | 111,810,519 | 6.0% |
[ 0.0% - 0.5% ] 0.12% | 55,953,322 | 5.6% |
[ 0.0% - 0.5% ] 0.20% | 33,748,883 | 5.5% |
[ 0.0% - 0.5% ] 0.29% | 19,792,544 | 5.4% |
[ 0.0% - 0.5% ] 0.37% | 11,311,321 | 4.8% |
[ 0.0% - 0.5% ] 0.44% | 17,164,069 | 4.9% |
[ 0.5% - 1.0% ] 0.53% | 5,756,773 | 5.0% |
[ 0.5% - 1.0% ] 0.61% | 4,182,765 | 4.8% |
[ 0.5% - 1.0% ] 0.69% | 3,379,429 | 4.2% |
[ 0.5% - 1.0% ] 0.77% | 2,806,465 | 4.8% |
[ 0.5% - 1.0% ] 0.86% | 2,137,347 | 3.9% |
[ 0.5% - 1.0% ] 0.92% | 3,010,989 | 4.5% |
[ 1.0% - 1.5% ] 1.02% | 1,727,858 | 4.4% |
[ 1.0% - 1.5% ] 1.10% | 831,049 | 4.8% |
[ 1.0% - 1.5% ] 1.19% | 966,709 | 4.6% |
[ 1.0% - 1.5% ] 1.26% | 1,339,283 | 4.4% |
[ 1.0% - 1.5% ] 1.35% | 647,544 | 4.7% |
[ 1.0% - 1.5% ] 1.43% | 517,882 | 4.5% |
[ 1.5% - 2.0% ] 1.51% | 644,056 | 3.5% |
[ 1.5% - 2.0% ] 1.59% | 467,446 | 4.8% |
[ 1.5% - 2.0% ] 1.67% | 486,778 | 4.2% |
[ 1.5% - 2.0% ] 1.76% | 231,466 | 4.7% |
[ 1.5% - 2.0% ] 1.83% | 410,332 | 4.4% |
[ 1.5% - 2.0% ] 1.91% | 190,471 | 5.5% |
[ 2.0% - 2.5% ] 2.01% | 117,396 | 5.8% |
[ 2.0% - 2.5% ] 2.09% | 155,567 | 6.5% |
[ 2.0% - 2.5% ] 2.17% | 376,475 | 4.2% |
[ 2.0% - 2.5% ] 2.24% | 331,575 | 6.7% |
[ 2.0% - 2.5% ] 2.33% | 132,787 | 3.2% |
[ 2.0% - 2.5% ] 2.42% | 198,651 | 4.5% |
[ 2.0% - 2.5% ] 2.50% | 245,156 | 3.7% |
[ 2.5% - 3.0% ] 2.57% | 73,701 | 2.3% |
[ 2.5% - 3.0% ] 2.66% | 76,816 | 5.9% |
[ 2.5% - 3.0% ] 2.72% | 93,660 | 8.0% |
[ 2.5% - 3.0% ] 2.83% | 95,197 | 6.4% |
[ 2.5% - 3.0% ] 2.89% | 176,518 | 4.5% |
[ 2.5% - 3.0% ] 2.97% | 39,329 | 3.9% |
[ 3.0% - 3.5% ] 3.04% | 129,420 | 5.9% |
[ 3.0% - 3.5% ] 3.16% | 60,271 | 1.8% |
[ 3.0% - 3.5% ] 3.23% | 31,022 | 3.5% |
[ 3.0% - 3.5% ] 3.32% | 35,779 | 2.4% |
[ 3.0% - 3.5% ] 3.36% | 133,488 | 4.4% |
[ 3.0% - 3.5% ] 3.46% | 109,978 | 2.8% |
[ 3.5% - 4.0% ] 3.55% | 14,631 | 5.1% |
[ 3.5% - 4.0% ] 3.61% | 63,183 | 5.4% |
[ 3.5% - 4.0% ] 3.70% | 83,530 | 5.3% |
[ 3.5% - 4.0% ] 3.78% | 123,078 | 2.7% |
[ 3.5% - 4.0% ] 3.85% | 9,567 | 2.2% |
[ 4.0% - 4.5% ] 4.08% | 4,265 | 1.7% |
[ 4.0% - 4.5% ] 4.10% | 31,609 | 4.1% |
[ 4.5% - 5.0% ] 4.60% | 50,245 | 5.5% |
[ 4.5% - 5.0% ] 4.70% | 12,209 | 7.6% |
[ 4.5% - 5.0% ] 4.88% | 17,793 | 6.7% |
[ 4.5% - 5.0% ] 4.97% | 95,920 | 2.7% |
[ 5.0% - 5.5% ] 5.32% | 30,553 | 3.4% |
[ 5.0% - 5.5% ] 5.43% | 13,010 | 8.9% |
[ 5.5% - 6.0% ] 5.66% | 10,566 | 31.8% |
[ 6.0% - 6.5% ] 6.24% | 945 | 18.3% |
[ 6.5% - 7.0% ] 6.64% | 76,600 | 2.8% |
[ 6.5% - 7.0% ] 6.70% | 1,374 | 5.1% |
[ 6.5% - 7.0% ] 6.99% | 143 | 21.2% |
[ 7.5% - 8.0% ] 7.58% | 66 | 20.0% |
[ 10.0% - 10.5% ] 10.08% | 5,803 | 8.4% |