Choctaw Disability Age 5 to 17
COMPARE
Choctaw
Select to Compare
Disability Age 5 to 17
Choctaw Disability Age 5 to 17
6.9%
DISABILITY | AGE 5 TO 17
0.0/ 100
METRIC RATING
339th/ 347
METRIC RANK
Choctaw Disability Age 5 to 17 Correlation Chart
The statistical analysis conducted on geographies consisting of 268,025,414 people shows a weak positive correlation between the proportion of Choctaw and percentage of population with a disability between the ages 5 and 17 in the United States with a correlation coefficient (R) of 0.266 and weighted average of 6.9%. On average, for every 1% (one percent) increase in Choctaw within a typical geography, there is an increase of 0.077% in percentage of population with a disability between the ages 5 and 17.
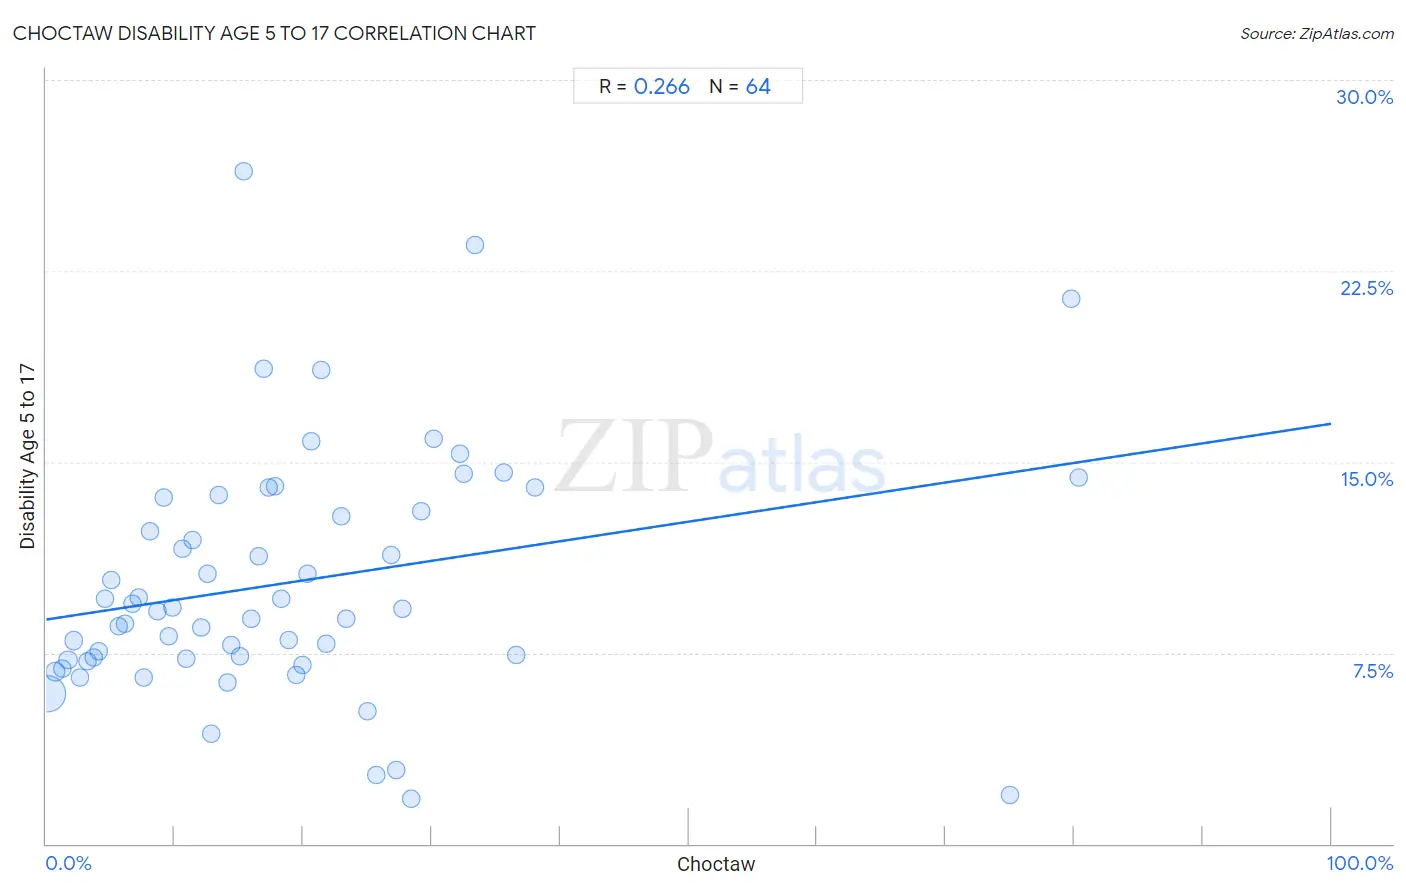
It is essential to understand that the correlation between the percentage of Choctaw and percentage of population with a disability between the ages 5 and 17 does not imply a direct cause-and-effect relationship. It remains uncertain whether the presence of Choctaw influences an upward or downward trend in the level of percentage of population with a disability between the ages 5 and 17 within an area, or if Choctaw simply ended up residing in those areas with higher or lower levels of percentage of population with a disability between the ages 5 and 17 due to other factors.
Demographics Similar to Choctaw by Disability Age 5 to 17
In terms of disability age 5 to 17, the demographic groups most similar to Choctaw are Cherokee (6.9%, a difference of 0.26%), Iroquois (6.9%, a difference of 0.33%), Creek (6.9%, a difference of 0.57%), Cape Verdean (7.0%, a difference of 0.80%), and Chickasaw (6.8%, a difference of 1.0%).
| Demographics | Rating | Rank | Disability Age 5 to 17 |
| Immigrants from the Azores | 0.0 /100 | #332 | Tragic 6.7% |
| Blacks/African Americans | 0.0 /100 | #333 | Tragic 6.8% |
| Seminole | 0.0 /100 | #334 | Tragic 6.8% |
| Ottawa | 0.0 /100 | #335 | Tragic 6.8% |
| Chickasaw | 0.0 /100 | #336 | Tragic 6.8% |
| Creek | 0.0 /100 | #337 | Tragic 6.9% |
| Iroquois | 0.0 /100 | #338 | Tragic 6.9% |
| Choctaw | 0.0 /100 | #339 | Tragic 6.9% |
| Cherokee | 0.0 /100 | #340 | Tragic 6.9% |
| Cape Verdeans | 0.0 /100 | #341 | Tragic 7.0% |
| Chippewa | 0.0 /100 | #342 | Tragic 7.1% |
| Immigrants from Cabo Verde | 0.0 /100 | #343 | Tragic 7.1% |
| Cajuns | 0.0 /100 | #344 | Tragic 7.2% |
| Tsimshian | 0.0 /100 | #345 | Tragic 7.9% |
| Puerto Ricans | 0.0 /100 | #346 | Tragic 8.3% |
Choctaw Disability Age 5 to 17 Correlation Summary
| Measurement | Choctaw Data | Disability Age 5 to 17 Data |
| Minimum | 0.081% | 1.8% |
| Maximum | 80.4% | 26.4% |
| Range | 80.3% | 24.6% |
| Mean | 18.8% | 10.3% |
| Median | 15.7% | 9.2% |
| Interquartile 25% (IQ1) | 7.8% | 7.2% |
| Interquartile 75% (IQ3) | 25.3% | 13.3% |
| Interquartile Range (IQR) | 17.5% | 6.1% |
| Standard Deviation (Sample) | 16.6% | 4.8% |
| Standard Deviation (Population) | 16.5% | 4.8% |
Correlation Details
| Choctaw Percentile | Sample Size | Disability Age 5 to 17 |
[ 0.0% - 0.5% ] 0.081% | 255,096,991 | 5.9% |
[ 0.5% - 1.0% ] 0.70% | 6,273,266 | 6.8% |
[ 1.0% - 1.5% ] 1.22% | 2,959,617 | 6.9% |
[ 1.5% - 2.0% ] 1.70% | 1,601,045 | 7.2% |
[ 2.0% - 2.5% ] 2.17% | 546,618 | 8.0% |
[ 2.5% - 3.0% ] 2.59% | 395,323 | 6.5% |
[ 3.0% - 3.5% ] 3.18% | 202,142 | 7.2% |
[ 3.5% - 4.0% ] 3.67% | 153,857 | 7.3% |
[ 4.0% - 4.5% ] 4.07% | 100,059 | 7.6% |
[ 4.5% - 5.0% ] 4.55% | 42,440 | 9.6% |
[ 5.0% - 5.5% ] 5.09% | 29,501 | 10.4% |
[ 5.5% - 6.0% ] 5.62% | 32,126 | 8.5% |
[ 6.0% - 6.5% ] 6.12% | 22,421 | 8.7% |
[ 6.5% - 7.0% ] 6.70% | 95,083 | 9.4% |
[ 7.0% - 7.5% ] 7.20% | 35,514 | 9.7% |
[ 7.5% - 8.0% ] 7.59% | 23,706 | 6.5% |
[ 8.0% - 8.5% ] 8.09% | 12,621 | 12.3% |
[ 8.5% - 9.0% ] 8.63% | 23,547 | 9.1% |
[ 9.0% - 9.5% ] 9.17% | 3,425 | 13.6% |
[ 9.5% - 10.0% ] 9.54% | 8,382 | 8.2% |
[ 9.5% - 10.0% ] 9.87% | 27,061 | 9.3% |
[ 10.5% - 11.0% ] 10.57% | 12,495 | 11.6% |
[ 10.5% - 11.0% ] 10.94% | 4,389 | 7.3% |
[ 11.0% - 11.5% ] 11.41% | 15,860 | 11.9% |
[ 12.0% - 12.5% ] 12.09% | 65,837 | 8.5% |
[ 12.5% - 13.0% ] 12.58% | 11,176 | 10.6% |
[ 12.5% - 13.0% ] 12.83% | 4,287 | 4.3% |
[ 13.0% - 13.5% ] 13.41% | 5,728 | 13.7% |
[ 14.0% - 14.5% ] 14.09% | 6,205 | 6.3% |
[ 14.0% - 14.5% ] 14.38% | 29,717 | 7.8% |
[ 15.0% - 15.5% ] 15.06% | 24,315 | 7.4% |
[ 15.0% - 15.5% ] 15.41% | 863 | 26.4% |
[ 15.5% - 16.0% ] 15.96% | 3,984 | 8.8% |
[ 16.5% - 17.0% ] 16.55% | 17,945 | 11.3% |
[ 16.5% - 17.0% ] 16.88% | 14,087 | 18.6% |
[ 17.0% - 17.5% ] 17.36% | 7,640 | 14.0% |
[ 17.5% - 18.0% ] 17.79% | 9,159 | 14.0% |
[ 18.0% - 18.5% ] 18.28% | 9,031 | 9.6% |
[ 18.5% - 19.0% ] 18.90% | 127 | 8.0% |
[ 19.0% - 19.5% ] 19.45% | 45,462 | 6.6% |
[ 19.5% - 20.0% ] 19.93% | 3,869 | 7.0% |
[ 20.0% - 20.5% ] 20.36% | 7,562 | 10.6% |
[ 20.5% - 21.0% ] 20.65% | 2,567 | 15.8% |
[ 21.0% - 21.5% ] 21.44% | 1,208 | 18.6% |
[ 21.5% - 22.0% ] 21.75% | 11,047 | 7.8% |
[ 22.5% - 23.0% ] 22.95% | 4,021 | 12.9% |
[ 23.0% - 23.5% ] 23.37% | 2,045 | 8.9% |
[ 25.0% - 25.5% ] 25.01% | 3,327 | 5.2% |
[ 25.5% - 26.0% ] 25.68% | 296 | 2.7% |
[ 26.5% - 27.0% ] 26.83% | 2,602 | 11.3% |
[ 27.0% - 27.5% ] 27.25% | 1,222 | 2.9% |
[ 27.5% - 28.0% ] 27.76% | 1,974 | 9.2% |
[ 28.0% - 28.5% ] 28.36% | 871 | 1.8% |
[ 29.0% - 29.5% ] 29.15% | 1,187 | 13.0% |
[ 30.0% - 30.5% ] 30.18% | 1,196 | 15.9% |
[ 32.0% - 32.5% ] 32.21% | 447 | 15.3% |
[ 32.5% - 33.0% ] 32.51% | 526 | 14.5% |
[ 33.0% - 33.5% ] 33.33% | 75 | 23.5% |
[ 35.5% - 36.0% ] 35.58% | 579 | 14.6% |
[ 36.5% - 37.0% ] 36.54% | 156 | 7.4% |
[ 37.5% - 38.0% ] 38.00% | 200 | 14.0% |
[ 75.0% - 75.5% ] 75.03% | 4,298 | 1.9% |
[ 79.5% - 80.0% ] 79.76% | 573 | 21.4% |
[ 80.0% - 80.5% ] 80.35% | 514 | 14.4% |