Immigrants from Fiji Disability Age 5 to 17

COMPARE

Immigrants from Fiji
Race
Ancestry
AfghanAfricanAlaska NativeAlaskan AthabascanAlbanianAleutAlsatianAmericanApacheArabArapahoArgentineanArmenianAssyrian/Chaldean/SyriacAustralianAustrianBahamianBangladeshiBarbadianBasqueBelgianBelizeanBermudanBhutaneseBlackfeetBolivianBrazilianBritishBritish West IndianBulgarianBurmeseCajunCambodianCanadianCape VerdeanCarpatho RusynCelticCentral AmericanCentral American IndianCherokeeCheyenneChickasawChileanChineseChippewaChoctawColombianColvilleComancheCosta RicanCreeCreekCroatianCrowCubanCypriotCzechCzechoslovakianDanishDelawareDominicanDutchDutch West IndianEastern EuropeanEcuadorianEgyptianEnglishEstonianEthiopianEuropeanFijianFilipinoFinnishFrenchFrench American IndianFrench CanadianGermanGerman RussianGhanaianGreekGuamanian/ChamorroGuatemalanGuyaneseHaitianHmongHonduranHopiHoumaHungarianIcelanderIndian (Asian)IndonesianInupiatIranianIraqiIrishIroquoisIsraeliItalianJamaicanJapaneseJordanianKenyanKiowaKoreanLaotianLatvianLebaneseLiberianLithuanianLumbeeLuxembourgerMacedonianMalaysianMalteseMarshalleseMenomineeMexicanMexican American IndianMongolianMoroccanNative HawaiianNavajoNepaleseNew ZealanderNicaraguanNigerianNorthern EuropeanNorwegianOkinawanOsageOttawaPaiutePakistaniPalestinianPanamanianParaguayanPennsylvania GermanPeruvianPimaPolishPortuguesePotawatomiPuebloPuerto RicanPuget Sound SalishRomanianRussianSalvadoranSamoanScandinavianScotch-IrishScottishSeminoleSenegaleseSerbianShoshoneSierra LeoneanSiouxSlavicSlovakSloveneSomaliSouth AfricanSouth AmericanSouth American IndianSoviet UnionSpaniardSpanishSpanish AmericanSpanish American IndianSri LankanSubsaharan AfricanSudaneseSwedishSwissSyrianTaiwaneseThaiTlingit-HaidaTohono O'OdhamTonganTrinidadian and TobagonianTsimshianTurkishU.S. Virgin IslanderUgandanUkrainianUruguayanUteVenezuelanVietnameseWelshWest IndianYakamaYaquiYugoslavianYumanYup'ikZimbabwean
Immigration
NonimmigrantsImmigrantsAfghanistanAfricaAlbaniaArgentinaArmeniaAsiaAustraliaAustriaBahamasBangladeshBarbadosBelarusBelgiumBelizeBoliviaBosnia and HerzegovinaBrazilBulgariaBurma/MyanmarCabo VerdeCambodiaCameroonCanadaCaribbeanCentral AmericaChileChinaColombiaCongoCosta RicaCroatiaCubaCzechoslovakiaDenmarkDominicaDominican RepublicEastern AfricaEastern AsiaEastern EuropeEcuadorEgyptEl SalvadorEnglandEritreaEthiopiaEuropeFijiFranceGermanyGhanaGreeceGrenadaGuatemalaGuyanaHaitiHondurasHong KongHungaryIndiaIndonesiaIranIraqIrelandIsraelItalyJamaicaJapanJordanKazakhstanKenyaKoreaKuwaitLaosLatin AmericaLatviaLebanonLiberiaLithuaniaMalaysiaMexicoMicronesiaMiddle AfricaMoldovaMoroccoNepalNetherlandsNicaraguaNigeriaNorth AmericaNorth MacedoniaNorthern AfricaNorthern EuropeNorwayOceaniaPakistanPanamaPeruPhilippinesPolandPortugalRomaniaRussiaSaudi ArabiaScotlandSenegalSerbiaSierra LeoneSingaporeSomaliaSouth AfricaSouth AmericaSouth Central AsiaSouth Eastern AsiaSouthern EuropeSpainSri LankaSt. Vincent and the GrenadinesSudanSwedenSwitzerlandSyriaTaiwanThailandTrinidad and TobagoTurkeyUgandaUkraineUruguayUzbekistanVenezuelaVietnamWest IndiesWestern AfricaWestern AsiaWestern EuropeYemenZaireZimbabweAzores
Select to Compare
Race
Ancestry
AfghanAfricanAlaska NativeAlaskan AthabascanAlbanianAleutAlsatianAmericanApacheArabArapahoArgentineanArmenianAssyrian/Chaldean/SyriacAustralianAustrianBahamianBangladeshiBarbadianBasqueBelgianBelizeanBermudanBhutaneseBlackfeetBolivianBrazilianBritishBritish West IndianBulgarianBurmeseCajunCambodianCanadianCape VerdeanCarpatho RusynCelticCentral AmericanCentral American IndianCherokeeCheyenneChickasawChileanChineseChippewaChoctawColombianColvilleComancheCosta RicanCreeCreekCroatianCrowCubanCypriotCzechCzechoslovakianDanishDelawareDominicanDutchDutch West IndianEastern EuropeanEcuadorianEgyptianEnglishEstonianEthiopianEuropeanFijianFilipinoFinnishFrenchFrench American IndianFrench CanadianGermanGerman RussianGhanaianGreekGuamanian/ChamorroGuatemalanGuyaneseHaitianHmongHonduranHopiHoumaHungarianIcelanderIndian (Asian)IndonesianInupiatIranianIraqiIrishIroquoisIsraeliItalianJamaicanJapaneseJordanianKenyanKiowaKoreanLaotianLatvianLebaneseLiberianLithuanianLumbeeLuxembourgerMacedonianMalaysianMalteseMarshalleseMenomineeMexicanMexican American IndianMongolianMoroccanNative HawaiianNavajoNepaleseNew ZealanderNicaraguanNigerianNorthern EuropeanNorwegianOkinawanOsageOttawaPaiutePakistaniPalestinianPanamanianParaguayanPennsylvania GermanPeruvianPimaPolishPortuguesePotawatomiPuebloPuerto RicanPuget Sound SalishRomanianRussianSalvadoranSamoanScandinavianScotch-IrishScottishSeminoleSenegaleseSerbianShoshoneSierra LeoneanSiouxSlavicSlovakSloveneSomaliSouth AfricanSouth AmericanSouth American IndianSoviet UnionSpaniardSpanishSpanish AmericanSpanish American IndianSri LankanSubsaharan AfricanSudaneseSwedishSwissSyrianTaiwaneseThaiTlingit-HaidaTohono O'OdhamTonganTrinidadian and TobagonianTsimshianTurkishU.S. Virgin IslanderUgandanUkrainianUruguayanUteVenezuelanVietnameseWelshWest IndianYakamaYaquiYugoslavianYumanYup'ikZimbabwean
Immigration
NonimmigrantsImmigrantsAfghanistanAfricaAlbaniaArgentinaArmeniaAsiaAustraliaAustriaBahamasBangladeshBarbadosBelarusBelgiumBelizeBoliviaBosnia and HerzegovinaBrazilBulgariaBurma/MyanmarCabo VerdeCambodiaCameroonCanadaCaribbeanCentral AmericaChileChinaColombiaCongoCosta RicaCroatiaCubaCzechoslovakiaDenmarkDominicaDominican RepublicEastern AfricaEastern AsiaEastern EuropeEcuadorEgyptEl SalvadorEnglandEritreaEthiopiaEuropeFranceGermanyGhanaGreeceGrenadaGuatemalaGuyanaHaitiHondurasHong KongHungaryIndiaIndonesiaIranIraqIrelandIsraelItalyJamaicaJapanJordanKazakhstanKenyaKoreaKuwaitLaosLatin AmericaLatviaLebanonLiberiaLithuaniaMalaysiaMexicoMicronesiaMiddle AfricaMoldovaMoroccoNepalNetherlandsNicaraguaNigeriaNorth AmericaNorth MacedoniaNorthern AfricaNorthern EuropeNorwayOceaniaPakistanPanamaPeruPhilippinesPolandPortugalRomaniaRussiaSaudi ArabiaScotlandSenegalSerbiaSierra LeoneSingaporeSomaliaSouth AfricaSouth AmericaSouth Central AsiaSouth Eastern AsiaSouthern EuropeSpainSri LankaSt. Vincent and the GrenadinesSudanSwedenSwitzerlandSyriaTaiwanThailandTrinidad and TobagoTurkeyUgandaUkraineUruguayUzbekistanVenezuelaVietnamWest IndiesWestern AfricaWestern AsiaWestern EuropeYemenZaireZimbabweAzores
Disability Age 5 to 17
Income
Poverty
Unemployment
Labor Participation
Family Structure
Vehicle Availability
Education Level
Disability

Immigrants from Fiji Disability Age 5 to 17
Exceptional

5.1%
DISABILITY | AGE 5 TO 17
99.9/ 100
METRIC RATING
52nd/ 347
METRIC RANK

Immigrants from Fiji Disability Age 5 to 17 Correlation Chart

The statistical analysis conducted on geographies consisting of 93,508,767 people shows a poor positive correlation between the proportion of Immigrants from Fiji and percentage of population with a disability between the ages 5 and 17 in the United States with a correlation coefficient (R) of 0.154 and weighted average of 5.1%. On average, for every 1% (one percent) increase in Immigrants from Fiji within a typical geography, there is an increase of 0.21% in percentage of population with a disability between the ages 5 and 17.
Immigrants from Fiji Disability Age 5 to 17
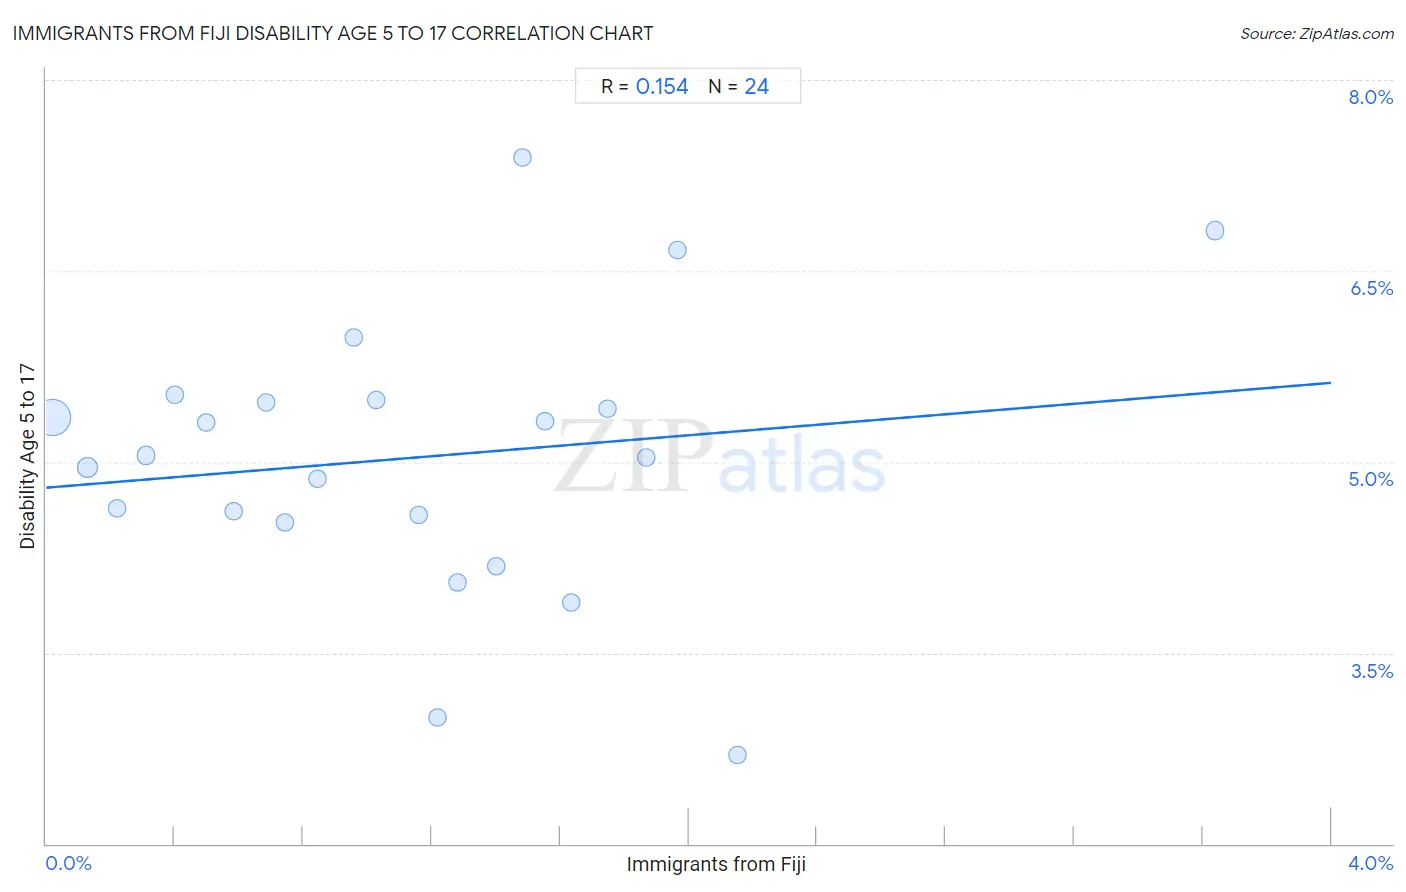
It is essential to understand that the correlation between the percentage of Immigrants from Fiji and percentage of population with a disability between the ages 5 and 17 does not imply a direct cause-and-effect relationship. It remains uncertain whether the presence of Immigrants from Fiji influences an upward or downward trend in the level of percentage of population with a disability between the ages 5 and 17 within an area, or if Immigrants from Fiji simply ended up residing in those areas with higher or lower levels of percentage of population with a disability between the ages 5 and 17 due to other factors.

Demographics Similar to Immigrants from Fiji by Disability Age 5 to 17

In terms of disability age 5 to 17, the demographic groups most similar to Immigrants from Fiji are Immigrants from Lithuania (5.1%, a difference of 0.050%), Paraguayan (5.1%, a difference of 0.080%), Turkish (5.1%, a difference of 0.090%), Laotian (5.1%, a difference of 0.13%), and Immigrants from Turkey (5.1%, a difference of 0.14%).
DemographicsRating | RankDisability Age 5 to 17
Tongans
100.0
/100
|
#45
Exceptional
5.0%
Assyrians/Chaldeans/Syriacs
100.0
/100
|
#46
Exceptional
5.0%
Vietnamese
100.0
/100
|
#47
Exceptional
5.1%
Koreans
100.0
/100
|
#48
Exceptional
5.1%
Immigrants from Western Asia
100.0
/100
|
#49
Exceptional
5.1%
Argentineans
99.9
/100
|
#50
Exceptional
5.1%
Turks
99.9
/100
|
#51
Exceptional
5.1%
Immigrants from Fiji
99.9
/100
|
#52
Exceptional
5.1%
Immigrants from Lithuania
99.9
/100
|
#53
Exceptional
5.1%
Paraguayans
99.9
/100
|
#54
Exceptional
5.1%
Laotians
99.9
/100
|
#55
Exceptional
5.1%
Immigrants from Turkey
99.9
/100
|
#56
Exceptional
5.1%
Immigrants from Poland
99.9
/100
|
#57
Exceptional
5.1%
Immigrants from Ukraine
99.9
/100
|
#58
Exceptional
5.1%
Immigrants from North Macedonia
99.9
/100
|
#59
Exceptional
5.1%

Immigrants from Fiji Disability Age 5 to 17 Correlation Summary

MeasurementImmigrants from Fiji DataDisability Age 5 to 17 Data
Minimum0.020%2.7%
Maximum3.6%7.4%
Range3.6%4.7%
Mean1.1%5.0%
Median1.1%5.0%
Interquartile 25% (IQ1)0.54%4.6%
Interquartile 75% (IQ3)1.6%5.5%
Interquartile Range (IQR)1.1%0.92%
Standard Deviation (Sample)0.81%1.1%
Standard Deviation (Population)0.79%1.1%

Correlation Details

Immigrants from Fiji PercentileSample SizeDisability Age 5 to 17
[
0.0%
-
0.5%
]
0.020%
73,416,9685.3%
[
0.0%
-
0.5%
]
0.13%
9,735,6945.0%
[
0.0%
-
0.5%
]
0.22%
3,214,7044.6%
[
0.0%
-
0.5%
]
0.31%
1,942,9385.1%
[
0.0%
-
0.5%
]
0.40%
1,493,2115.5%
[
0.0%
-
0.5%
]
0.50%
200,5405.3%
[
0.5%
-
1.0%
]
0.58%
522,9994.6%
[
0.5%
-
1.0%
]
0.68%
644,9485.5%
[
0.5%
-
1.0%
]
0.74%
380,2034.5%
[
0.5%
-
1.0%
]
0.84%
174,6074.9%
[
0.5%
-
1.0%
]
0.96%
116,4986.0%
[
1.0%
-
1.5%
]
1.03%
279,3645.5%
[
1.0%
-
1.5%
]
1.16%
603,9764.6%
[
1.0%
-
1.5%
]
1.22%
14,2913.0%
[
1.0%
-
1.5%
]
1.28%
199,2484.1%
[
1.0%
-
1.5%
]
1.40%
110,5724.2%
[
1.0%
-
1.5%
]
1.48%
83,7237.4%
[
1.5%
-
2.0%
]
1.55%
83,6925.3%
[
1.5%
-
2.0%
]
1.63%
77,7123.9%
[
1.5%
-
2.0%
]
1.75%
8,9205.4%
[
1.5%
-
2.0%
]
1.87%
5,4115.0%
[
1.5%
-
2.0%
]
1.96%
60,8506.7%
[
2.0%
-
2.5%
]
2.15%
41,5992.7%
[
3.5%
-
4.0%
]
3.64%
96,0996.8%