Immigrants from Malaysia Disability Age 5 to 17

COMPARE

Immigrants from Malaysia
Race
Ancestry
AfghanAfricanAlaska NativeAlaskan AthabascanAlbanianAleutAlsatianAmericanApacheArabArapahoArgentineanArmenianAssyrian/Chaldean/SyriacAustralianAustrianBahamianBangladeshiBarbadianBasqueBelgianBelizeanBermudanBhutaneseBlackfeetBolivianBrazilianBritishBritish West IndianBulgarianBurmeseCajunCambodianCanadianCape VerdeanCarpatho RusynCelticCentral AmericanCentral American IndianCherokeeCheyenneChickasawChileanChineseChippewaChoctawColombianColvilleComancheCosta RicanCreeCreekCroatianCrowCubanCypriotCzechCzechoslovakianDanishDelawareDominicanDutchDutch West IndianEastern EuropeanEcuadorianEgyptianEnglishEstonianEthiopianEuropeanFijianFilipinoFinnishFrenchFrench American IndianFrench CanadianGermanGerman RussianGhanaianGreekGuamanian/ChamorroGuatemalanGuyaneseHaitianHmongHonduranHopiHoumaHungarianIcelanderIndian (Asian)IndonesianInupiatIranianIraqiIrishIroquoisIsraeliItalianJamaicanJapaneseJordanianKenyanKiowaKoreanLaotianLatvianLebaneseLiberianLithuanianLumbeeLuxembourgerMacedonianMalaysianMalteseMarshalleseMenomineeMexicanMexican American IndianMongolianMoroccanNative HawaiianNavajoNepaleseNew ZealanderNicaraguanNigerianNorthern EuropeanNorwegianOkinawanOsageOttawaPaiutePakistaniPalestinianPanamanianParaguayanPennsylvania GermanPeruvianPimaPolishPortuguesePotawatomiPuebloPuerto RicanPuget Sound SalishRomanianRussianSalvadoranSamoanScandinavianScotch-IrishScottishSeminoleSenegaleseSerbianShoshoneSierra LeoneanSiouxSlavicSlovakSloveneSomaliSouth AfricanSouth AmericanSouth American IndianSoviet UnionSpaniardSpanishSpanish AmericanSpanish American IndianSri LankanSubsaharan AfricanSudaneseSwedishSwissSyrianTaiwaneseThaiTlingit-HaidaTohono O'OdhamTonganTrinidadian and TobagonianTsimshianTurkishU.S. Virgin IslanderUgandanUkrainianUruguayanUteVenezuelanVietnameseWelshWest IndianYakamaYaquiYugoslavianYumanYup'ikZimbabwean
Immigration
NonimmigrantsImmigrantsAfghanistanAfricaAlbaniaArgentinaArmeniaAsiaAustraliaAustriaBahamasBangladeshBarbadosBelarusBelgiumBelizeBoliviaBosnia and HerzegovinaBrazilBulgariaBurma/MyanmarCabo VerdeCambodiaCameroonCanadaCaribbeanCentral AmericaChileChinaColombiaCongoCosta RicaCroatiaCubaCzechoslovakiaDenmarkDominicaDominican RepublicEastern AfricaEastern AsiaEastern EuropeEcuadorEgyptEl SalvadorEnglandEritreaEthiopiaEuropeFijiFranceGermanyGhanaGreeceGrenadaGuatemalaGuyanaHaitiHondurasHong KongHungaryIndiaIndonesiaIranIraqIrelandIsraelItalyJamaicaJapanJordanKazakhstanKenyaKoreaKuwaitLaosLatin AmericaLatviaLebanonLiberiaLithuaniaMalaysiaMexicoMicronesiaMiddle AfricaMoldovaMoroccoNepalNetherlandsNicaraguaNigeriaNorth AmericaNorth MacedoniaNorthern AfricaNorthern EuropeNorwayOceaniaPakistanPanamaPeruPhilippinesPolandPortugalRomaniaRussiaSaudi ArabiaScotlandSenegalSerbiaSierra LeoneSingaporeSomaliaSouth AfricaSouth AmericaSouth Central AsiaSouth Eastern AsiaSouthern EuropeSpainSri LankaSt. Vincent and the GrenadinesSudanSwedenSwitzerlandSyriaTaiwanThailandTrinidad and TobagoTurkeyUgandaUkraineUruguayUzbekistanVenezuelaVietnamWest IndiesWestern AfricaWestern AsiaWestern EuropeYemenZaireZimbabweAzores
Select to Compare
Race
Ancestry
AfghanAfricanAlaska NativeAlaskan AthabascanAlbanianAleutAlsatianAmericanApacheArabArapahoArgentineanArmenianAssyrian/Chaldean/SyriacAustralianAustrianBahamianBangladeshiBarbadianBasqueBelgianBelizeanBermudanBhutaneseBlackfeetBolivianBrazilianBritishBritish West IndianBulgarianBurmeseCajunCambodianCanadianCape VerdeanCarpatho RusynCelticCentral AmericanCentral American IndianCherokeeCheyenneChickasawChileanChineseChippewaChoctawColombianColvilleComancheCosta RicanCreeCreekCroatianCrowCubanCypriotCzechCzechoslovakianDanishDelawareDominicanDutchDutch West IndianEastern EuropeanEcuadorianEgyptianEnglishEstonianEthiopianEuropeanFijianFilipinoFinnishFrenchFrench American IndianFrench CanadianGermanGerman RussianGhanaianGreekGuamanian/ChamorroGuatemalanGuyaneseHaitianHmongHonduranHopiHoumaHungarianIcelanderIndian (Asian)IndonesianInupiatIranianIraqiIrishIroquoisIsraeliItalianJamaicanJapaneseJordanianKenyanKiowaKoreanLaotianLatvianLebaneseLiberianLithuanianLumbeeLuxembourgerMacedonianMalaysianMalteseMarshalleseMenomineeMexicanMexican American IndianMongolianMoroccanNative HawaiianNavajoNepaleseNew ZealanderNicaraguanNigerianNorthern EuropeanNorwegianOkinawanOsageOttawaPaiutePakistaniPalestinianPanamanianParaguayanPennsylvania GermanPeruvianPimaPolishPortuguesePotawatomiPuebloPuerto RicanPuget Sound SalishRomanianRussianSalvadoranSamoanScandinavianScotch-IrishScottishSeminoleSenegaleseSerbianShoshoneSierra LeoneanSiouxSlavicSlovakSloveneSomaliSouth AfricanSouth AmericanSouth American IndianSoviet UnionSpaniardSpanishSpanish AmericanSpanish American IndianSri LankanSubsaharan AfricanSudaneseSwedishSwissSyrianTaiwaneseThaiTlingit-HaidaTohono O'OdhamTonganTrinidadian and TobagonianTsimshianTurkishU.S. Virgin IslanderUgandanUkrainianUruguayanUteVenezuelanVietnameseWelshWest IndianYakamaYaquiYugoslavianYumanYup'ikZimbabwean
Immigration
NonimmigrantsImmigrantsAfghanistanAfricaAlbaniaArgentinaArmeniaAsiaAustraliaAustriaBahamasBangladeshBarbadosBelarusBelgiumBelizeBoliviaBosnia and HerzegovinaBrazilBulgariaBurma/MyanmarCabo VerdeCambodiaCameroonCanadaCaribbeanCentral AmericaChileChinaColombiaCongoCosta RicaCroatiaCubaCzechoslovakiaDenmarkDominicaDominican RepublicEastern AfricaEastern AsiaEastern EuropeEcuadorEgyptEl SalvadorEnglandEritreaEthiopiaEuropeFijiFranceGermanyGhanaGreeceGrenadaGuatemalaGuyanaHaitiHondurasHong KongHungaryIndiaIndonesiaIranIraqIrelandIsraelItalyJamaicaJapanJordanKazakhstanKenyaKoreaKuwaitLaosLatin AmericaLatviaLebanonLiberiaLithuaniaMexicoMicronesiaMiddle AfricaMoldovaMoroccoNepalNetherlandsNicaraguaNigeriaNorth AmericaNorth MacedoniaNorthern AfricaNorthern EuropeNorwayOceaniaPakistanPanamaPeruPhilippinesPolandPortugalRomaniaRussiaSaudi ArabiaScotlandSenegalSerbiaSierra LeoneSingaporeSomaliaSouth AfricaSouth AmericaSouth Central AsiaSouth Eastern AsiaSouthern EuropeSpainSri LankaSt. Vincent and the GrenadinesSudanSwedenSwitzerlandSyriaTaiwanThailandTrinidad and TobagoTurkeyUgandaUkraineUruguayUzbekistanVenezuelaVietnamWest IndiesWestern AfricaWestern AsiaWestern EuropeYemenZaireZimbabweAzores
Disability Age 5 to 17
Income
Poverty
Unemployment
Labor Participation
Family Structure
Vehicle Availability
Education Level
Disability

Immigrants from Malaysia Disability Age 5 to 17
Exceptional

5.0%
DISABILITY | AGE 5 TO 17
100.0/ 100
METRIC RATING
30th/ 347
METRIC RANK

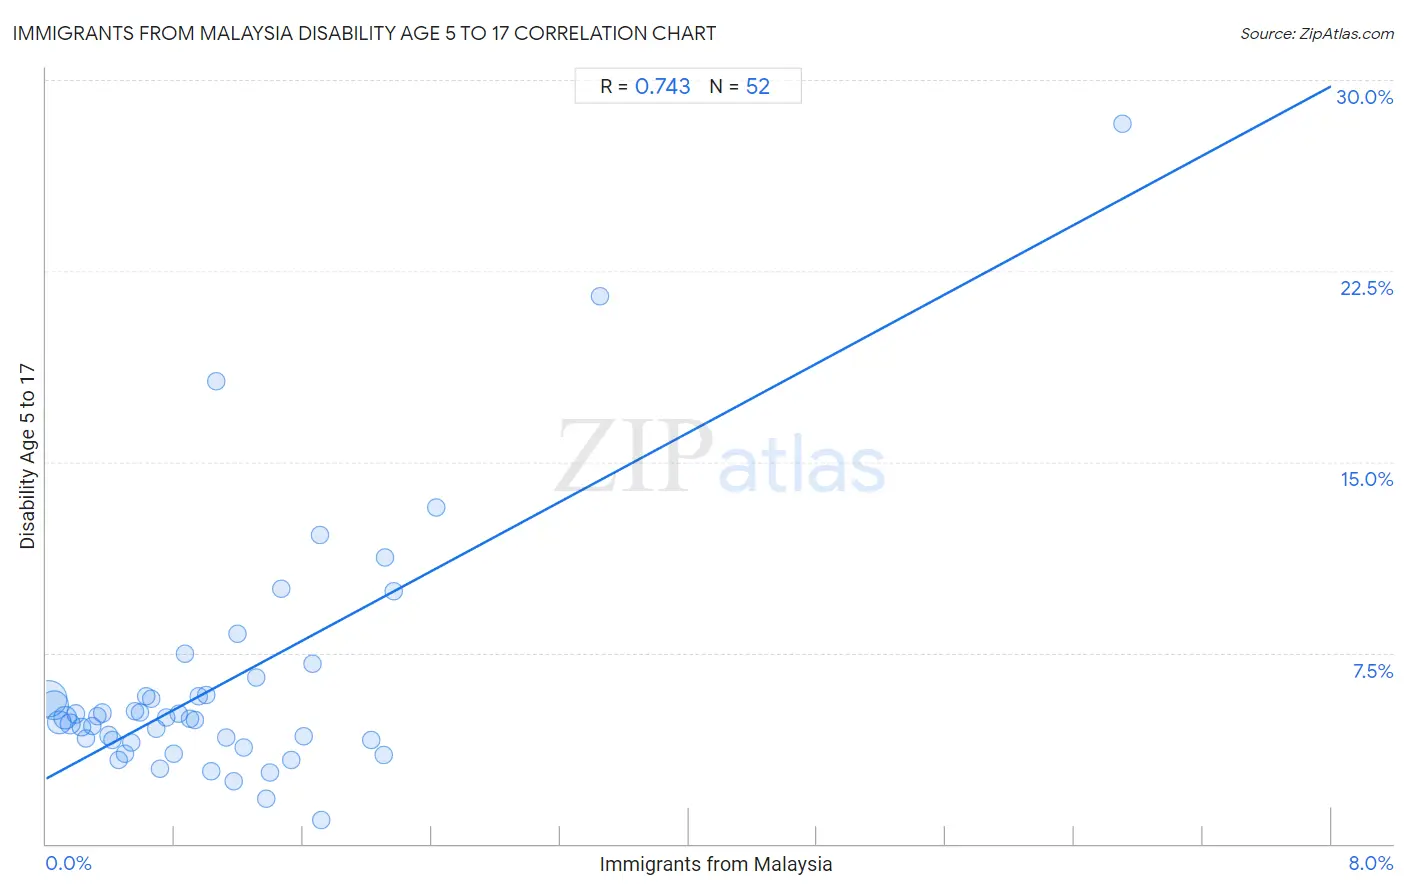
Immigrants from Malaysia Disability Age 5 to 17 Correlation Chart

The statistical analysis conducted on geographies consisting of 197,341,469 people shows a strong positive correlation between the proportion of Immigrants from Malaysia and percentage of population with a disability between the ages 5 and 17 in the United States with a correlation coefficient (R) of 0.743 and weighted average of 5.0%. On average, for every 1% (one percent) increase in Immigrants from Malaysia within a typical geography, there is an increase of 3.4% in percentage of population with a disability between the ages 5 and 17.
Immigrants from Malaysia Disability Age 5 to 17
It is essential to understand that the correlation between the percentage of Immigrants from Malaysia and percentage of population with a disability between the ages 5 and 17 does not imply a direct cause-and-effect relationship. It remains uncertain whether the presence of Immigrants from Malaysia influences an upward or downward trend in the level of percentage of population with a disability between the ages 5 and 17 within an area, or if Immigrants from Malaysia simply ended up residing in those areas with higher or lower levels of percentage of population with a disability between the ages 5 and 17 due to other factors.

Demographics Similar to Immigrants from Malaysia by Disability Age 5 to 17

In terms of disability age 5 to 17, the demographic groups most similar to Immigrants from Malaysia are Immigrants from Serbia (4.9%, a difference of 0.22%), Immigrants from Pakistan (5.0%, a difference of 0.25%), Soviet Union (5.0%, a difference of 0.28%), Immigrants from Indonesia (5.0%, a difference of 0.61%), and Immigrants from Japan (4.9%, a difference of 0.70%).
DemographicsRating | RankDisability Age 5 to 17
Immigrants from Bolivia
100.0
/100
|
#23
Exceptional
4.8%
Immigrants from Lebanon
100.0
/100
|
#24
Exceptional
4.8%
Immigrants from Asia
100.0
/100
|
#25
Exceptional
4.8%
Bhutanese
100.0
/100
|
#26
Exceptional
4.9%
Taiwanese
100.0
/100
|
#27
Exceptional
4.9%
Immigrants from Japan
100.0
/100
|
#28
Exceptional
4.9%
Immigrants from Serbia
100.0
/100
|
#29
Exceptional
4.9%
Immigrants from Malaysia
100.0
/100
|
#30
Exceptional
5.0%
Immigrants from Pakistan
100.0
/100
|
#31
Exceptional
5.0%
Soviet Union
100.0
/100
|
#32
Exceptional
5.0%
Immigrants from Indonesia
100.0
/100
|
#33
Exceptional
5.0%
Israelis
100.0
/100
|
#34
Exceptional
5.0%
Bolivians
100.0
/100
|
#35
Exceptional
5.0%
Immigrants from Egypt
100.0
/100
|
#36
Exceptional
5.0%
Immigrants from Belarus
100.0
/100
|
#37
Exceptional
5.0%

Immigrants from Malaysia Disability Age 5 to 17 Correlation Summary

MeasurementImmigrants from Malaysia DataDisability Age 5 to 17 Data
Minimum0.018%0.95%
Maximum6.7%28.3%
Range6.7%27.4%
Mean1.1%6.3%
Median0.88%4.9%
Interquartile 25% (IQ1)0.43%4.0%
Interquartile 75% (IQ3)1.4%5.8%
Interquartile Range (IQR)0.99%1.8%
Standard Deviation (Sample)1.1%4.9%
Standard Deviation (Population)1.1%4.8%

Correlation Details

Immigrants from Malaysia PercentileSample SizeDisability Age 5 to 17
[
0.0%
-
0.5%
]
0.018%
81,169,1805.7%
[
0.0%
-
0.5%
]
0.047%
46,572,7285.5%
[
0.0%
-
0.5%
]
0.081%
22,154,8234.8%
[
0.0%
-
0.5%
]
0.12%
19,964,2235.0%
[
0.0%
-
0.5%
]
0.15%
9,198,0464.7%
[
0.0%
-
0.5%
]
0.18%
3,776,7135.1%
[
0.0%
-
0.5%
]
0.22%
3,873,5794.6%
[
0.0%
-
0.5%
]
0.25%
2,259,4154.1%
[
0.0%
-
0.5%
]
0.28%
1,741,3354.6%
[
0.0%
-
0.5%
]
0.32%
1,003,3445.0%
[
0.0%
-
0.5%
]
0.35%
952,1805.1%
[
0.0%
-
0.5%
]
0.39%
880,2104.2%
[
0.0%
-
0.5%
]
0.42%
475,0574.1%
[
0.0%
-
0.5%
]
0.45%
463,2623.3%
[
0.0%
-
0.5%
]
0.49%
262,0553.5%
[
0.5%
-
1.0%
]
0.53%
224,2364.0%
[
0.5%
-
1.0%
]
0.55%
298,1745.2%
[
0.5%
-
1.0%
]
0.58%
232,4515.2%
[
0.5%
-
1.0%
]
0.62%
160,3905.8%
[
0.5%
-
1.0%
]
0.65%
253,3735.7%
[
0.5%
-
1.0%
]
0.69%
252,8204.5%
[
0.5%
-
1.0%
]
0.71%
149,4412.9%
[
0.5%
-
1.0%
]
0.75%
162,4944.9%
[
0.5%
-
1.0%
]
0.80%
143,0203.5%
[
0.5%
-
1.0%
]
0.82%
41,4035.1%
[
0.5%
-
1.0%
]
0.86%
143,7527.5%
[
0.5%
-
1.0%
]
0.89%
38,5354.9%
[
0.5%
-
1.0%
]
0.93%
53,8654.9%
[
0.5%
-
1.0%
]
0.95%
27,7095.8%
[
0.5%
-
1.0%
]
0.99%
23,9455.8%
[
1.0%
-
1.5%
]
1.03%
29,9982.9%
[
1.0%
-
1.5%
]
1.06%
3,96518.2%
[
1.0%
-
1.5%
]
1.12%
27,5764.2%
[
1.0%
-
1.5%
]
1.17%
20,6792.4%
[
1.0%
-
1.5%
]
1.19%
6748.3%
[
1.0%
-
1.5%
]
1.23%
102,9863.8%
[
1.0%
-
1.5%
]
1.31%
44,6556.5%
[
1.0%
-
1.5%
]
1.37%
9,5121.8%
[
1.0%
-
1.5%
]
1.39%
5,9002.8%
[
1.0%
-
1.5%
]
1.46%
3,82710.0%
[
1.5%
-
2.0%
]
1.52%
9,1843.3%
[
1.5%
-
2.0%
]
1.61%
8,8434.2%
[
1.5%
-
2.0%
]
1.66%
11,8057.1%
[
1.5%
-
2.0%
]
1.70%
5,92812.1%
[
1.5%
-
2.0%
]
1.71%
27,0100.95%
[
2.0%
-
2.5%
]
2.02%
6,9164.1%
[
2.0%
-
2.5%
]
2.10%
42,6213.5%
[
2.0%
-
2.5%
]
2.11%
9,28211.3%
[
2.0%
-
2.5%
]
2.16%
15,6679.9%
[
2.0%
-
2.5%
]
2.42%
1,03113.2%
[
3.0%
-
3.5%
]
3.45%
14521.5%
[
6.5%
-
7.0%
]
6.70%
1,50728.3%