U.S. Virgin Islander Disability Age 5 to 17
COMPARE
U.S. Virgin Islander
Select to Compare
Disability Age 5 to 17
U.S. Virgin Islander Disability Age 5 to 17
6.3%
DISABILITY | AGE 5 TO 17
0.0/ 100
METRIC RATING
301st/ 347
METRIC RANK
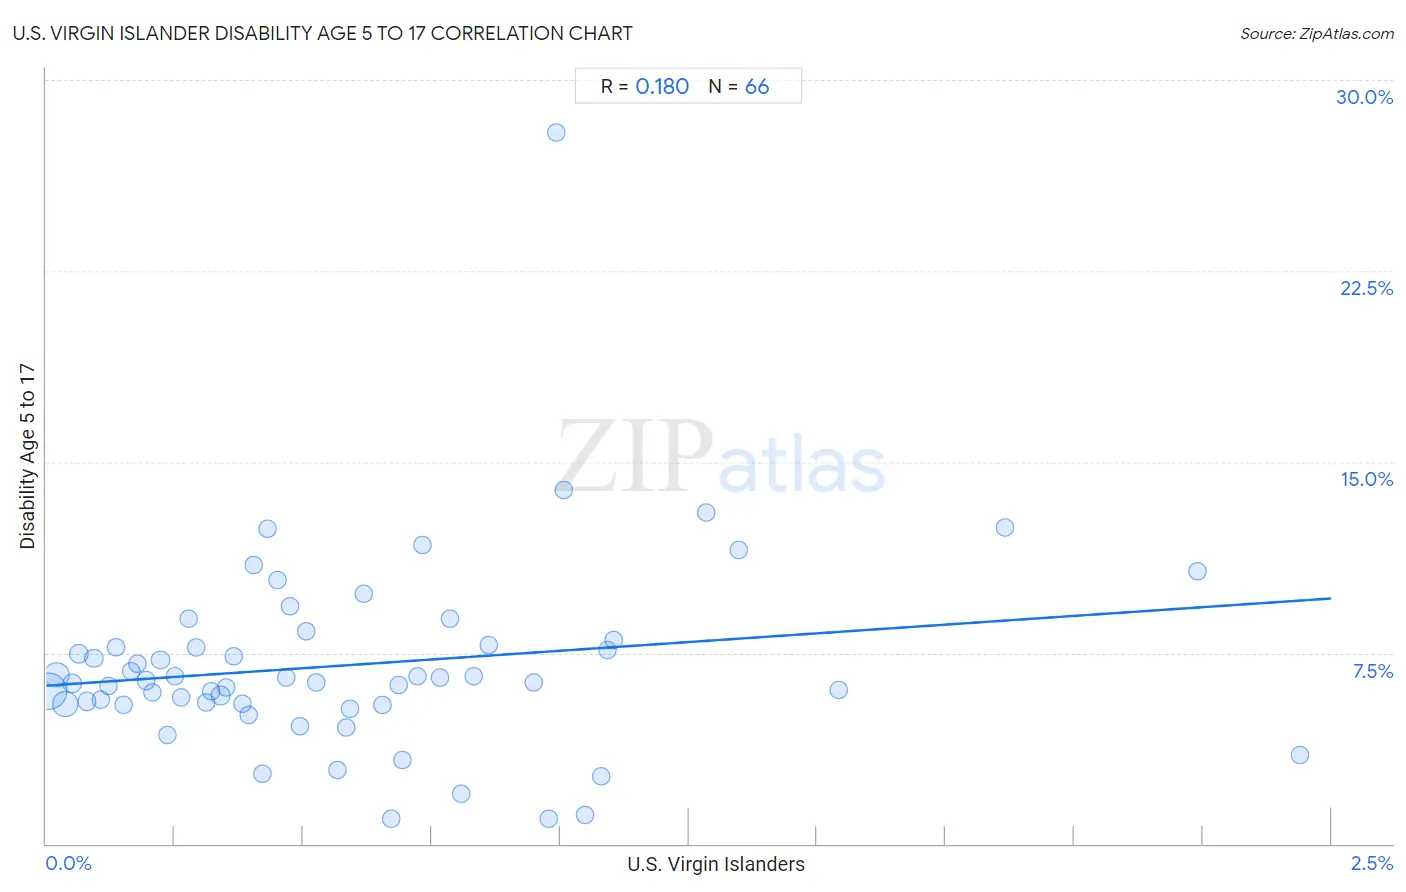
U.S. Virgin Islander Disability Age 5 to 17 Correlation Chart
The statistical analysis conducted on geographies consisting of 87,363,658 people shows a poor positive correlation between the proportion of U.S. Virgin Islanders and percentage of population with a disability between the ages 5 and 17 in the United States with a correlation coefficient (R) of 0.180 and weighted average of 6.3%. On average, for every 1% (one percent) increase in U.S. Virgin Islanders within a typical geography, there is an increase of 1.4% in percentage of population with a disability between the ages 5 and 17.
It is essential to understand that the correlation between the percentage of U.S. Virgin Islanders and percentage of population with a disability between the ages 5 and 17 does not imply a direct cause-and-effect relationship. It remains uncertain whether the presence of U.S. Virgin Islanders influences an upward or downward trend in the level of percentage of population with a disability between the ages 5 and 17 within an area, or if U.S. Virgin Islanders simply ended up residing in those areas with higher or lower levels of percentage of population with a disability between the ages 5 and 17 due to other factors.
Demographics Similar to U.S. Virgin Islanders by Disability Age 5 to 17
In terms of disability age 5 to 17, the demographic groups most similar to U.S. Virgin Islanders are Carpatho Rusyn (6.3%, a difference of 0.020%), Welsh (6.3%, a difference of 0.14%), Lumbee (6.2%, a difference of 0.29%), Celtic (6.3%, a difference of 0.33%), and Immigrants from Bahamas (6.2%, a difference of 0.36%).
| Demographics | Rating | Rank | Disability Age 5 to 17 |
| Irish | 0.0 /100 | #294 | Tragic 6.2% |
| Cree | 0.0 /100 | #295 | Tragic 6.2% |
| Spanish Americans | 0.0 /100 | #296 | Tragic 6.2% |
| Immigrants from Bahamas | 0.0 /100 | #297 | Tragic 6.2% |
| Lumbee | 0.0 /100 | #298 | Tragic 6.2% |
| Welsh | 0.0 /100 | #299 | Tragic 6.3% |
| Carpatho Rusyns | 0.0 /100 | #300 | Tragic 6.3% |
| U.S. Virgin Islanders | 0.0 /100 | #301 | Tragic 6.3% |
| Celtics | 0.0 /100 | #302 | Tragic 6.3% |
| Yakama | 0.0 /100 | #303 | Tragic 6.3% |
| Senegalese | 0.0 /100 | #304 | Tragic 6.3% |
| Natives/Alaskans | 0.0 /100 | #305 | Tragic 6.3% |
| Nonimmigrants | 0.0 /100 | #306 | Tragic 6.3% |
| Bahamians | 0.0 /100 | #307 | Tragic 6.3% |
| Scotch-Irish | 0.0 /100 | #308 | Tragic 6.3% |
U.S. Virgin Islander Disability Age 5 to 17 Correlation Summary
| Measurement | U.S. Virgin Islander Data | Disability Age 5 to 17 Data |
| Minimum | 0.0060% | 0.97% |
| Maximum | 2.4% | 27.9% |
| Range | 2.4% | 27.0% |
| Mean | 0.60% | 7.0% |
| Median | 0.47% | 6.4% |
| Interquartile 25% (IQ1) | 0.24% | 5.5% |
| Interquartile 75% (IQ3) | 0.81% | 7.8% |
| Interquartile Range (IQR) | 0.57% | 2.3% |
| Standard Deviation (Sample) | 0.50% | 3.8% |
| Standard Deviation (Population) | 0.50% | 3.8% |
Correlation Details
| U.S. Virgin Islander Percentile | Sample Size | Disability Age 5 to 17 |
[ 0.0% - 0.5% ] 0.0060% | 38,650,694 | 6.0% |
[ 0.0% - 0.5% ] 0.020% | 13,785,726 | 6.6% |
[ 0.0% - 0.5% ] 0.036% | 14,364,905 | 5.5% |
[ 0.0% - 0.5% ] 0.050% | 3,631,330 | 6.3% |
[ 0.0% - 0.5% ] 0.064% | 2,286,273 | 7.5% |
[ 0.0% - 0.5% ] 0.079% | 2,216,121 | 5.6% |
[ 0.0% - 0.5% ] 0.093% | 1,892,764 | 7.3% |
[ 0.0% - 0.5% ] 0.11% | 1,648,764 | 5.7% |
[ 0.0% - 0.5% ] 0.12% | 1,078,039 | 6.2% |
[ 0.0% - 0.5% ] 0.14% | 1,037,475 | 7.7% |
[ 0.0% - 0.5% ] 0.15% | 630,635 | 5.4% |
[ 0.0% - 0.5% ] 0.16% | 377,880 | 6.8% |
[ 0.0% - 0.5% ] 0.18% | 295,741 | 7.1% |
[ 0.0% - 0.5% ] 0.19% | 334,520 | 6.4% |
[ 0.0% - 0.5% ] 0.21% | 477,225 | 5.9% |
[ 0.0% - 0.5% ] 0.22% | 490,125 | 7.2% |
[ 0.0% - 0.5% ] 0.24% | 308,816 | 4.3% |
[ 0.0% - 0.5% ] 0.25% | 389,797 | 6.6% |
[ 0.0% - 0.5% ] 0.26% | 368,965 | 5.8% |
[ 0.0% - 0.5% ] 0.28% | 292,164 | 8.8% |
[ 0.0% - 0.5% ] 0.29% | 203,721 | 7.7% |
[ 0.0% - 0.5% ] 0.31% | 68,733 | 5.5% |
[ 0.0% - 0.5% ] 0.32% | 177,950 | 6.0% |
[ 0.0% - 0.5% ] 0.34% | 442,018 | 5.8% |
[ 0.0% - 0.5% ] 0.35% | 212,042 | 6.1% |
[ 0.0% - 0.5% ] 0.37% | 115,731 | 7.4% |
[ 0.0% - 0.5% ] 0.38% | 37,275 | 5.5% |
[ 0.0% - 0.5% ] 0.39% | 179,183 | 5.1% |
[ 0.0% - 0.5% ] 0.40% | 32,285 | 11.0% |
[ 0.0% - 0.5% ] 0.42% | 145,330 | 2.7% |
[ 0.0% - 0.5% ] 0.43% | 3,020 | 12.4% |
[ 0.0% - 0.5% ] 0.45% | 47,668 | 10.3% |
[ 0.0% - 0.5% ] 0.47% | 47,883 | 6.5% |
[ 0.0% - 0.5% ] 0.47% | 37,604 | 9.3% |
[ 0.0% - 0.5% ] 0.49% | 91,974 | 4.6% |
[ 0.5% - 1.0% ] 0.51% | 32,450 | 8.4% |
[ 0.5% - 1.0% ] 0.52% | 76,887 | 6.4% |
[ 0.5% - 1.0% ] 0.57% | 19,959 | 2.9% |
[ 0.5% - 1.0% ] 0.58% | 32,964 | 4.6% |
[ 0.5% - 1.0% ] 0.59% | 22,294 | 5.3% |
[ 0.5% - 1.0% ] 0.62% | 45,735 | 9.8% |
[ 0.5% - 1.0% ] 0.65% | 78,624 | 5.5% |
[ 0.5% - 1.0% ] 0.67% | 1,490 | 0.98% |
[ 0.5% - 1.0% ] 0.68% | 68,499 | 6.2% |
[ 0.5% - 1.0% ] 0.69% | 135,828 | 3.3% |
[ 0.5% - 1.0% ] 0.72% | 43,820 | 6.6% |
[ 0.5% - 1.0% ] 0.73% | 5,732 | 11.7% |
[ 0.5% - 1.0% ] 0.77% | 20,903 | 6.5% |
[ 0.5% - 1.0% ] 0.78% | 255 | 8.9% |
[ 0.5% - 1.0% ] 0.81% | 2,725 | 2.0% |
[ 0.5% - 1.0% ] 0.83% | 88,272 | 6.6% |
[ 0.5% - 1.0% ] 0.86% | 30,306 | 7.8% |
[ 0.5% - 1.0% ] 0.95% | 43,516 | 6.3% |
[ 0.5% - 1.0% ] 0.98% | 14,741 | 0.97% |
[ 0.5% - 1.0% ] 0.99% | 1,814 | 27.9% |
[ 1.0% - 1.5% ] 1.01% | 24,317 | 13.9% |
[ 1.0% - 1.5% ] 1.05% | 37,954 | 1.1% |
[ 1.0% - 1.5% ] 1.08% | 13,706 | 2.6% |
[ 1.0% - 1.5% ] 1.09% | 10,248 | 7.6% |
[ 1.0% - 1.5% ] 1.10% | 64,826 | 8.0% |
[ 1.0% - 1.5% ] 1.28% | 19,088 | 13.0% |
[ 1.0% - 1.5% ] 1.35% | 3,415 | 11.6% |
[ 1.5% - 2.0% ] 1.54% | 13,425 | 6.0% |
[ 1.5% - 2.0% ] 1.87% | 2,465 | 12.4% |
[ 2.0% - 2.5% ] 2.24% | 2,144 | 10.7% |
[ 2.0% - 2.5% ] 2.44% | 4,880 | 3.5% |